By Microsoft Mixed Reality & AI Labs in Cambridge and Zurich
Computer vision is one of the most remarkable developments to emerge from the field of computer science. It’s among the most rapidly growing areas in the technology landscape and has the potential to significantly impact the way people live and work. Advances at the intersection of machine learning (ML) and computer vision have been accelerating in recent years, leading to significant progress in numerous fields, including healthcare, robotics, the automotive industry, and augmented reality (AR). Microsoft is proud to be a prominent contributor to computer vision research.
Microsoft researchers have long been collaborating with academics and experts in the field on numerous computer vision projects with the goal of expanding what’s possible and helping people achieve more. One example is PeopleLens, a head-worn device that helps children who are blind or have low vision more easily interact in social situations by identifying people around them through spatialized audio. Another example is Swin Transformer. This computer vision architecture attains high accuracy in object detection and provides an opportunity to unify computer vision and natural language processing (NLP) architectures—increasing the capacity and adaptability of computer vision models.
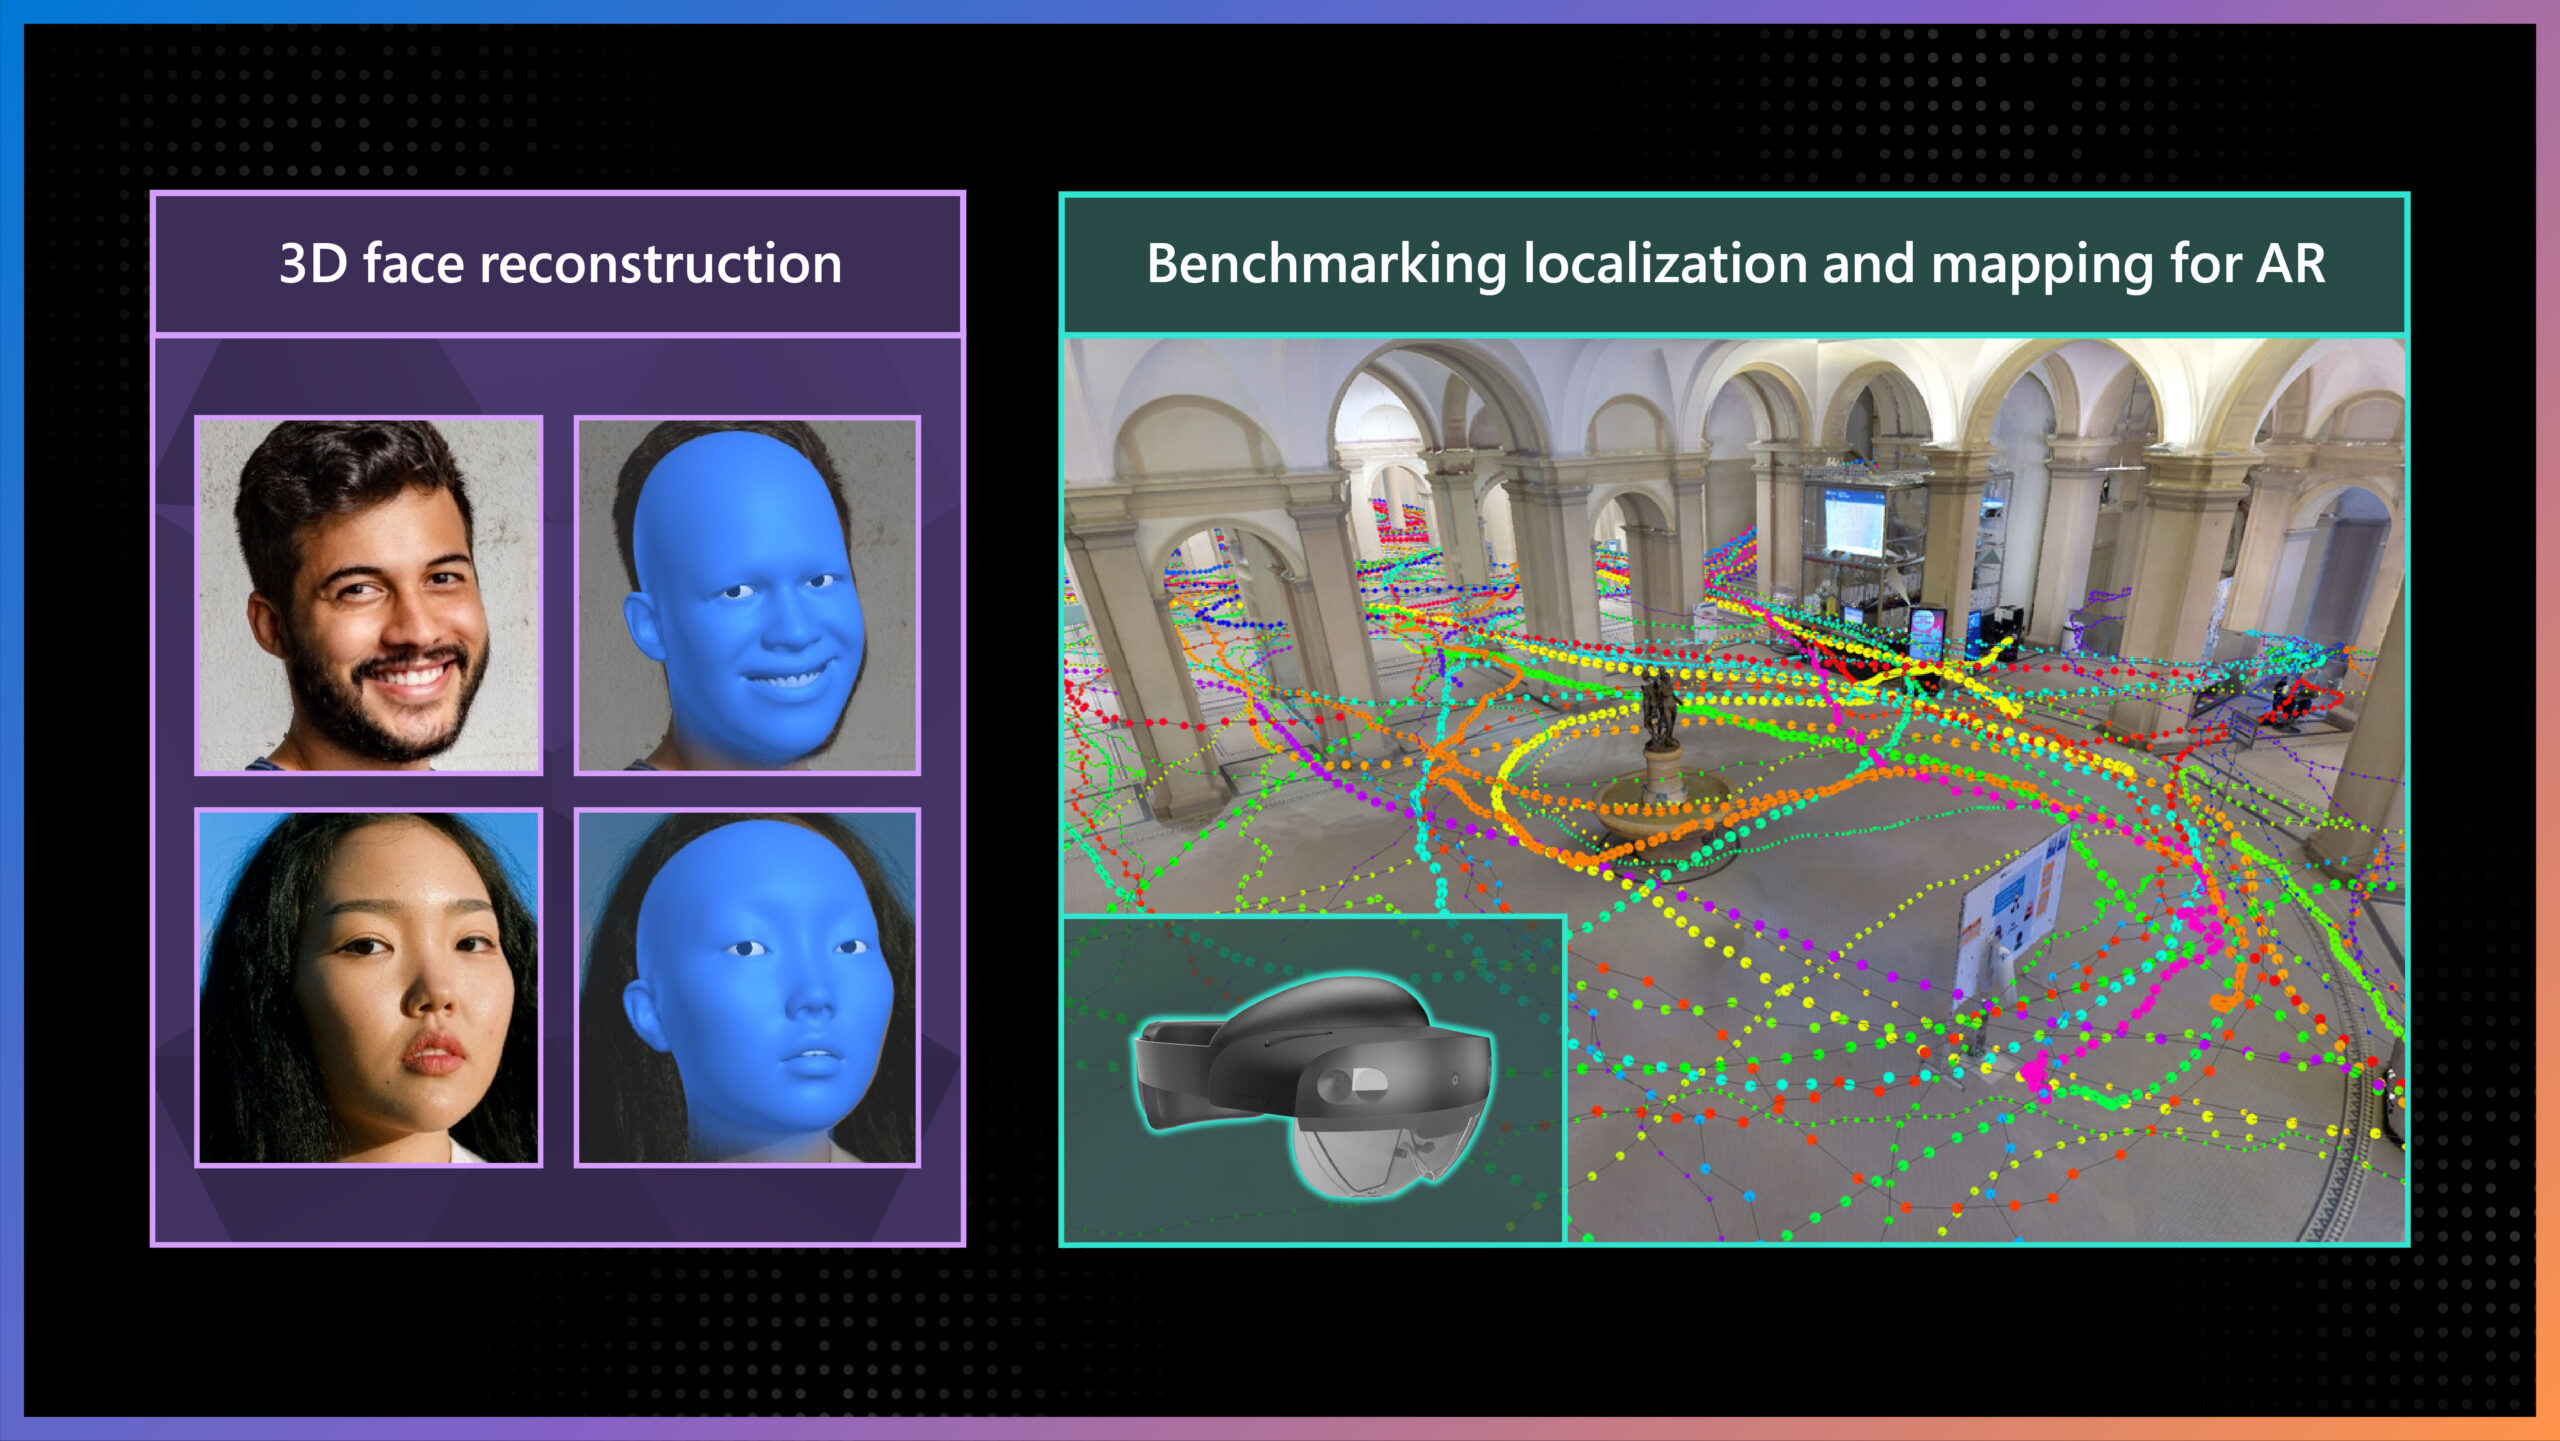
Microsoft Research is excited to share some of its newest work in this space at the European Conference on Computer Vision (ECCV) 2022, with 45 accepted papers that will be presented through live presentations, tutorials, and poster sessions. This post highlights two of these papers, which showcase the latest research from Microsoft and its collaborators. One involves increasing the number of facial landmarks for more accurate 3D face reconstruction, achieving state-of-the-art results while decreasing the required compute power. The other introduces a dataset that takes advantage of the capabilities of AR devices for visual localization and mapping driven by real-world AR scenarios.
3D face reconstruction with dense landmarks
Facial landmarks are points that correspond across all faces, and they often play a key role in face analysis. Researchers frequently rely on them when performing basic computer vision tasks, such as estimating head position and identifying gaze direction and more generally the position in space of all the details of the face. Facial landmarks include such areas as the tip of the nose, corners of the eyes, and points along the jawline. Typically, public datasets that practitioners use to train ML models contain annotations for 68 facial landmarks. However, numerous aspects of human faces are not precisely represented by 68 landmarks alone, and additional methods are often needed to supplement landmark detection, adding complexity to the training workflow and increasing the required compute power.
-
GitHub
Dense Landmarks
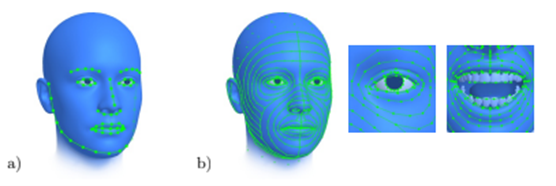
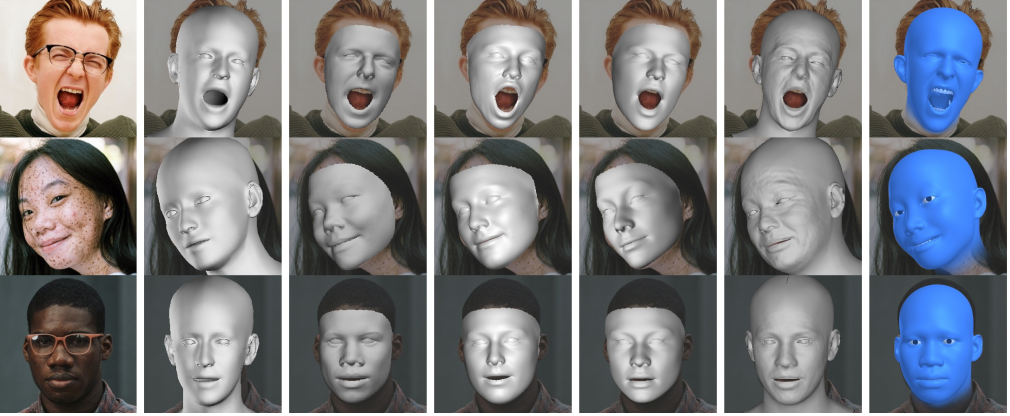
With the goal of achieving accurate 3D face reconstruction, we propose increasing the number of facial landmarks. In our paper “3D Face Reconstruction with Dense Landmarks,” we introduce a method to accurately predict 703 facial landmarks, more than 10 times as many as are commonly used, covering the entire face in great detail, including the eyes, ears, and teeth, as shown in Figure 1. We show that the increased number of landmarks are very precise when visible, and when they are occluded, for example, when someone lifts a coffee mug to their lips, we can estimate the location of these landmarks and what the part of the face looks like behind the object blocking it. We can use these landmarks to constrain a model-fitting problem to efficiently and precisely estimate all aspects of a face model, shown in the right-most column in Figure 2. This includes the head pose, eye gaze, as well as the identity of the person whose face is being reconstructed, for example, the thickness of the lips and the shape of the nose.
This simple pipeline is comprised only of dense landmarks and continuous mathematical optimization, allowing for extreme compute efficiency and enabling the entire system to run at over 150 frames per second on a single core of a laptop.
Increasing privacy, fairness, and efficiency with synthetic data
In computer vision, and particularly the area of face reconstruction, there are understandable concerns about anonymity when training ML models because training data often comes from real people. Our proposed method significantly reduces privacy concerns, as it uses only synthetic data to train ML models, compared with methods that use images of real people as part of their training datasets. That said, when we built the synthetic data pipeline, we needed to preserve the privacy of the people whose data we used, and we took care to acquire the consent of those several hundred subjects. This contrasts with the feasibility of acquiring consent from thousands (or even tens of thousands) of subjects, which would have been necessary if we were using real data.
It’s especially challenging, if not impossible, to preserve the privacy of people appearing in “found images” online, where the subject is often unknown. Using synthetic data helps us protect the privacy of data subjects and the rights of photographers and content creators. It’s another tool we can use in our mission to build technology in an ethical and responsible manner. Additionally, because people’s private information is not included in our dataset, if the ML model were to be attacked, only synthetic data would be subject to compromise.
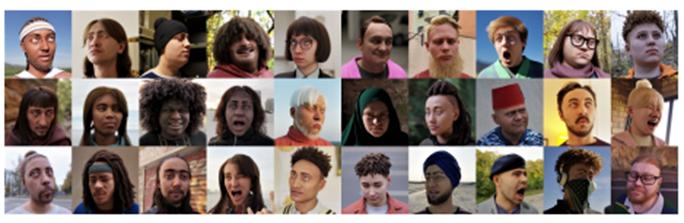
Synthetic data also provides an opportunity to address inclusivity and fairness. Largely because the distribution of the data is fully controlled, ML practitioners can manage the fairness of representation by including diverse samples in their datasets, and all the data needed to do this would be perfectly labeled. For further details on how we build the synthetics model and training data and our approach to capturing the diversity of the human population, please see our face analysis paper.
There are other advantages to using synthetic data to train ML models, as well. For example, these models require a lot of data, giving rise to numerous difficulties that practitioners must navigate to obtain this data, such as the logistics of finding the number of people required, scheduling time in a lab, and situating multiple cameras to capture the various angles of a person’s face. These concerns are greatly reduced with synthetic data.
In addition, because data doesn’t need to be sourced from a real person, the iteration speed to improve the quality of the 3D face reconstruction is remarkably high, creating a robust workflow. And it isn’t necessary to apply quality assurance (QA) processes on each labeled image when using synthetic data—another cost- and time-saving benefit. Another advantage is the increase in accuracy, speed, and cost-effectiveness in labeling data. It would be nearly impossible to ask someone to consistently label 703 landmarks in a set of images.
Face analysis is a foundational piece for many ML systems, such as facial recognition and controlling avatars, and using a method that provides both accuracy and efficiency while also addressing privacy and fairness concerns pushes the boundaries of the state of the art. Up until now, there hasn’t been much work, if any, on methods that can yield this level of quality with only synthetic data. The ability to achieve 3D face reconstruction using dense landmarks and synthetic data has the potential to truly transform what’s possible with ML.
Acknowledgments
This research was conducted by Erroll Wood, Tadas Baltrušaitis, Charlie Hewitt, Matthew Johnson, Jingjing Shen, Nikola Milosavljević, Daniel Wilde, Stephan Garbin, Chirag Raman, Jamie Shotton, Toby Sharp, Ivan Stojiljković, Tom Cashman, and Julien Valentin.
LaMAR: Benchmarking localization and mapping for augmented reality
To unlock the full potential of augmented reality (AR), anyone using a mixed reality headset should be able to place virtual content in the physical world, share it with others, and expect it to remain in place over time. However, before they can augment digital content in the real world in the form of holograms, AR devices need to build a digital map of the physical 3D world. These devices then position, or re-localize, themselves with respect to this map, as illustrated in Figure 4, which allows them to retrieve previously placed holograms and show them to the user at a designated location. The computer vision foundations enabling these capabilities are called mapping and visual localization.
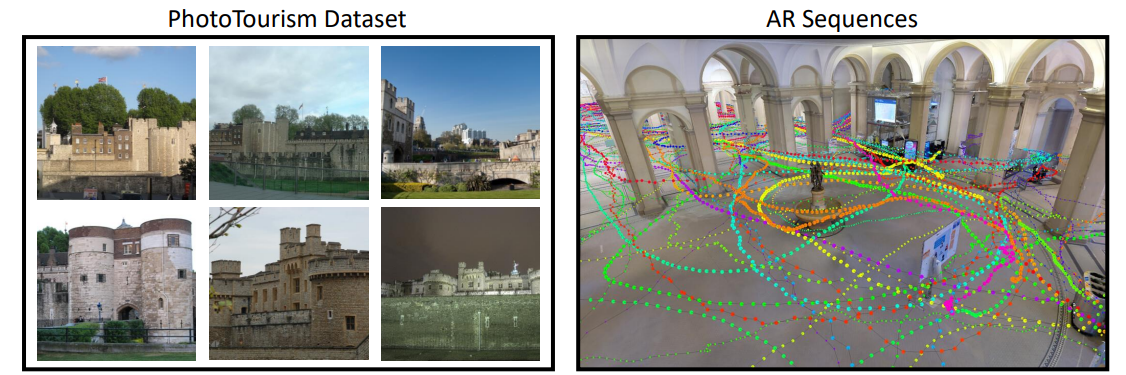
In general, research in visual localization focuses on single images, usually carefully selected views of famous attractions, shown on the left in Figure 5. However, this doesn’t reflect real AR scenarios—the combination of AR devices and applications—and the opportunity they provide. AR devices can locally map the environment and provide spatially registered sequences rather than single images, as shown in the image on the right in Figure 5. These sequences can also include additional data, like inertial or radio signals from sensors, which are typically available on modern AR devices, such as Microsoft HoloLens 2. Yet it’s challenging to use such sequences for localization because they are typically just collected during normal device usage and not generally aimed at facilitating localization.
To close this gap, we introduce a new benchmark, the first to focus on this more realistic setting for AR, with the understanding that visual re-localization is a key element for compelling, shared, and persistent AR experiences. Given the spatial scale of the environment for typical AR scenarios, such as navigating an airport or inspecting a factory, we had to design a pipeline that could automatically compute the ground-truth camera positions of real AR sequences captured by a variety of readily available AR devices, such as the HoloLens or iPhone. By evaluating state-of-the-art methods on our benchmark, we offer novel insights on current research and provide avenues for future work in the field of visual localization and mapping for AR.
This research is a result of a two-year collaboration between the Microsoft Mixed Reality & AI Lab in Zurich and ETH Zurich (Swiss Federal Institute of Technology) and will be published at ECCV 2022 in the paper, “LaMAR: Benchmarking Localization and Mapping for Augmented Reality.” We will also be giving a tutorial called Localization and Mapping for AR at ECCV.
Developing a large-scale AR dataset
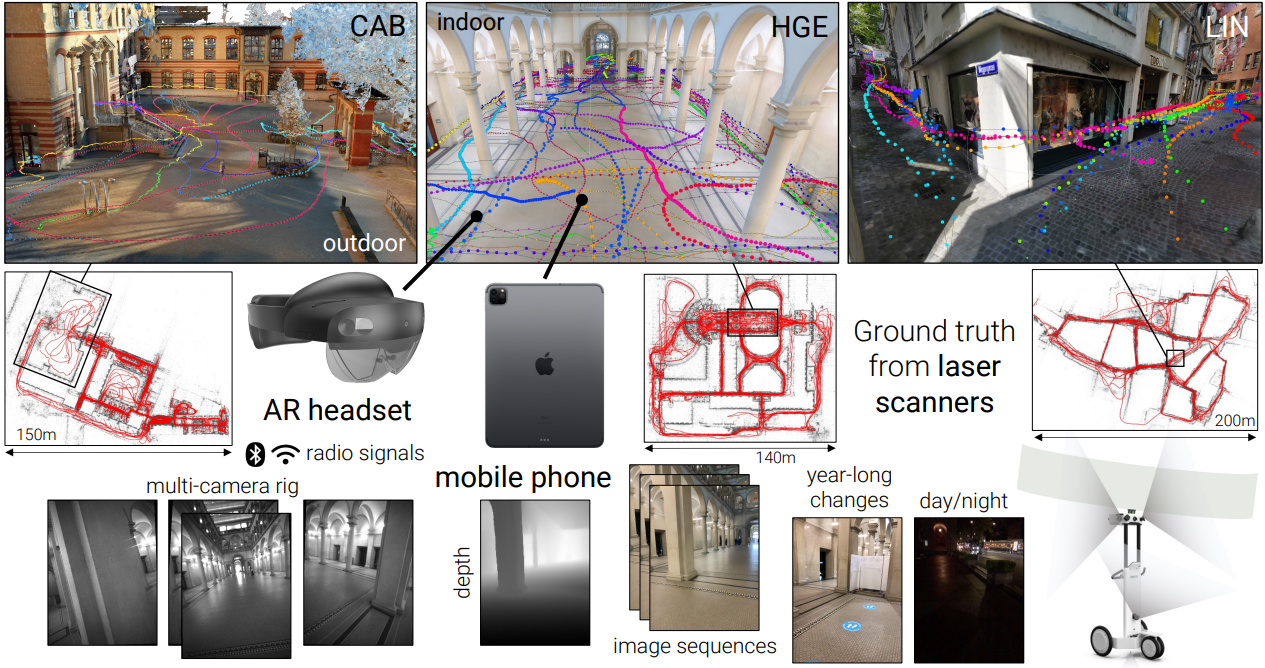
To enable the research community to address the specifics of mapping and visual localization in the context of AR, we collected multi-sensor data streams from modern AR devices. These sensor streams come with camera poses (the camera’s position and orientation) from the on-device tracker at each instant. These data streams also contain images, depth measurements, samples from inertial measurement units (IMUs), and radio signals. Exploiting these can lead to more efficient algorithms. For example, radio signals such as Wi-Fi or Bluetooth can simplify image retrieval. Similarly, sequence localization can exploit the temporal aspect of sensor streams to provide a more spatial context, which can lead to more accurate estimates of camera poses. This typifies the realistic use case of a user launching an AR application and streaming sensorial data to localize the camera with respect to a previously built map, and it reflects how AR applications built on mixed reality cloud services, like Azure Spatial Anchors, work.
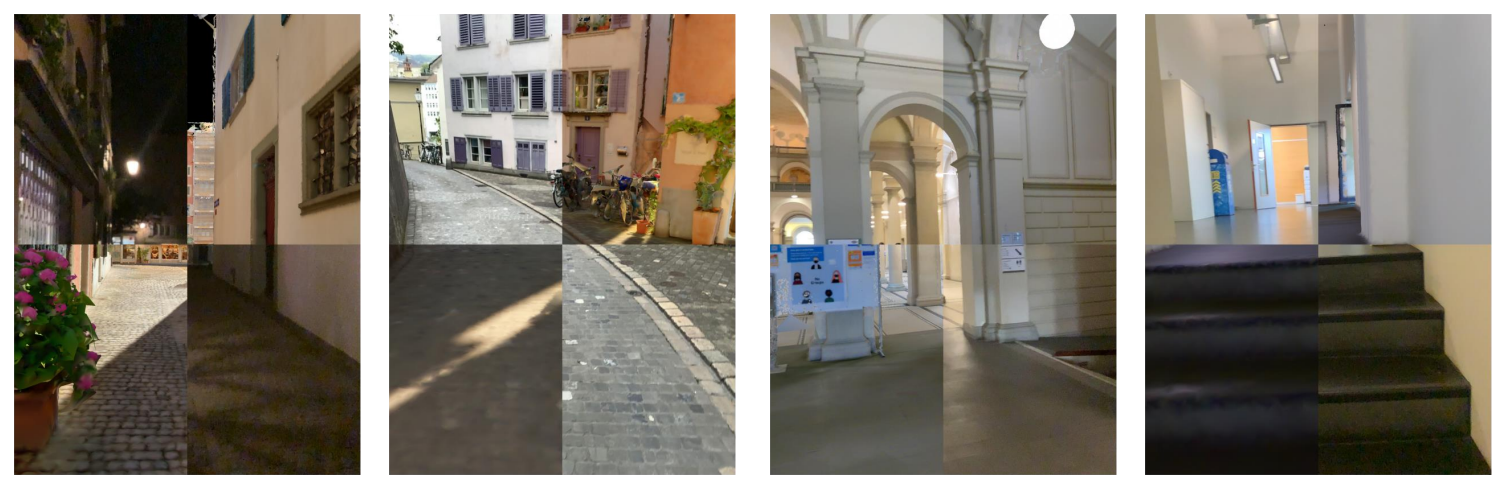
The initial release of the LaMAR dataset contains more than 100 hours of recordings covering 45,000 square meters (484,000 square feet) captured over the course of two years using the head-mounted HoloLens 2 and handheld iPhone/iPad devices. The data was captured at various indoor and outdoor locations (a historical building, a multi-story office building, and part of a city center) and represents typical AR scenarios. It includes changes in illumination and the movement of objects—either slowly, such as the placement of a book on a desk, or more quickly, like anonymized people walking down a sidewalk.
Automatically aligning AR sequences to establish ground truth
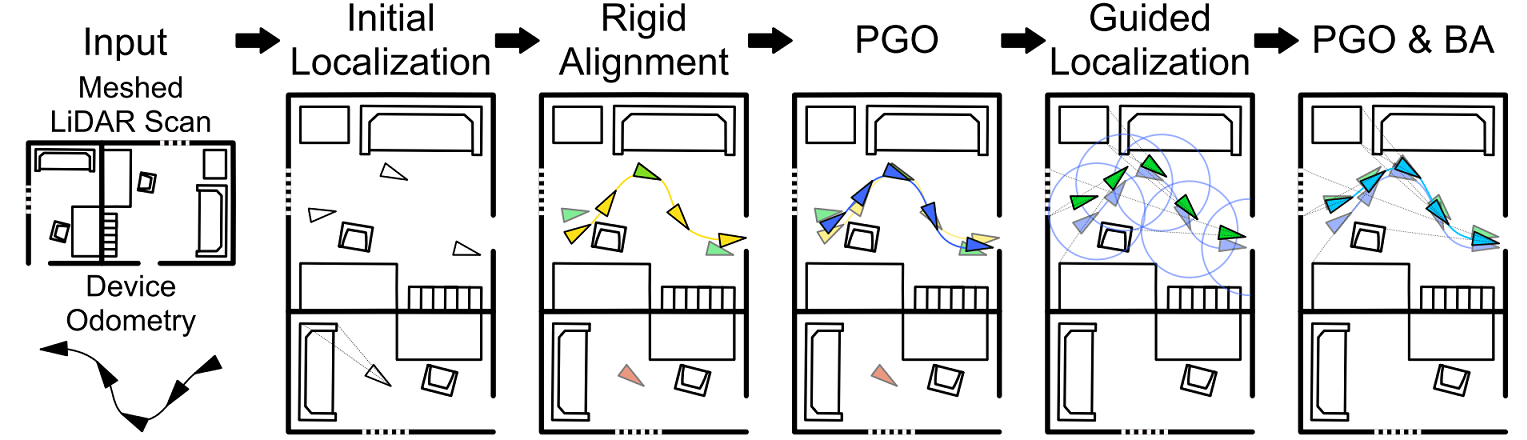
To estimate the ground-truth camera poses, we aligned the captured data with reference 3D models of the locations, as shown in Figure 8. These reference models were captured using NavVis M6 and VLX mapping systems, both equipped with laser scanners (lidars) that generate dense, textured, and highly accurate 3D models of the locations. To align the data, we developed a robust pipeline that does not require manual labeling or setting custom infrastructure, such as fiducial markers, and this enabled us to robustly handle crowd-sourced data from a variety of AR devices captured over extended periods.
The actual alignment process is fully automatic and utilizes the on-device real-time tracker of AR devices, which provides camera poses in their local coordinate system. We aligned each captured sequence individually with the dense ground truth reference model, as illustrated in Figure 9. Once completed, all camera poses were refined jointly by optimizing the visual constraints within and across sequences.
Evaluating localization and mapping in the context of AR
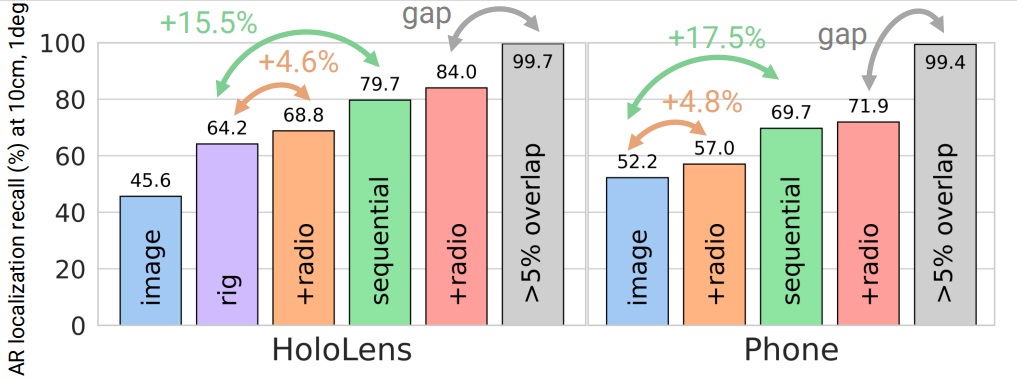
We evaluated current state-of-the-art approaches in the single-frame setting as localizing i) single images obtained from phones and ii) single images and full camera rigs from HoloLens 2. Then we adapted these state-of-the-art approaches to take advantage of radio signals. Finally, we designed baselines, building on these methods and utilizing the on-device real-time tracker in a multi-frame localization setting corresponding to a real-world AR application. The results show that performance of state-of-the-art methods can be significantly improved by including these additional data streams generally available in modern AR devices, as shown in Figure 10.
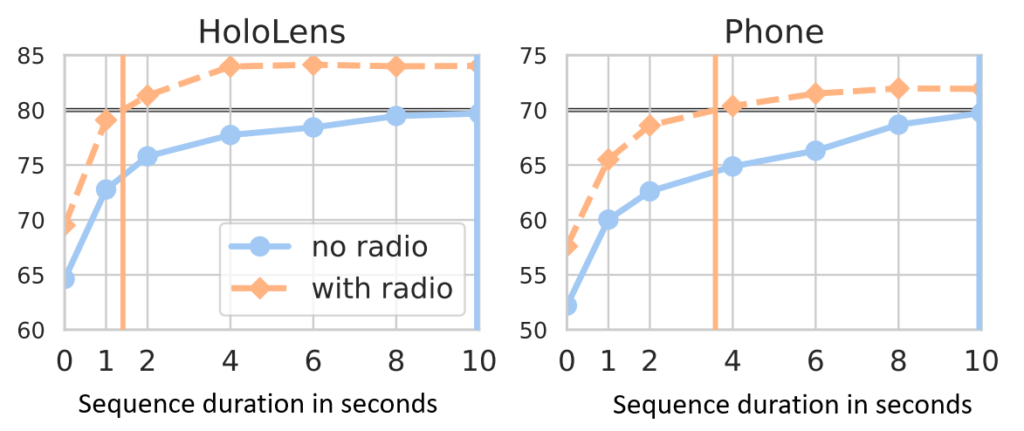
For a compelling user experience, AR applications should strive to retrieve and visualize content as quickly as possible after starting a session. To quantify this, we introduce a new metric called time-to-recall, which measures the sequence duration needed for successful localization. This encourages researchers to develop algorithms to accurately localize the camera as quickly as possible, as shown in Figure 11.
Using the LaMAR benchmark
LaMAR is the first benchmark that focuses on a realistic setup for visual localization and mapping using AR devices. The evaluation results show enormous potential for leveraging posed sequences instead of single frames and for leveraging other sensor modalities, like radio signals, to localize the camera and map the environment.
Researchers can access the LaMAR benchmark, evaluation server, implementations of the ground-truth pipeline, as well as baselines with additional sensory data at the LaMAR Benchmark page. We hope this work inspires future research in developing localization and mapping algorithms tailored to real AR scenarios.
Acknowledgments
This research was conducted by Paul-Edouard Sarlin, Mihai Dusmanu, Johannes L. Schönberger, Pablo Speciale, Lukas Gruber, Viktor Larsson, Ondrej Miksik, and Marc Pollefeys.
The post ECCV 2022 highlights: Advancing the foundations of mixed reality appeared first on Microsoft Research.