Improving LLM understanding of structured data and exploring advanced prompting methods

This research paper was presented at the 17th ACM International Conference on Web Search and Data Mining (opens in new tab) (WSDM 2024), the premier conference on web-inspired research on search and data mining.

WSDM logo in white to the left of the first page of the

In today’s data-driven landscape, tables are indispensable for organizing and presenting information, particularly text. They streamline repetitive content, enhance data manageability, enable easier data analysis, and improve machine processing capabilities. Meanwhile, large language models (LLMs) are advancing in their ability to tackle challenges associated with natural language, but the degree to which they understand tables included in their prompts remains an open question. Our research aims to explore this question and improve how LLMs use and work with table-based data.

Our paper, “Table Meets LLM: Can Large Language Models Understand Structured Table Data? A Benchmark and Empirical Study (opens in new tab),” presented at WSDM 2024 (opens in new tab), investigates what kinds of prompts most effectively enable LLMs to understand tables; how much LLMs inherently detect structured data; and how LLMs’ existing knowledge can be harnessed to improve this understanding. We also analyze the complex trade-off among multiple combinations of input designs and overall performance.

To address these questions, we propose a new benchmark called Structural Understanding Capabilities (SUC), shown in Figure 1 (a), which focuses on specific tasks to assess LLMs’ ability to understand structured data in tables and compare different types of prompts. We conducted a series of experiments using different prompt designs. Our findings, detailed in the paper, evaluate how each design enhances LLMs’ ability to work with tables. 

The image (a) is a flowchart with three main columns that illustrate the stages, capabilities, and tasks associated with a process benchmarked by SUC (Semantic Understanding Capability), and their application in input designs. Here is the detailed alt text for the image: Flowchart illustrates the detailed design of the Semantic Understanding Capability Benchmark. The leftmost column is labeled 'Stages' with two main stages: 'Partition & Parsing' in blue and 'Search & Retrieval' in pink. Each stage is associated with 'Capabilities' in the middle column. 'Partition & Parsing' includes 'Structural Description Detection', 'Format Understanding', and 'Hierarchy Detection'. 'Search & Retrieval' includes 'Grounding/Locating' and 'Operation Reasoning'. These capabilities correspond to 'Tasks' in the third column. For 'Partition & Parsing', tasks are 'Table Partition', 'Table Size Detection', and 'Hierarchy Detection'. For 'Search & Retrieval', tasks are 'Cell Lookup & Reverse Lookup' and 'Column & Row Retrieval'.  


To the right of these columns is image (b) labeled 'Input Designs' connected to 'Partition Mark', 'Serialization', 'Role Prompting', 'Order Permutation', and 'Format Explanation'. These are further linked to types of 'Markup Languages' represented in green boxes: 'HTML', 'XML', 'Markdown', and more indicated by ellipses. Image (b) covers the input designs for the SUC evaluation.
Figure 1. The SUC benchmark and prompt designs for evaluation.

Insights and findings using the SUC benchmark

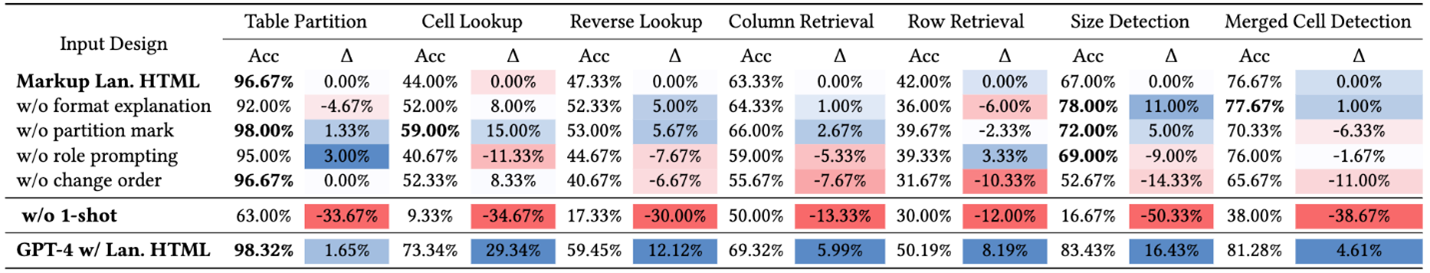
Based on humans’ perception of tables, we developed tasks to evaluate how LLMs understand them. We conducted evaluations on GPT-3.5 and GPT-4 and discovered that the results depended on certain input factors, such as table format, content order, and partition marks. The findings, detailed in Tables 1 and 2, reveal some notable and unexpected findings:

  • Delimiter-separated formats (e.g., CSV, TSV), underperformed compared with HTML by 6.76 percent.
  • Using HTML and few-shot learning consistently improved performance. The effectiveness of other approaches, such as format explanation, role prompting, order change, and partition marks, varied depending on task difficulty and the required capacity.
  • Despite the simplicity of the benchmark tasks, the highest overall accuracy across seven tasks is only 65.43 percent. This underscores the need for LLMs to have better awareness of table structures and highlights areas for further improvement in table serialization.

Our exploration suggests that:

  • LLMs have a basic understanding of table structures but are far from perfect, even in straightforward tasks like detecting the number of columns and rows.
  • Choosing the right combination of input designs can significantly enhance LLMs’ understanding of structured data.

Our findings revealed significant performance gaps in downstream tasks, attributed to the different combinations of serialization functions and input options. These gaps remained even with GPT-4, underscoring the effectiveness of our benchmark approach.

This is a table regarding the comparison table displaying the accuracy (Acc) of GPT-4 versus previous models in different tasks. Tasks include Table Partition, Cell Lookup, Reverse Lookup, Column Retrieval, Row Retrieval, Size Detection, and Merged Cell Detection. The data formats compared are NL + Sep, Markdown, JSON, XML, and HTML. GPT-4 shows improved accuracy across nearly all tasks and formats compared to its predecessors, with notable high accuracy in the HTML format for Table Partition and Merged Cell Detection tasks.
Table 1. SUC benchmark evaluations on table formats.
This table presents the comparison of accuracy (Acc) and changes in accuracy (Δ) for different input designs using GPT-4 on various tasks. The tasks include Table Partition, Cell Lookup, Reverse Lookup, Column Retrieval, Row Retrieval, Size Detection, and Merged Cell Detection. The input designs tested are Markup Language HTML with and without various components such as format explanation, partition mark, role prompting, and change order, as well as without 1-shot learning. The last row shows the performance of GPT-4 with Language HTML. The table displays positive and negative changes in percentages with respective tasks, highlighting the impact of each input design modification on the model's accuracy.
Table 2. Ablation study of input designs using the SUC benchmark.

Improved performance with self-augmented prompting

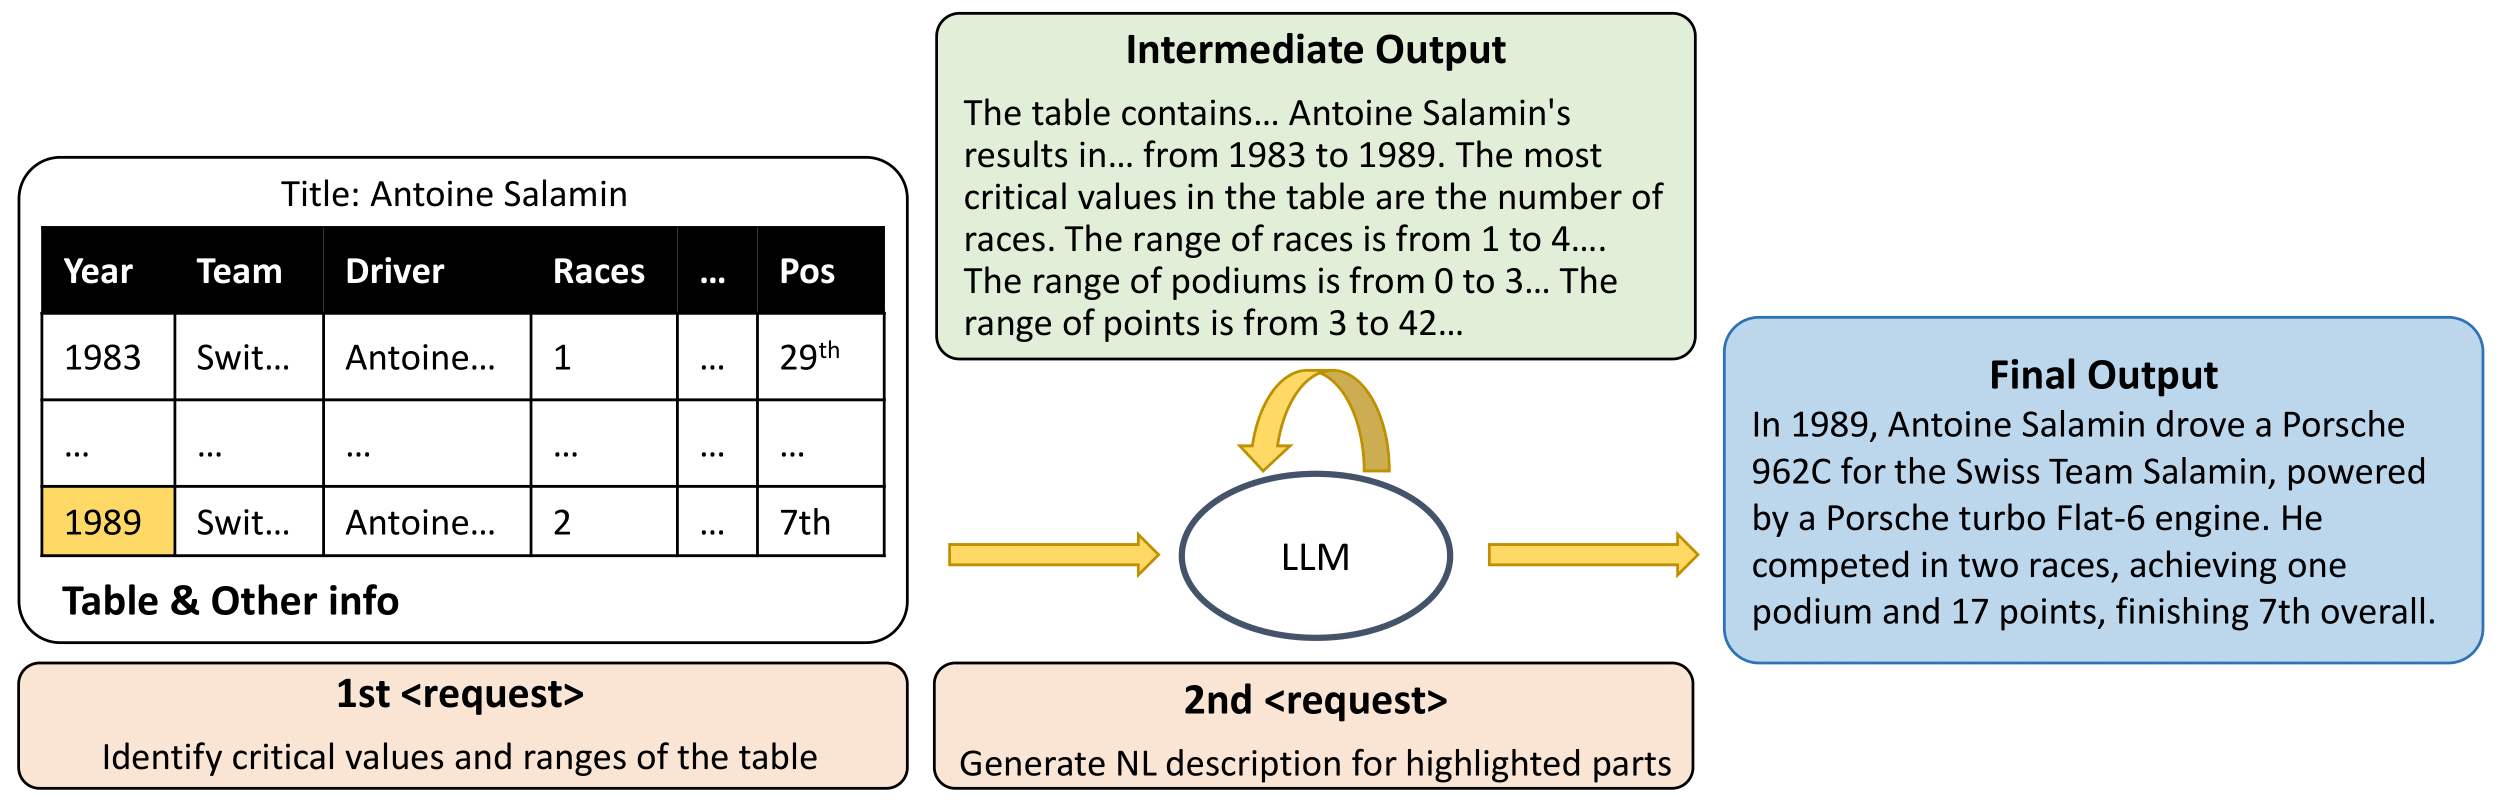
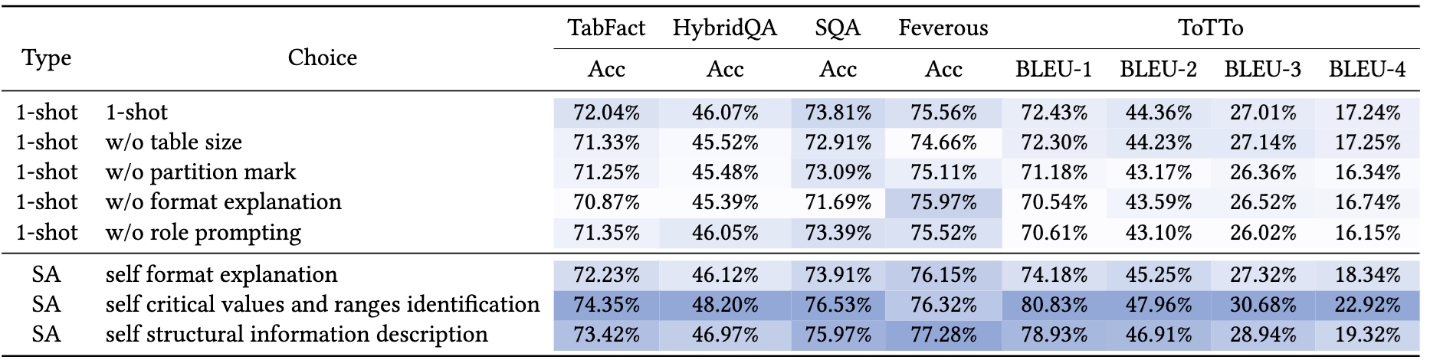
Based on these benchmark evaluations, we investigated how LLMs’ existing knowledge could be used to enhance their understanding of structured data. To do this, we introduced self-augmentation, a model-agnostic technique that improves structural prompting—enabling LLMs to identify key values and ranges by tapping into their own internal knowledge. This technique simplifies and optimizes how LLMs utilize their existing knowledge base to improve their understanding of structured content, allowing them to generate intermediate structural insights. This process is shown in Figure 2, with the results detailed in Table 3.

The image depicts a diagram showing the Self-augmented Prompting workflow that involves an initial table, an intermediate output, and a final output. Here is the detailed alt text for the image: On the left, there's a table with the title 'Antoine Salamin' and columns labeled 'Year', 'Team', 'Driver', 'Races', and 'Pos'. Two rows are visible with the years 1983 and 1989, team name starting with 'Swit...', driver name starting with 'Antoine...', and positions '29th' and '7th' highlighted in the last visible row. Below the table is a box labeled 'Table & Other info' and an arrow pointing right labeled '1st request' with the text 'Identify critical values and ranges of the table'. 


In the center, a green box with rounded corners titled 'Intermediate Output' contains text summarizing the table's content, mentioning Antoine Salamin's results from 1983 to 1989, the number of races, podiums, and points range. There's an arrow looping back to the first box with 'LLM' written above it, indicating a feedback loop for further processing. 


On the right, a blue box with rounded corners titled 'Final Output' contains a narrative description saying 'In 1989, Antoine Salamin drove a Porsche 962C for the Swiss Team Salamin, powered by a Porsche turbo Flat-6 engine. He competed in two races, achieving one podium and 17 points, finishing 7th overall.' An arrow labeled '2nd request' points from the '1st request' to the 'Intermediate Output' and another from there to the 'Final Output', indicating the sequence of processing requests.
Figure 2. Self-augmented prompting.
This table is comparing the accuracy (Acc) and BLEU scores for different types of input choices on various question-answering datasets: TabFact, HybridQA, SQA, Feverous, and ToTTo. The types include 1-shot and self-explanation approaches (SA) with various modifications such as without table size, partition mark, format explanation, role prompting, critical values and ranges identification, and structural information description. Each row shows the impact of these modifications on the model's performance, with accuracy percentages for the datasets and BLEU-1 to BLEU-4 scores for the ToTTo dataset.
Table 3. Evaluation of downstream tasks. “SA” refers to self-augmented prompting.

Looking forward

Our study sets a key benchmark in expanding the capabilities of LLMs to better understand structured table data, moving beyond conventional natural language processing tasks. We suggest future research should prioritize the integration of structural information to improve performance with various structured data types. Additionally, we propose exploring LLMs’ ability to use external tools or agents for improved handling of structured data, opening new avenues for application.

The post Improving LLM understanding of structured data and exploring advanced prompting methods appeared first on Microsoft Research.

Read More