
As the pandemic overburdens medical facilities and clinicians become increasingly overworked, the ability to make quick decisions on providing the best possible treatment is even more critical. In urgent health situations, such decisions can mean life or death. However, certain treatment protocols can pose a considerable risk to patients who have serious medical conditions and can potentially contribute to unintended outcomes.
In this research project, we built a machine learning (ML) model that works with scenarios where data is limited, such as healthcare. This model was developed to recognize treatment protocols that could contribute to negative outcomes and to alert clinicians when a patient’s health could decline to a dangerous level. You can explore the details of this research project in our research paper, “Medical Dead-ends and Learning to Identify High-risk States and Treatments,” which was presented at the 2021 Conference on Neural Information Processing Systems (NeurIPS 2021).
Reinforcement learning for healthcare
To build our model, we decided to use reinforcement learning—an ML framework that’s uniquely well-suited for advancing safety-critical domains such as healthcare. This is because at its core, healthcare is a sequential decision-making domain, and reinforcement learning is the formal paradigm for modeling and solving problems in such domains. In healthcare, clinicians base their treatment decisions on an overall understanding of a patient’s health; they observe how the patient responds to this treatment, and the process repeats. Likewise, in reinforcement learning, an algorithm, or agent, interprets the state of its environment and takes an action, which, coupled with the internal dynamics of the environment, causes it to transition to a new state, as shown in Figure 1. A reward signal is then assigned to account for the immediate impact of this change. For example, in a healthcare scenario, if a patient recovers or is discharged from the intensive care unit (ICU), the agent may receive a positive reward. However, if the patient does not survive, the agent receives a negative reward, or penalty.

Reinforcement learning is widely used in gaming, for example, to determine the best sequence of chess moves and maximize an AI system’s chances of winning. Over time, due to trial-and-error experimentation, the desired actions are maximized and the undesired ones are minimized until the optimal solution is identified. Normally, this experimentation is made possible by the proactive collection of extensive amounts of diverse data. However, unlike in gaming, exploratory data collection and experimentation are not possible in healthcare, and our only option in this realm is to work with previously collected datasets, providing very limited opportunities to explore alternative choices. This is where offline reinforcement learning comes into focus. A subarea of reinforcement learning, offline reinforcement learning works only with data that already exists—instead of proactively taking in new data, we’re using a fixed dataset. Even so, to propose the best course of action, an offline reinforcement learning algorithm still requires sufficient trial-and-error with alternatives, and this necessitates a very large dataset, something not feasible in safety-critical domains with limited data, like healthcare.
In the current research literature, when reinforcement learning is applied to healthcare, the focus is on what to do to support the best possible patient outcome, an infeasible objective. In our paper, we propose inverting this paradigm in offline settings to investigate high-risk treatments and identify when the state of patients’ health reaches a critical point. To enable this approach, we developed a methodology called Dead-end Discovery (DeD), which identifies treatments to avoid in order to prevent a medical dead-end—the point at which the patient is most likely to die regardless of future treatment. DeD provably requires exponentially less data than the standard methods, making it significantly more reliable in limited-data situations. By identifying known high-risk treatments, DeD could assist clinicians in making trustworthy decisions in highly stressful situations, where minutes count. Moreover, this methodology could also raise an early warning flag and alert clinicians when a patient’s condition reveals outstanding risk, often before it becomes obvious. We go into more detail on the DeD methodology later in this post.
Medical dead-ends and rescue states
At ICUs, patients experience a trajectory which sequentially tracks the state of their health. It starts with the patient’s condition upon admission, followed by the administration of treatment and then by their response to the treatment. This sequence repeats until the patient reaches a terminal state—the final observation of the patient’s condition that’s still relevant within the ICU. To learn what treatments to avoid, we focus on two types of terminal states: patient recovery and patient death. Other terminal states can also exist. For example, when playing chess, a loss or a win are not the only possible outcomes; draws can also occur. While our framework can encompass additional terminal states, this work focuses on only two possibilities: positive outcomes and negative outcomes.
Building on these two terminal states, we define medical dead-ends as patient states from which all possible future trajectories will lead to the terminal state of the patient’s death. If applied in acute care settings, it’s critical to both avoid medical dead-ends and identify the probability with which any selected treatment will lead to them. It’s also important to note that medical dead-ends can occur considerably earlier than clinicians are able to observe. This makes DeD particularly valuable, as every hour counts when it comes to critical conditions.
To contrast with medical dead-ends, we also propose the concept of rescue states, where recovery is fully reachable. At each rescue state, there exists at least one treatment that would lead, with the probability of 1, either to another rescue state or to recovery. In most cases, a patient’s condition is neither a medical dead-end nor a rescue state, as the minimum and maximum probability of future mortality or recovery is not always 0 and 1, but somewhere in between. Therefore, it’s important to have an alert when a patient is likely to enter a medical dead-end.
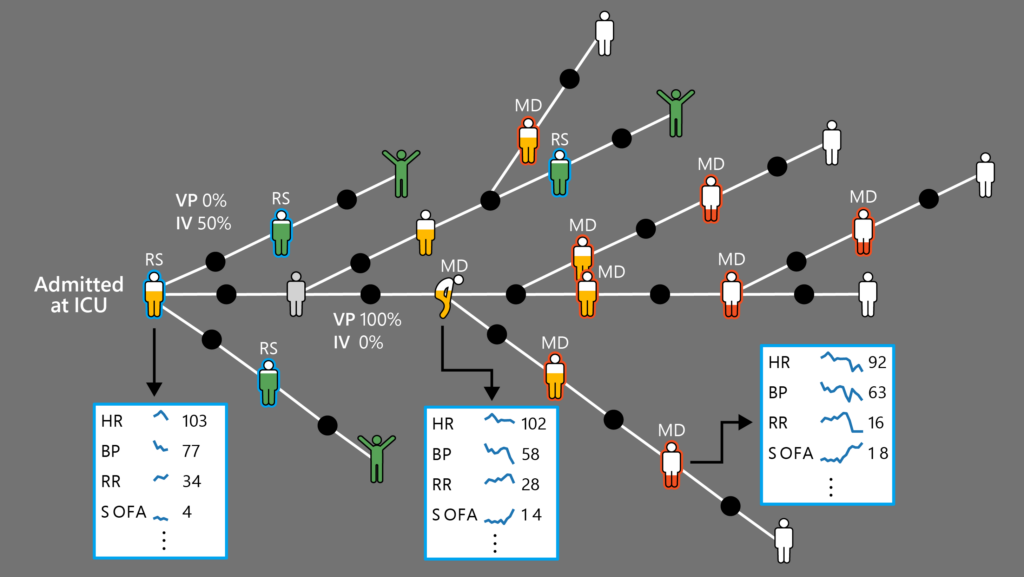
Patient vital signs taken at the ICU: HR=heart rate; BP=blood pressure; RR=respiration rate; SOFA=sequential organ failure assessment score
Treatment security: How to help doctors
To develop our model, we considered a generic condition that guarantees the merit and reliability of a given treatment-selection policy. In particular, we postulated the following condition we called treatment security:
If at state (s), treatment (a) causes transitioning to a medical dead-end with any given level of certainty, then the policy must refrain from selecting (a) at (s) with the same level of certainty.
For example, if a certain treatment leads to a medical dead-end or immediate death with a probability of more than 80 percent, that treatment should be selected for administration no more than 20 percent of the time.
While treatment security is a desired property, it’s not easy to directly enforce because the required probabilities are not known a priori, nor are they directly measurable from the data. Therefore, we developed a theoretical framework at the core of our method that enables treatment security from data by mapping it to proper learning problems.
DeD: Dead-end Discovery methodology
To precisely define the learning problems, we based our DeD methodology on three core ideas: 1) separating the outcomes, 2) learning the optimal value function of each outcome in isolation without discounting, and 3) proving important properties for these particular value functions, which enable treatment security.
We constructed two simple reward signals for independent learning problems:
- -1 in the case of a negative outcome; 0 at all other transitions
- +1 in the case of a positive outcome; 0 at all other transitions
Next, we learned their corresponding optimal value functions, (Q_{D}^{*}(s, a)) and (Q_{R}^{*}(s, a)) both with no discounting. It turns out that these value functions are intrinsically important. In fact, we show that:
–(Q_{D}^{*}(s, a)) corresponds to the minimum probability of a future negative outcome if treatment (a) is selected at state (s). Equivalently, (1 + Q_{D}^{*}(s, a)) corresponds to the maximum hope of a positive outcome.
Moreover, the quantity (1 + Q_{D}^{*}(s, a)) proves to be a meaningful threshold for a policy to make it secure. We formally show that: for treatment security, it is sufficient to abide by the maximum hope of recovery.
We further proved that if the probability of treatment selection can be higher than (Q_{R}^{*}(s, a)), the patient is guaranteed to remain in a rescue state when possible. Finally, we also showed that such thresholds for limiting the treatment selection probabilities exist.
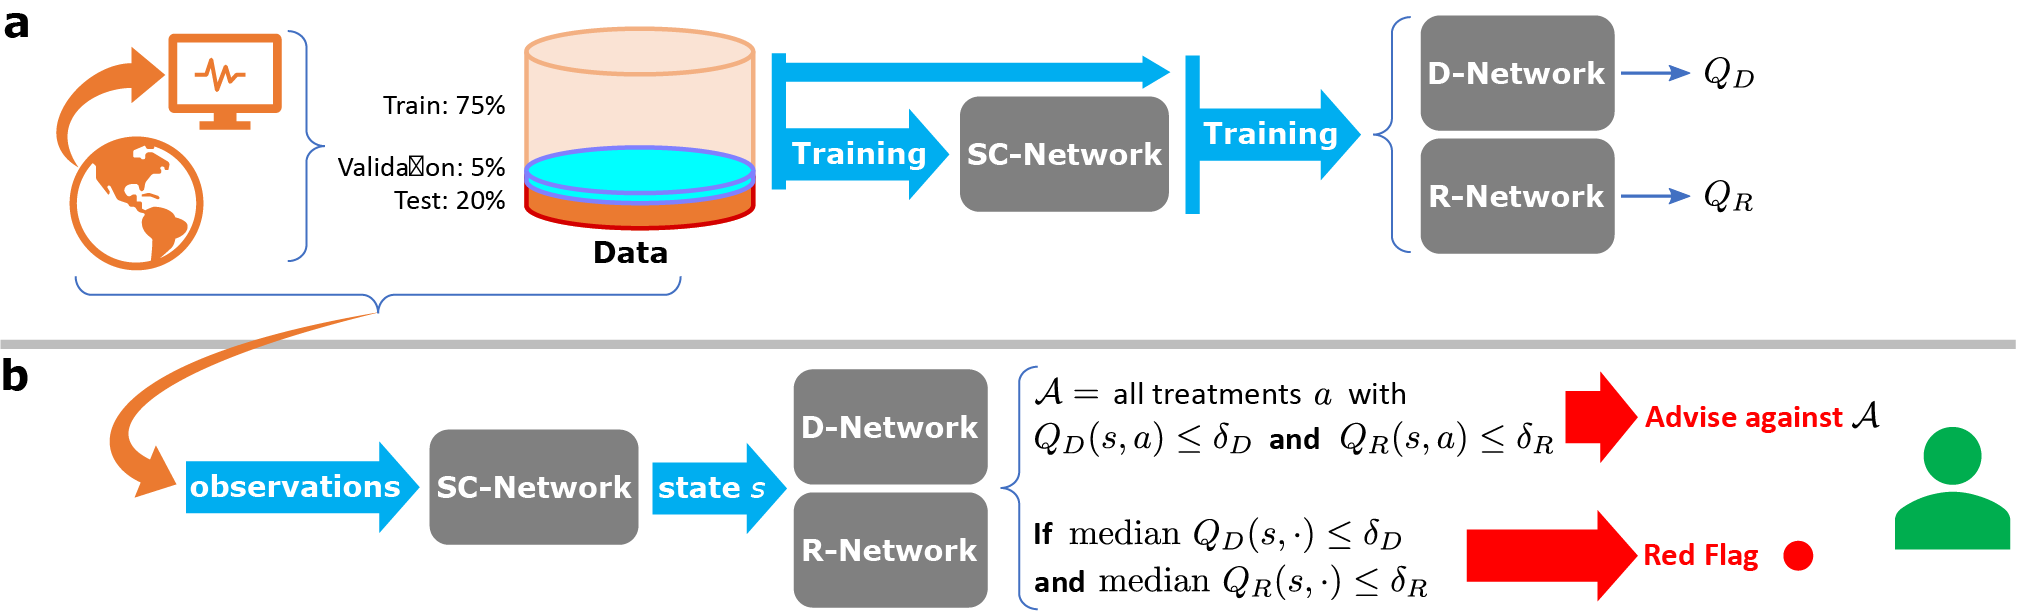
Building from these results, we defined a training and deployment pipeline, illustrated in Figure 3.
Applying the DeD methodology to sepsis
To demonstrate the utility of DeD in safety-critical domains and to honor the underlying healthcare motivations behind its development, we applied DeD on publicly available real-world medical data. Specifically, our data pertained to critically ill patients who had developed sepsis and were treated in an ICU.
Sepsis is a syndrome characterized by organ dysfunction due to a patient’s dysregulated response to an infection. In the United States alone, sepsis is responsible for more than 200,000 deaths each year, contributing to over 10 percent of in-hospital mortality, and accounting for over $23 billion in hospitalization costs. Globally, sepsis is a leading cause of mortality, with an estimated 11 million deaths each year, accounting for almost 20 percent of all deaths. It’s also an end-stage to many health conditions. In a recent retrospective study of hospitalized COVID-19 patients, all the fatal cases and more than 40 percent of survivors were septic.
In our study, we envisioned a way to help clinicians identify which subset of treatments could statistically cause further health deterioration so that they could eliminate them when deciding on the next steps. To estimate the value functions of possible treatments, we used the publicly available Medical Information Mart for Intensive Care III (MIMIC-III) dataset (v 1.4), sourced from the Beth Israel Deaconess Medical Center in Boston, Massachusetts. MIMIC-III is comprised of deidentified electronic health records (EHR) of consenting patients admitted to critical care units, collected from 53,423 distinct hospital admissions between 2001 and 2012. Following standard extraction and preprocessing methods, we derived an experimental cohort of 19,611 patients who are presumed to have developed sepsis during their initial admission to the ICU, with an observed mortality rate of approximately 10 percent. We studied 72 hours of the patients’ stay at the ICU—24 hours before the presumed onset of sepsis and 48 hours afterwards. We used 44 observation variables, including various health records and demographic information, and 25 distinct treatment options (five discrete levels for IV fluid and vasopressor volumes in combination), aggregated over four hours.
With this dataset, we sought to demonstrate that medical dead-ends exist in medical data and show the effect of treatment selection on the development of medical dead-ends. We also sought to identify whether alternative treatments were available that could have prevented the occurrence of a medical dead-end.
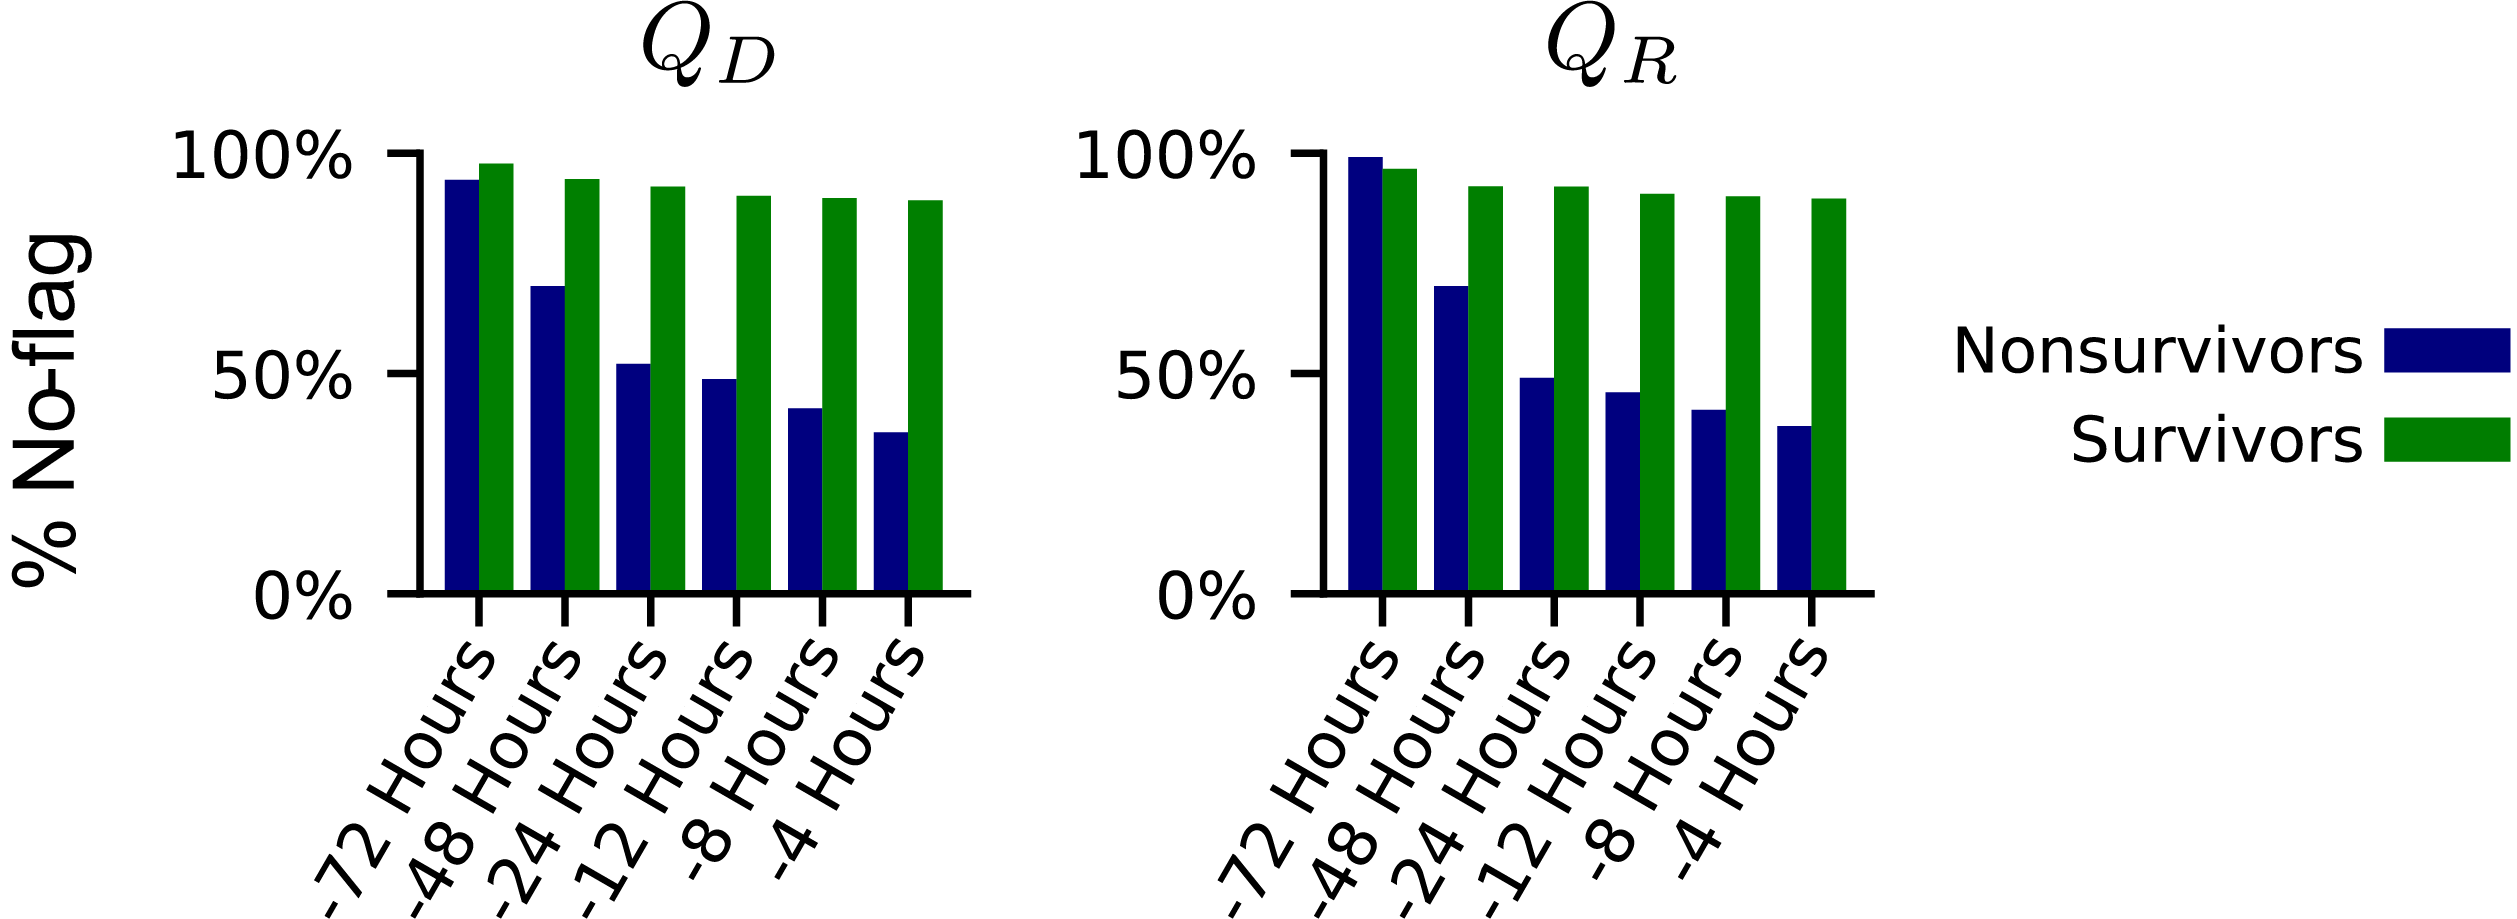
To flag potentially nonsecure treatments, we examined whether the values estimated ((Q_{D}(s, a)) and (Q_{R}(s, a))) for each treatment passed certain thresholds. To flag potential medical dead-end states, we looked at the median values of available treatments against these same thresholds. Using the median helped mitigate approximation errors due to generalization from potentially insufficient data and extrapolations made by the reinforcement learning formulation. With the specified thresholds, DeD identified increasing percentages of patients raising fatal flags, particularly among the subpopulation that died in the hospital. In Figure 4, note the distinctive difference between the trend of estimated values for surviving and non-surviving patients. Over the course of 72 hours in the ICU, surviving patients rarely raised a flag, while flags were raised at an increased rate for patients who did not survive as they proceeded toward the final observations of their time in the ICU.
To further support our hypothesis that medical dead-ends exist among septic patients and may be preventable, we aligned patients according to the point in their care when a flag was first raised by our DeD framework. As shown in Figure 5, we selected all trajectories with at least 24 hours prior to and 16 hours after this flag. The DeD estimates of (V) and (Q) values for administered treatments had similar behavior in both the surviving and non-surviving subpopulations prior to this first flag, but the values quickly diverged afterwards. We observed that the advent of this first flag also corresponded to a similar divergence among various clinical measures and vital signs, shown in Figure 5, sections a and b.
DeD identified a clear critical point in these patients’ care, where non-surviving patients experienced an irreversible negative change to their health, as shown in Figure 5, section c. Additionally, there was a significant gap in the estimated value between the treatments administered to the non-surviving patients and those treatments deemed to be more secure by DeD, shown in Figure 5, section e. There was a clear inflection in the estimated values four to eight hours before this first flag was raised, shown in Figure 5, section c.
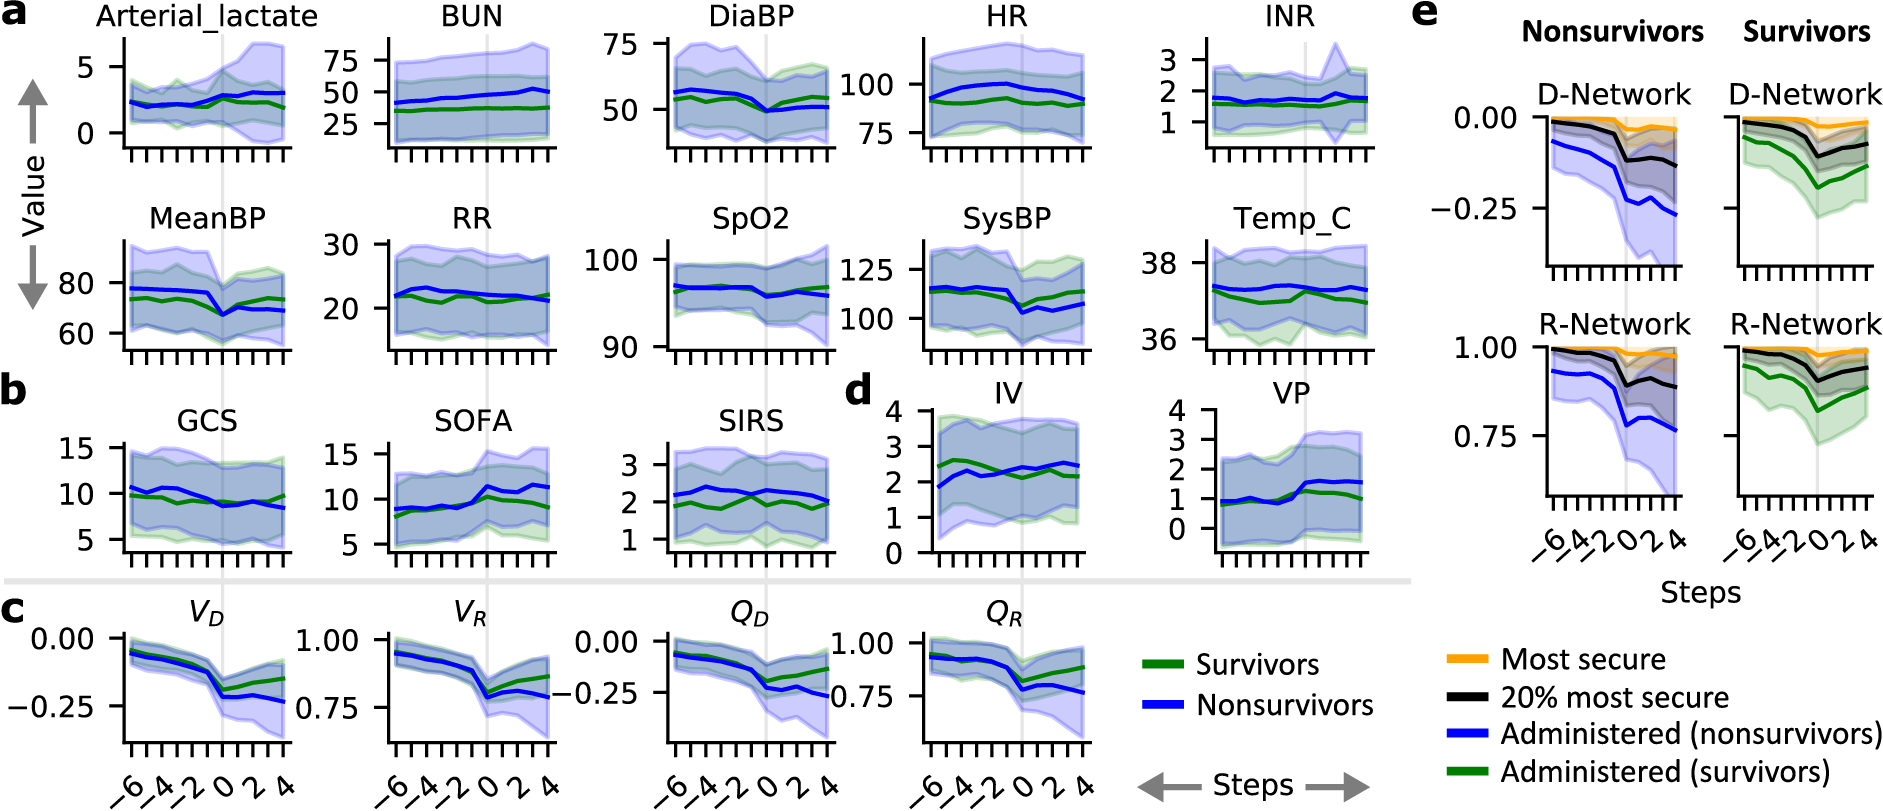
Further analysis of our results, which we describe in detail in our paper, indicates that more than 12 percent of treatments given to non-surviving patients could be detrimental 24 hours before death. We also identified that 2.7 percent of non-surviving patients entered medical dead-end trajectories with a sharply increasing rate up to 48 hours before death, and close to 10 percent when we slightly relaxed our thresholds for predicting medical dead-ends. While these percentages may seem small, more than 200,000 patients die of sepsis every year in US hospitals alone, and any reduction of this rate would result in possibly tens of thousands of individuals who would otherwise survive. We’re excited about the possibility that DeD could help clinicians provide their patients with the best care and that many more patients could potentially survive sepsis.
Looking ahead: Further uses of DeD and offline reinforcement learning
We view DeD as a powerful tool that could magnify human expertise in healthcare by supporting clinicians with predictive models as they make critical decisions. There is significant potential for researchers to use the DeD method to expand on this research and look at other measures, such as the relationship between patient demographics and sepsis treatment, with the goal of preventing certain treatment profiles for particular subgroups of patients.
The principles of offline reinforcement learning and the DeD methodology can also be applied to other clinical conditions, as well as to safety-critical areas beyond healthcare that also rely on sequential decision-making. For example, the domain of finance entails similar core concepts as it is analogously based on sequential decision-making processes. DeD could be used to alert financial professionals when specific actions, such as buying or selling certain assets, are likely to result in unavoidable future loss, or a financial dead-end. We hope our work will inspire active research and discussion in the community. You can learn more about the research and access the code here.
The post Using reinforcement learning to identify high-risk states and treatments in healthcare appeared first on Microsoft Research.