Figure 1: Modeled recommendation cycle. We demonstrate how enforcing group-fairness in every recommendation slate separately does not necessarily promote equity in second order variables of interest like network size.
Connection recommendation is at the heart of user experience in many online social networks. Given a prompt such as ‘People you may know’, connection recommender systems suggest a list of users, and the recipient of the recommendation decides which of the users to connect with. In some instances, connection recommendations can account for more than 50% of the social network graph [1]. Depending on the platform, being connected to the right people is tied to important advantages such as job opportunities or increased visibility. While this makes it imperative to treat users fairly, it is far from obvious how fairness can be enforced or what it even means to have a ‘fair’ system in this scenario. In fact, when enforcing fairness in dynamic systems like this, we are often interested in second-order variables while interventions target equity in single steps [2]. In connection recommendation, this generally means enforcing some sort of parity condition in each recommendation slate, e.g. equal exposure of female and male users for every query, while simultaneously hoping that this will promote more equitable network sizes in the long run. In our work, we demonstrate how this approach can fail and common statistical notions of recommendation fairness do not ensure equity of network sizes in the long run. In fact, we see that fairness interventions are not even sufficient to mitigate the amplification of existing biases. We reach these conclusions based on an extensive simulation study supplemented by theoretical limit analyses. In the following, we focus on a discussion of empirical results and refer to the full paper for theoretical derivations.
Recommendation procedure
The assumed recommendation cycle is depicted in Figure 1. We briefly summarize the involved steps and give more detail on the most important components in the following sections. On the left in the flowchart, a user queries a connection recommendation, for example, by loading the ‘People You may Know’ page on the platform’s website. The system then computes relevance scores between the user who is seeking recommendations – which we will refer to as the source user – and other previously unconnected users who will be referred to as the destination users. Based on these relevance scores, we derive a ranking of destination users subject to fairness constraints and display a list of possible connections to the source user. After new connections have been made, the cycle repeats.
Fairness constrained probabilistic ranking framework
For each recommendation query, the system obtains a set of relevance scores and derives a probabilistic ranking. This probabilistic ranking takes the form of a matrix (P_{s,d}^q) where the entry in the (d)th row and (r)th column denotes the probability of displaying member (d) in slot (r) of the recommendation list. The probabilities are selected to maximize the expected utility for the source user which is common practice in the recommendation literature [3].
More formally, we denote the source member as (s) and the destination member as (d). (q) denotes a query for an ordered list of (m) destination members and (u_{s,d}^q) the relevance score of (s) and (d) under query (q). We model a form of position bias by discounting the expected attention a recommended user receives based on how far down the list the recommendation, i.e. we define the exposure of slot (r) as (v(r)=1/log(r+1)). Given these quantities, the optimization problem for query (q) can be written as
$$argmax_{P}u_s^TP^q_sv$$
$$text{s.t.} sum_{i=1}^nP_s^q(d,i)leq 1 text{ for all } din[D_q],$$
$$sum_{i=1}^{D_q}P_s^q(i,r)=1text{ for all }rin[m],$$
$$0leq P_s^q(i,r)leq 1text{ for all }iin[D_q],jin[m].$$
The constraints in this problem ensure that each slot has a recommended user and each user can be recommended at most once in a given list. We explore two types of fairness constraints to add to this problem. First, we consider demographic parity of exposure which is a commonly suggested form of fairness in recommendations. It requires that groups receive expected exposure proportional to their population shares, i.e. for groups (G_0) and (G_1)
$$frac{1}{vert G_0vert}sum_{din G_0}sum_{r=1}^mP_s^q(d,r)v_r=frac{1}{vert G_1vert}sum_{din G_1}sum_{r=1}^mP_s^q(d,r)v_r.$$
Assume a setting in which there is no position bias (v), the population is split into 60% majority group and 40% minority group, and each recommendation list has 10 slots. In this setting, demographic parity of exposure requires (in expectation) that 6 of the recommended members belong to the majority group while 4 belong to the minority group in every recommendation list.
Second, we explore a dynamic parity of utility constraint. As opposed to the first constraint, this fairness measure does not only consider the exposure of groups but also the total utility that can be expected from the exposure, i.e. for two groups (G_0) and (G_1),
$$frac{1}{vert G_0vert}sum_{din G_0}u_{s,d}^qsum_{r=1}^mP_s^q(d,r)v_r=frac{1}{vert G_1vert}sum_{din G_1}u_{s,d}^qsum_{r=1}^mP_s^q(d,r)v_r.$$
On a high level, the constraint requires that the sum of relevance scores across groups is proportional to the population share of groups discounted by the exposure limitations posed by position bias. To understand what this means, let us consider the example setting from before with no position bias, a 60%/40% group split, and recommendation lists with 10 slots. Assume that all destination members of the majority group have a relevance score of 0.12 while all destination members of the minority group have a fixed relevance of 0.08. The probabilistic ranking fulfills dynamic parity of utility if the expected group-split in the recommendation list is 50%/50% because (0.5 * 10 * 0.12 = 0.6) and (0.5 * 10 * 0.08 = 0.4).
How do we model relevance scores?
Relevance scores usually model the probability of connection if recommended, a measure of downstream engagement or some mixture of the two. The exact models employed by social media platforms are usually proprietary, but we opt for a synthetic model in the form of logistic regression in three realistic features [4,5]. Assuming our prediction target is the probability of connection, we first use the source member’s network size. This is based on the assumption that users with larger networks are more likely to be proactive in connection forming as they are generally more active on the platform. Next, we assume that users with more common connections are more likely to connect. The common connections feature is rooted in social network literature where it is commonly referred to as triadic closure [e.g. 6,7]. Lastly, we make the assumption that users with similarities such as demographics, interests, education, workplace, etc. are more likely to connect. This follows the observation that individuals like to be connected to similar individuals commonly referred to as homophily in sociology and other social sciences [e.g. 8].
The main simulation procedure makes use of the relevance scoring model for user pairs as follows. We assume a fixed-size graph of evolving connections with two groups of members. 65% of members belong to an initially more connected majority group. First, we assume a ground truth model for matching scores by imposing ground-truth parameter values in the presented logistic regression function. We use this function to simulate a data set of recommendations and formed connections and use the synthetic data to train a logistic regression matching scores model.
Simulation procedure
We sample covariate vectors from group-dependent distributions for each member in the graph. These vectors will be used to compute the similarity between members which we set as negative Euclidean distance. The connections in the graph are initialized with a stochastic block model in which user pairs in the majority group are slightly more likely to connect than user pairs in the minority group and user pairs who belong to the same group are slightly more likely to connect than user pairs who belong to opposite groups. This models the initial advantage for majority group members we would expect to see in practice and accounts for homophily preferences. Given the initial specifications, we go through the previously described recommendation cycle for 2,500 timesteps and keep track of key fairness and performance metrics. Following our reasoning from the scoring model, the frequency with which users seek out recommendations is based on exponential waiting times with a mean depending on the current network size of a user. The whole simulation procedure is repeated with each fairness intervention separately and without intervention for comparison. Results are averaged over 10 runs.
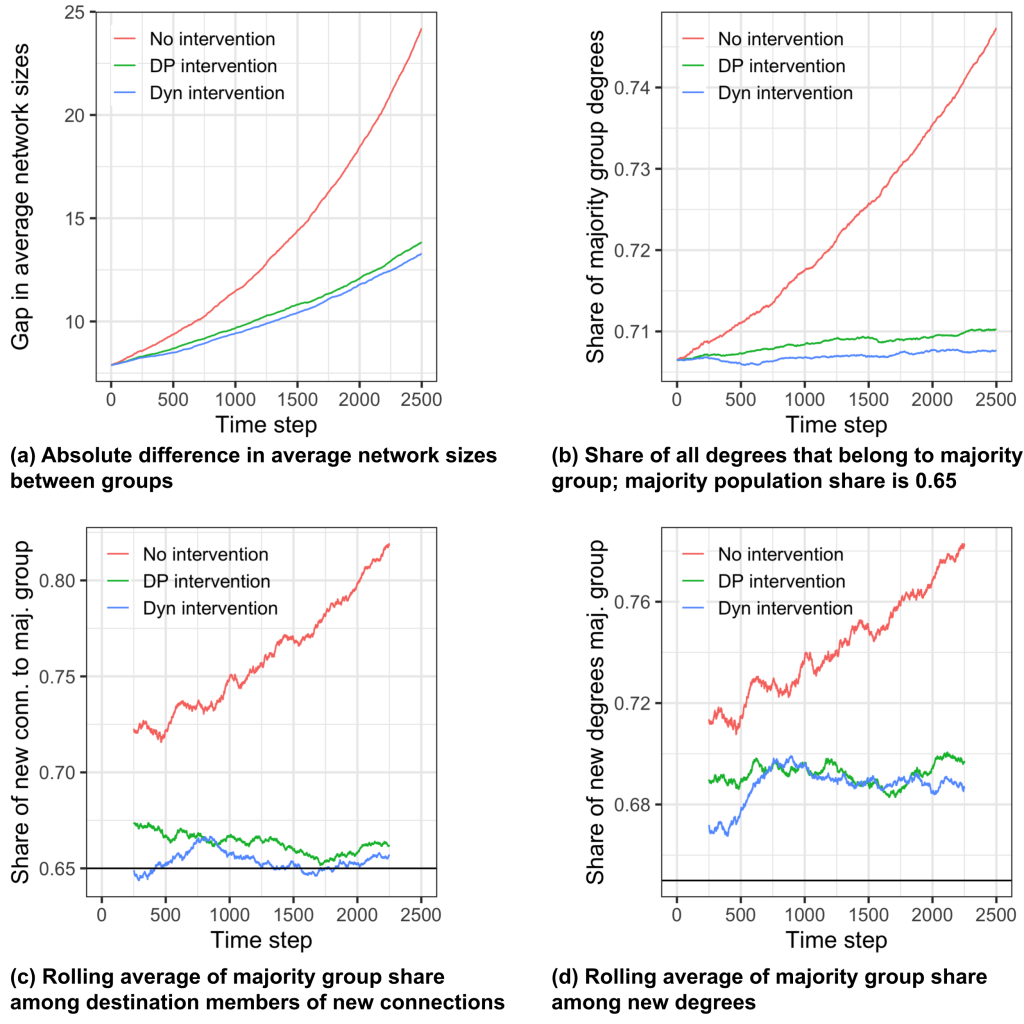
Rich-gets-richer in groups
Figure 2 depicts the performance of all 3 intervention types. With no intervention – which is displayed in red in the graphs – we observe that the gap in average network sizes between groups drastically increases over time. In fact, our results reveal a group-wise rich-get-richer effect in which network sizes tend to a power law distribution with a lower mode in the minority population. Members whose networks are in the tail of the distribution tend to be the members who had large networks, as compared to their peers, to begin with. These observations are in line with previous findings on rich-get-richer phenomena under homophily.
Demographic parity of exposure intervention
We now move to the results for the demographic parity of exposure intervention. First, we can see that the majority group share of exposure in recommendations is down to 66.3% which suggests that the intervention is working. However, as we can see in panels (a) and (b), the gap in average network sizes is still increasing over time. Why is this the case? First, majority group members seek out recommendations more frequently based on their already larger network sizes and activity levels. This leads to more connections formed with majority group members at the source side of the recommendation while our intervention can only target the destination side. Second, majority group members have higher ranking scores and are thus more likely to be invited for connection even if both groups are exposed equally. Consider the following example recommendation:
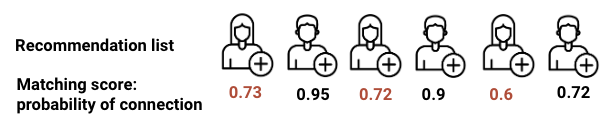
Here, both female and male users have the same exposure – we will ignore position bias for this example. However, the probability of connection and its proxy – the matching score – are much lower for women than for men essentially leading to fewer new connections for women than for men. While the intervention suggests recommendations are made fairly, this does not align with our intuitive goal of more equitable network sizes.
Dynamic parity of utility intervention
Some of the problems with the demographic parity of exposure intervention are addressed by the dynamic parity of utility intervention. We see that the majority group share of destination members of new connections is down to 65.4% as desired. Yet, even with this type of constraint, panels (a) and (b) show that the gap in average network sizes is still increasing over time. Like in the previous case, one of the reasons for this is that majority group members seek out recommendations more frequently. In addition, our analysis reveals that source members from the majority group generally form more connections per recommendation query leading to the increased share in panel (d). To understand why this is the case, consider the following example:
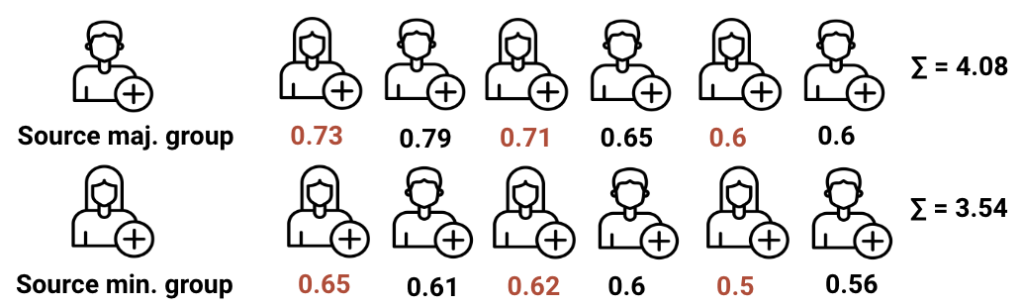
In the first row, a majority group member – here displayed as male – receives recommendations. In the second row, a minority group member – here female – receives recommendations. In both recommendation lists the dynamic parity of utility constraint is fulfilled, but the male source member receives more overall utility from the query because the constraint can only target fairness within a list and not in between different sets of recommendations.
Summary of findings
Let us summarize the key findings. Our study shows that unconstrained connection recommendation leads to a group-wise rich-get-richer effect. Enforcing demographic parity of exposure or dynamic parity of utility between groups, which are commonly suggested remedies against demographic bias in recommender systems, leads to less bias amplification but is not sufficient in order to mitigate an increase in the disparities in network sizes over time. As shown in the full paper, theoretical limit analysis shows that dynamic parity of utility would be the optimal intervention if there was no source-side bias. Yet, this is an unrealistic assumption in practice.
Overall, the common practice of measuring fairness in recommender systems in a one-shot or time-aggregate static manner can lead to an illusion of fairness and deployment of fairness-enhancing algorithms with unforeseen consequences. Connection recommendation operates on a dynamical system that needs to be taken into account to ensure equitable outcomes in the long run.
The full paper is published in the proceedings of the AAAI / ACM conference on Artificial Intelligence, Ethics, and Society (AIES 2022). A preprint is available here.