Outline
In this blog post we show how to optimize LibTorch-based inference engine to maximize throughput by reducing memory usage and optimizing the thread-pooling strategy. We apply these optimizations to Pattern Recognition engines for audio data, for example, music and speech recognition or acoustic fingerprinting. The optimizations discussed in this blog post allow for memory usage reduction by 50% and reduction in end-to-end latency for Inference by 37.5%. These optimizations are applicable to computer vision and natural language processing.
Audio Recognition Inferencing
Audio Recognition (AR) engines can be used to recognize and identify sound patterns. As an example, identifying the type and species of a bird from audio recordings, distinguishing music from the singer’s voice, or detecting an abnormal sound indicating a breach in a building. To identify sounds of interest, AR engines process audio through 4 stages:
- File Validation: The AR engine validates the input audio file.
- Feature Extraction: Features are extracted from each segment within the audio file.
- Inference: LibTorch performs inference using CPUs or accelerators. In our case Intel processors on an Elastic Cloud Compute (EC2) instance.
- Post-processing: A post-processing model decodes the results and calculates scores that are used to convert inference output into tags or transcripts.
Of these 4 steps, inference is the most computationally intensive and can take up to 50% of the pipeline processing time depending on the model complexity. This means that any optimization at this stage has a significant impact on the overall pipeline.
Optimizing the Audio Recognition engine with concurrency…is not so simple
Our objective for this processing pipeline is to extract audio segments into tags or transcripts through a processing. The input data is an audio file composed of several short sound segments (S1 to S6 in Figure 1). The output data corresponds to tags or transcripts ordered by timestamps.
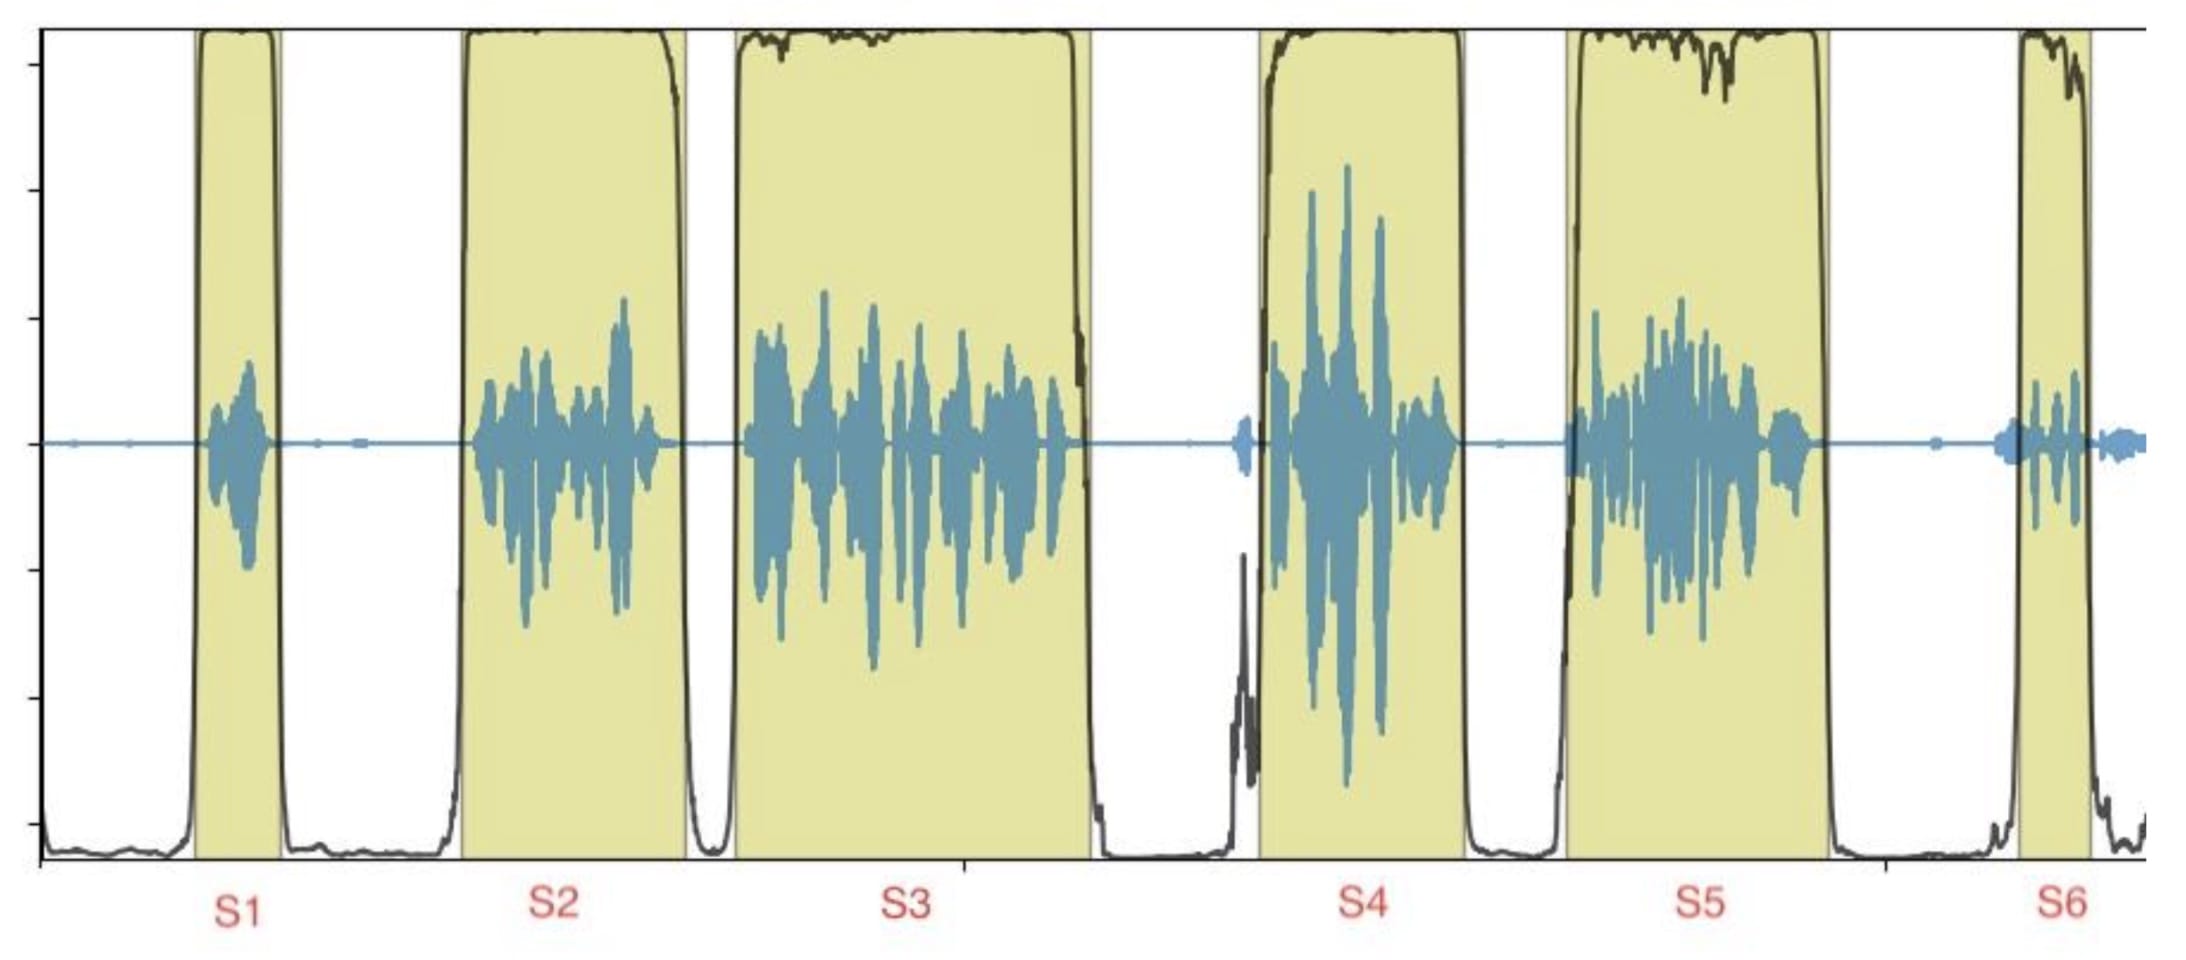
Figure 1: Example audio file with segment boundaries
Each segment can be processed independently and in an out-of-order fashion. This offers the opportunity to process segments concurrently and in parallel to optimize the overall inference throughput as well as maximize the usage of the resources.
Parallelization on an instance can be achieved through multi-threading (pThreads, std::threads, OpenMP) or multi-processing. The advantage of multi-threading over multi-processing is the ability to use shared memory. It enables developers to minimize data duplication across threads by sharing data across threads; the AR models in our case (Figure 2). Furthermore, a reduction in memory allows us to run more pipelines in parallel by increasing the number of engine threads in order to utilize all vCPUs on our Amazon EC2 instance (c5.4xlarge in our case, it offers 16 vCPUs). In theory, we expect to see higher hardware utilization and higher throughput for our AR engine as a result.
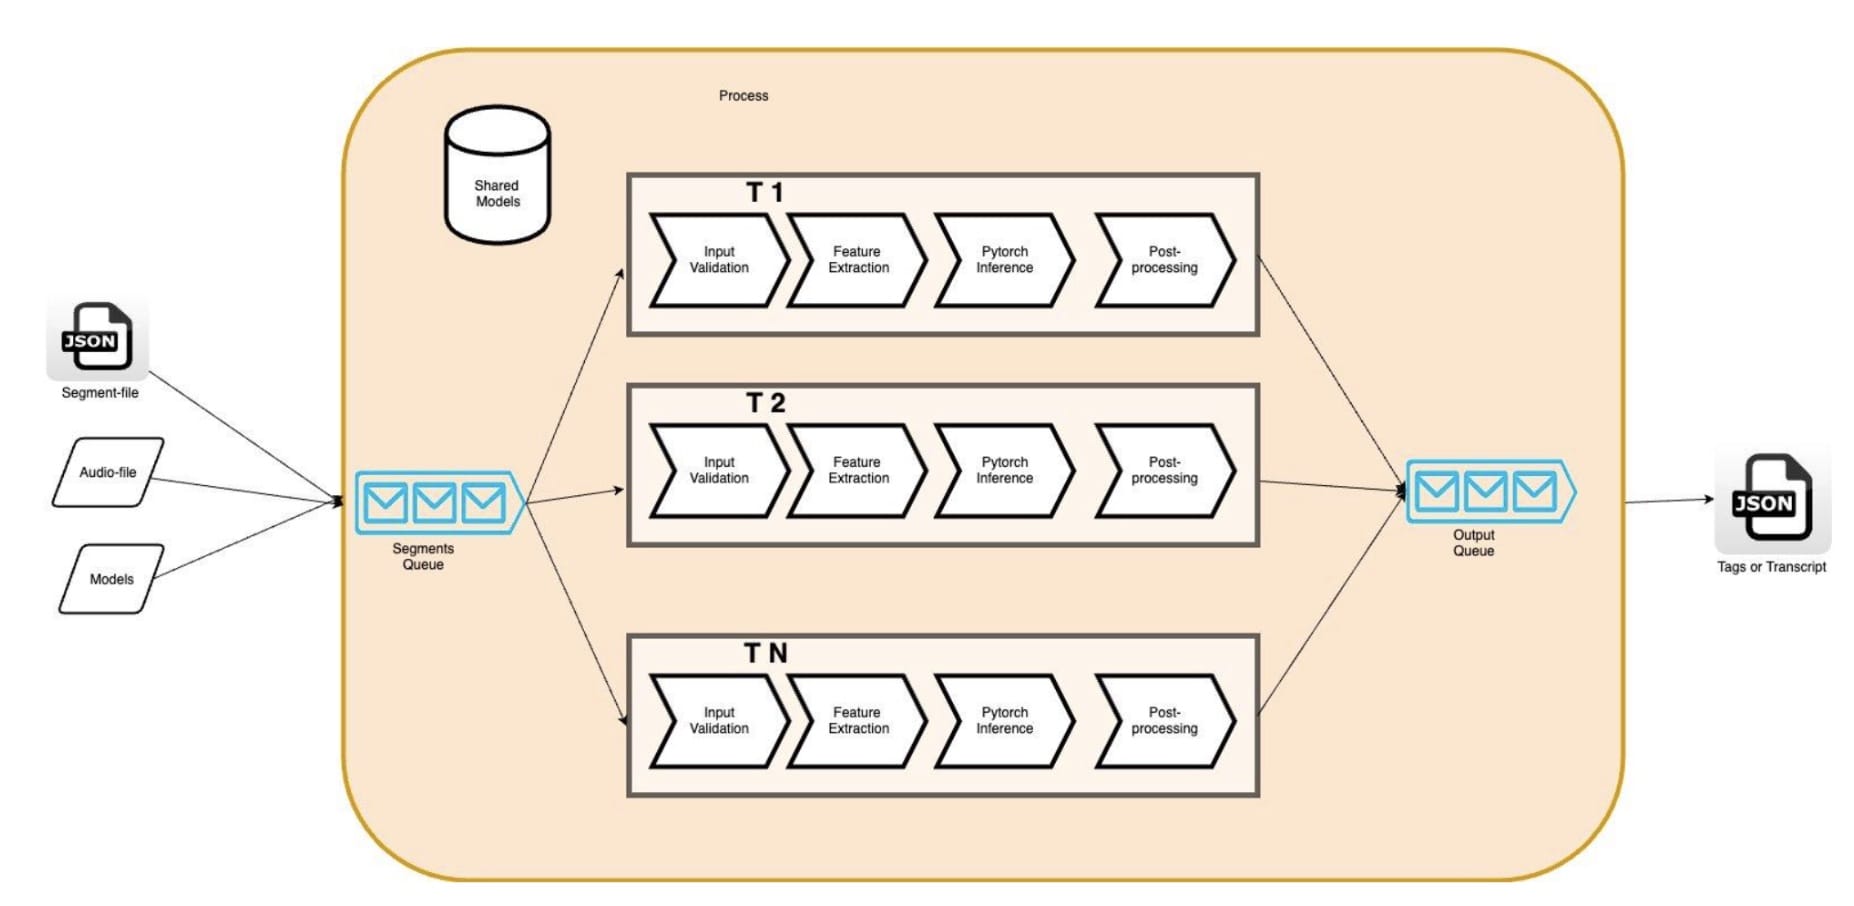
Figure 2: Multi-threaded AR Engine
But we found these assumptions to be wrong. Indeed, we found that increasing the number of threads of the application led to an increase of the end-to-end latency for each audio segment and to a decrease of the engine throughput. For example, increasing the concurrency from 1 to 5 threads led to an increase of the latency by 4x which had a proportional effect on decreasing the throughput. In fact, metrics showed that within the pipeline, the latency of the inference stage alone was 3x higher than it’s single thread baseline.
Using a profiler, we found that the CPU Spin Time increased, potentially due to CPU oversubscription which impacts system and application performance. Given our control over the application’s multi-thread implementation, we chose to dive deeper into the stack and identify potential conflicts with LibTorch’s default settings.
Diving deeper on LibTorch’s multi-threading and its impact on concurrency
LibTorch’s parallel implementations on CPU for inference are based on global thread pools. Examples of implementations are Inter-op and intra-op parallelism, which can be chosen depending on the model’s properties. In both cases, it is possible to set the number of threads in each thread-poll to optimize the latency and throughput.
To test if LibTorch’s parallel default implementation settings had a counter effect on our inference latency, we ran an experiment on a 16 vCPus machine with a 35-minute audio file, keeping the LibTorch inter-threads constant at 1 (because our models didn’t utilize the inter-op thread pool). We collected the following data as shown in Figure 3 and 4.
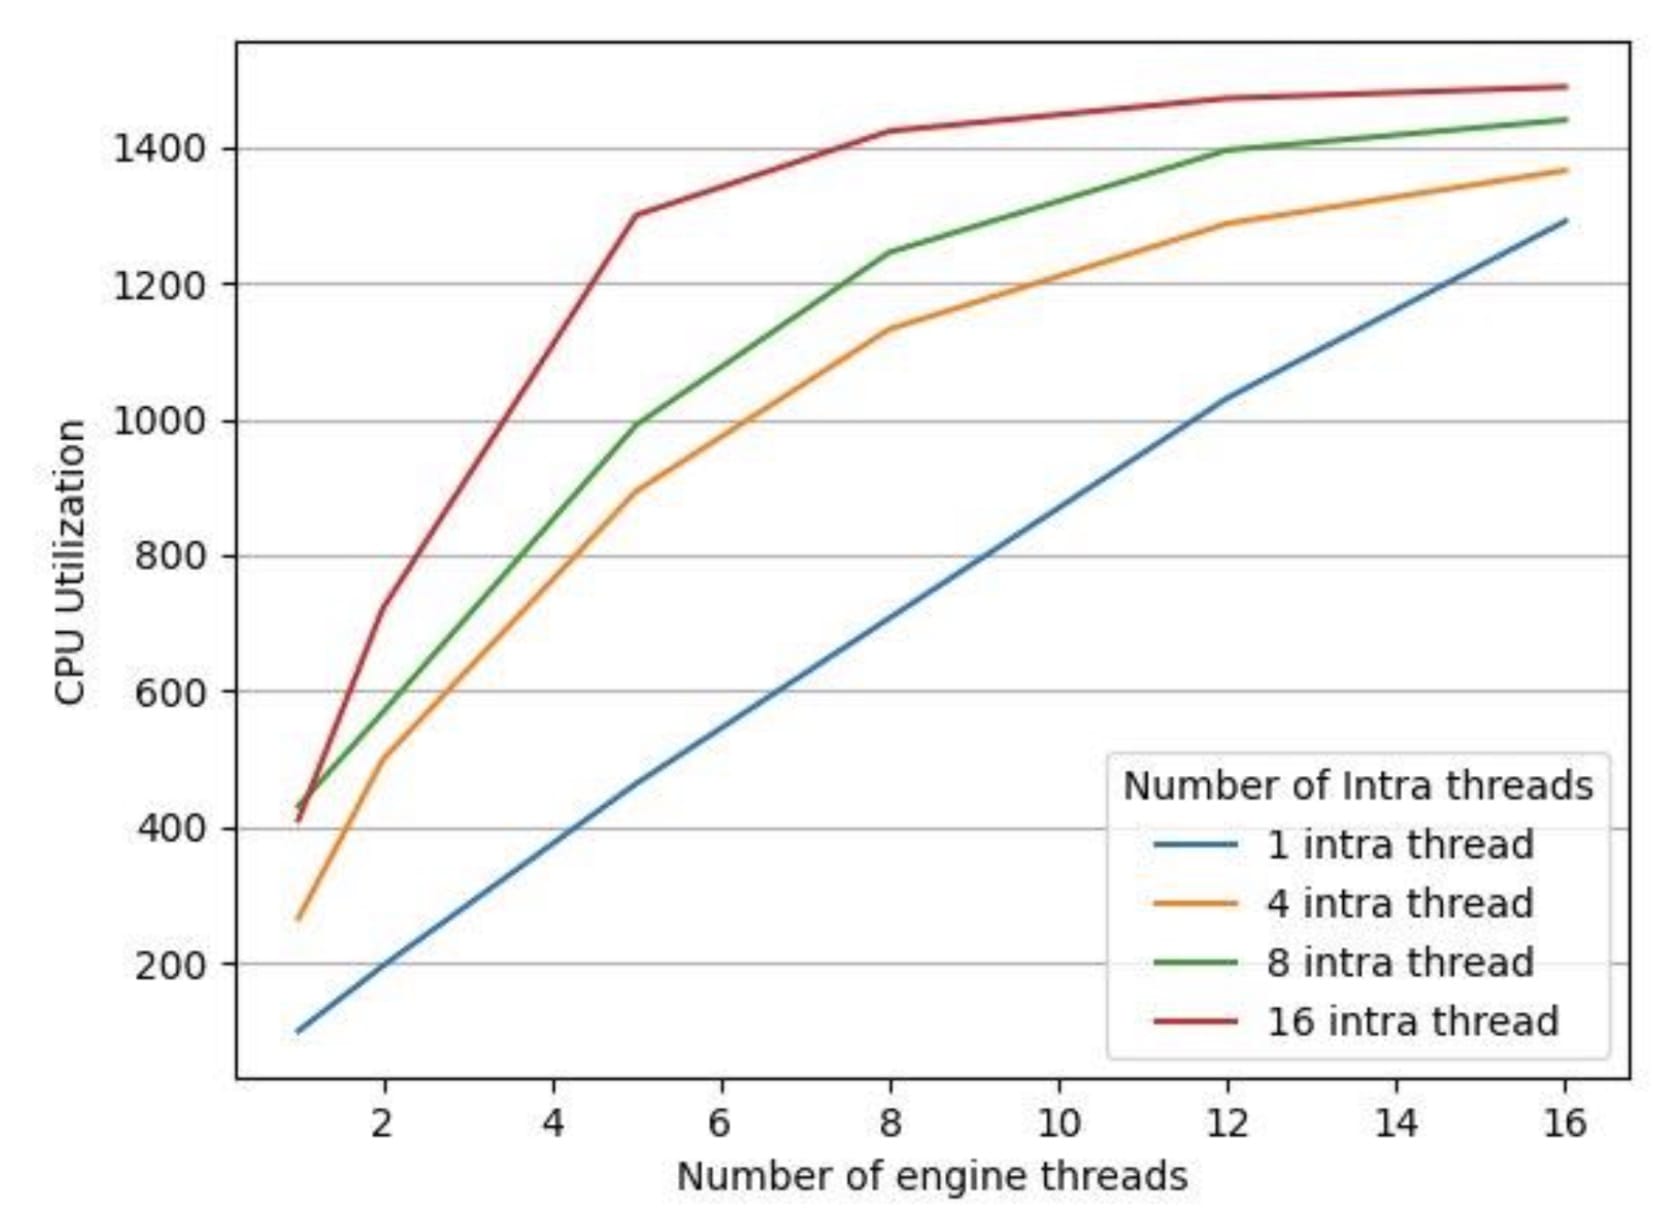
Figure 3: CPU Utilization for different number of engine threads

Figure 4: Processing times for different number of engine threads
Execution time in Figure 4 is the end-to-end processing time for processing all the segments of the given audio file. We have 4 different configurations of LibTorch intra-threads which are 1, 4, 8, 16 and we change the number of engine threads from 1 to 16 for each intra-thread LibTorch configuration. As we see in Figure 3, CPU utilization increases with an increase in the number of engine threads for all LibTorch intra-thread configurations. But as we see in Figure 4, an increase in CPU utilization doesn’t translate into lower execution time. We found out that in all but one case, as the number of engine threads shot up, so did execution time. The one exception was the case where the intra-thread pool size was 1.
Resolving the global thread pool issue
Using too many threads with a global thread pool led to performance degradation and caused an over-subscription problem. Without disabling LibTorch global thread pools, it was difficult to match the performance of the multi-process engine.
Disabling the LibTorch global thread pool is as simple as setting the intra-op/inter-op parallelism threads to 1, as shown here:
at::set_num_threads(1)           // Disables the intraop thread pool.
at::set_num_interop_threads(1). // Disables the interop thread pool.
As shown in Figure 4, the lowest processing time was measured when the LibTorch global thread pool was disabled.
This solution improved AR engine throughput in several cases. However, when evaluating long datasets (audio files longer than 2 hours in load test), we found that the memory footprint of the engine gradually started to increase.
Optimizing memory usage
We ran a load-test on the system with two hours long audio files and found out that the observed memory increase was the result of memory fragmentation within a multi-threaded LibTorch inference. We resolved this using jemalloc, which is a general purpose malloc(3) implementation that emphasizes fragmentation avoidance and scalable concurrency support. Using jemalloc, our peak memory usage decreased by an average of 34% and average memory usage decreased by 53%.
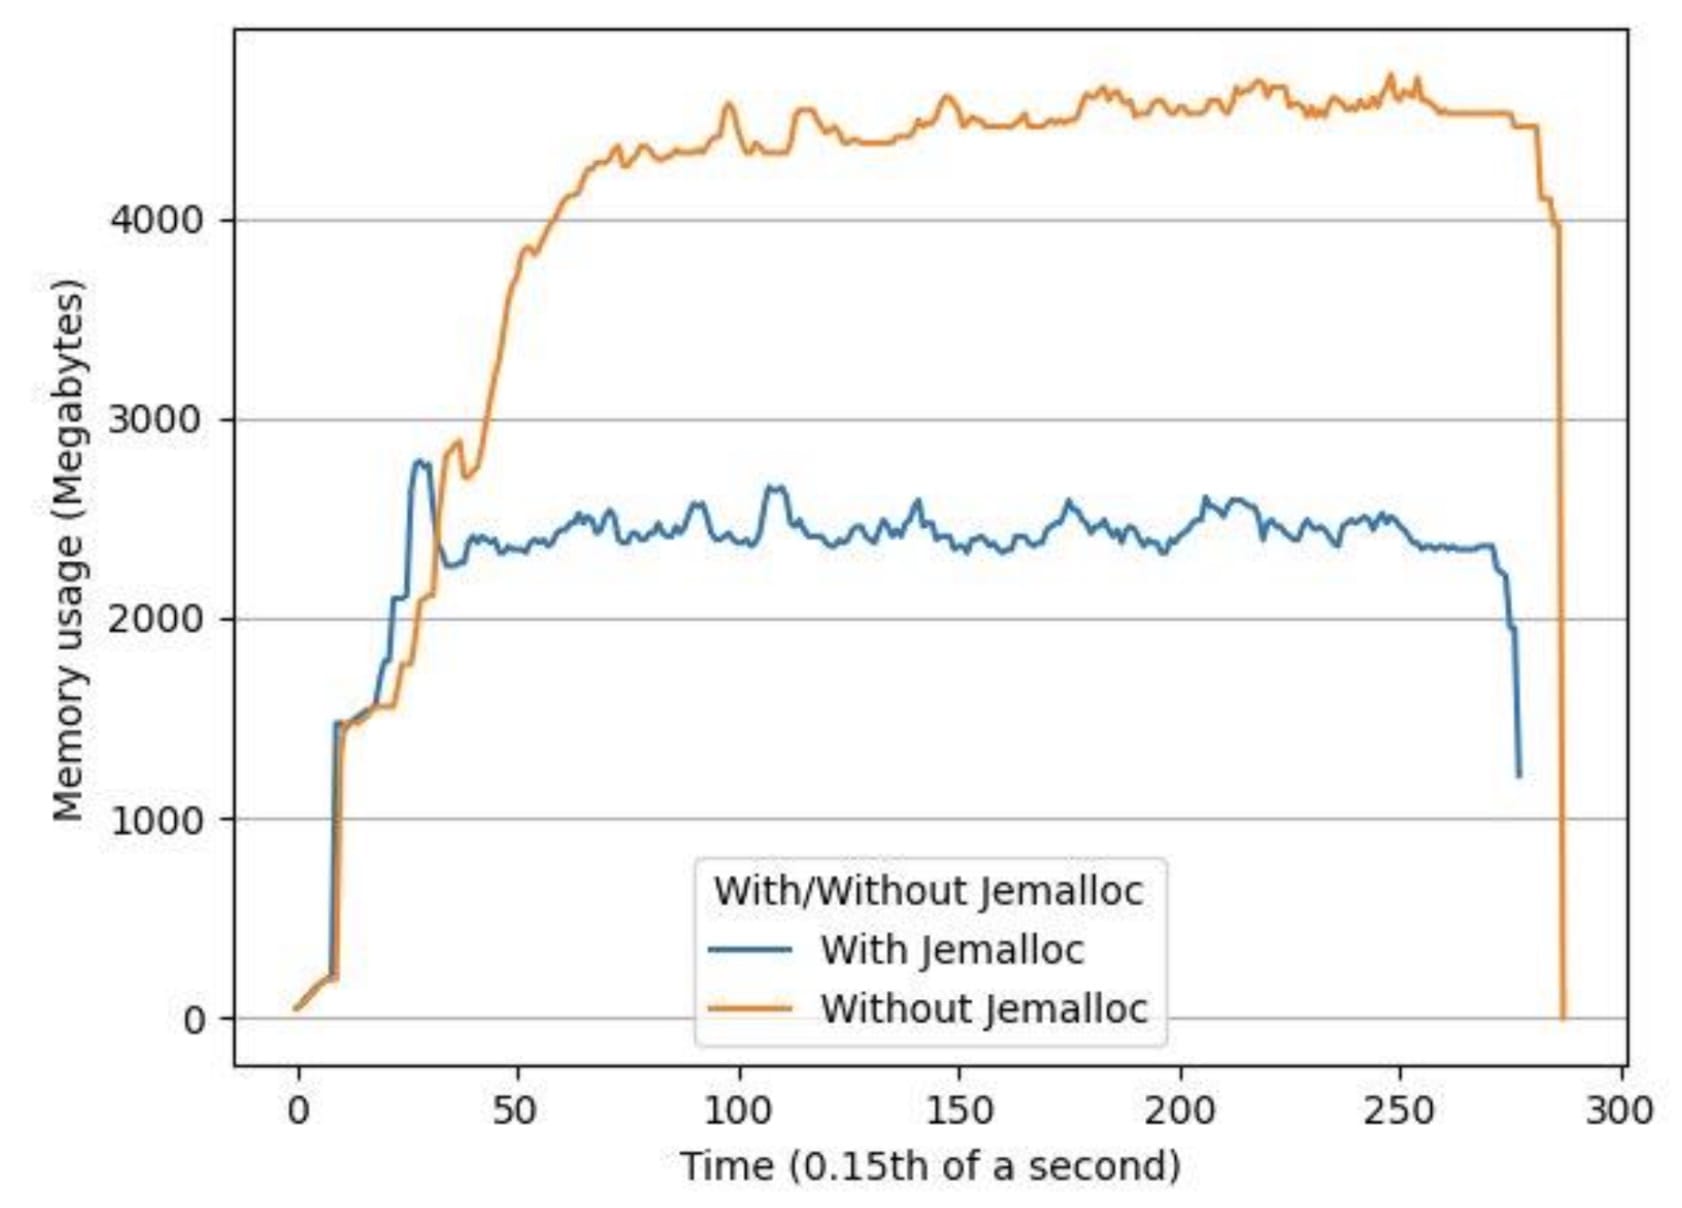
Figure 5: Memory usage over time using the same input file with and without jemalloc
Summary
To optimize the performance of multi-threaded LibTorch-based inference engines, we recommend verifying that there is no oversubscription problem in LibTorch. In our case, all threads in the multi-threaded engine were sharing the LibTorch global thread pool, which caused an oversubscription problem. This was remedied by disabling the global thread pool: we disabled the interop and intraop global thread pool by setting threads to 1. To optimize the memory of a multi-threaded engine, we recommend using Jemalloc as a memory allocator tool rather than the default malloc function.