Introduction
TL;DR: It can be challenging to run PyTorch on mobile devices, SBCs (Single Board Computers), and IOT devices. When compiled, the PyTorch library is huge and includes dependencies that might not be needed for the on-device use case.
To run a specific set of models on-device, we actually require only a small subset of the features in the PyTorch library. We found that using a PyTorch runtime generated using selective build can achieve up to 90% reduction in binary size (for the CPU and QuantizedCPU backends on an x86-64 build on Linux). In this blog, we share our experience of generating model-specific minimal runtimes using Selective Build and show you how to do the same.
Why is this important for app developers?
Using a PyTorch runtime generated by selective build can reduce the size of AI-powered apps by 30+ MB – a significant reduction for a typical mobile app! Making mobile applications more lightweight has many benefits – they are runnable on a wider variety of devices, consume less cellular data, and can be downloaded and updated faster on user’s devices.
What does the Developer Experience look like?
This method can work seamlessly with any existing PyTorch Mobile deployment workflows. All you need to do is replace the general PyTorch runtime library with a runtime customized for the specific models you wish to use in your application. The general steps in this process are:
- Build the PyTorch Runtime in instrumentation mode (this is called an instrumentation build of PyTorch). This will record the used operators, kernels and features.
- Run your models through this instrumentation build by using the provided model_tracer binary. This will generate a single YAML file that stores all the features used by your model. These features will be preserved in the minimal runtime.
- Build PyTorch using this YAML file as input. This is the selective build technique, and it greatly reduces the size of the final PyTorch binary.
- Use this selectively-built PyTorch library to reduce the size of your mobile application!
Building the PyTorch Runtime in a special “instrumentation” mode ( by passing the TRACING_BASED=1 build option) generates an instrumentation build runtime of PyTorch, along with a model_tracer binary. Running a model with this build allows us to trace the parts of PyTorch used by the model.
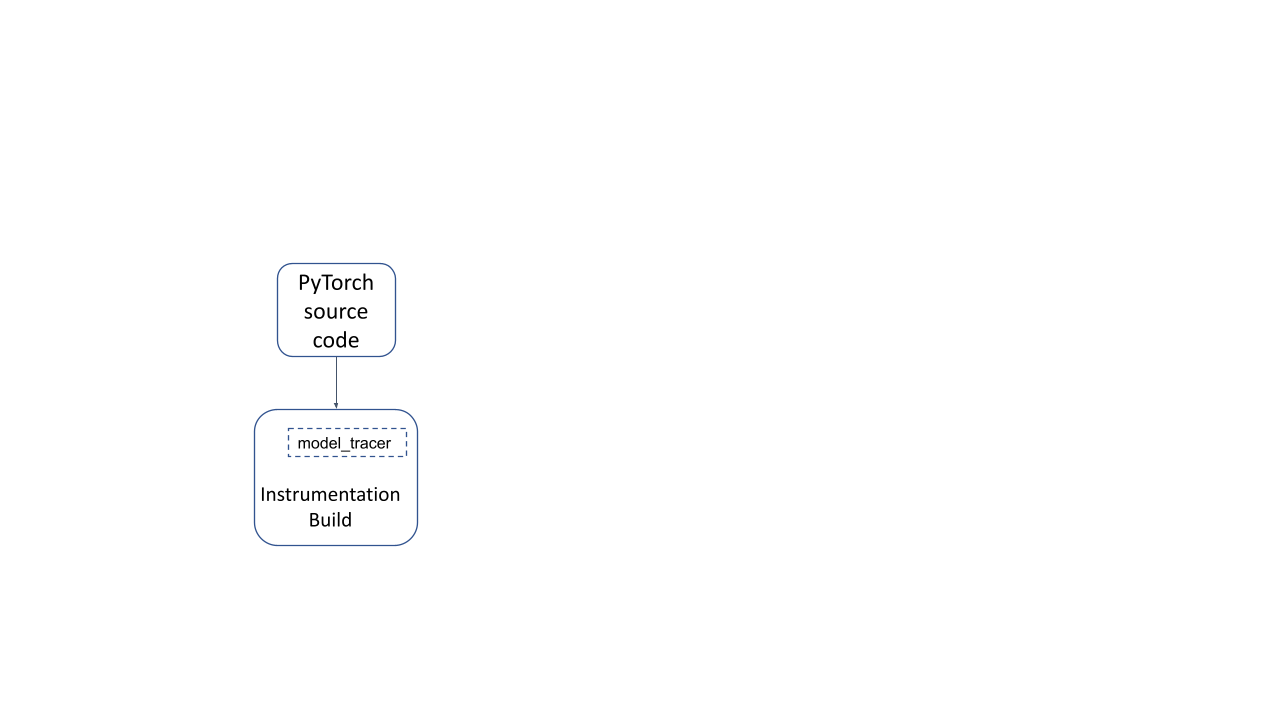
Figure 1: Instrumentation build of PyTorch
# Clone the PyTorch repo
git clone https://github.com/pytorch/pytorch.git
cd pytorch

# Build the model_tracer
USE_NUMPY=0 USE_DISTRIBUTED=0 USE_CUDA=0 TRACING_BASED=1
  python setup.py develop
Now this instrumentation build is used to run a model inference with representative inputs. The model_tracer binary observes parts of the instrumentation build that were activated during the inference run, and dumps it to a YAML file.
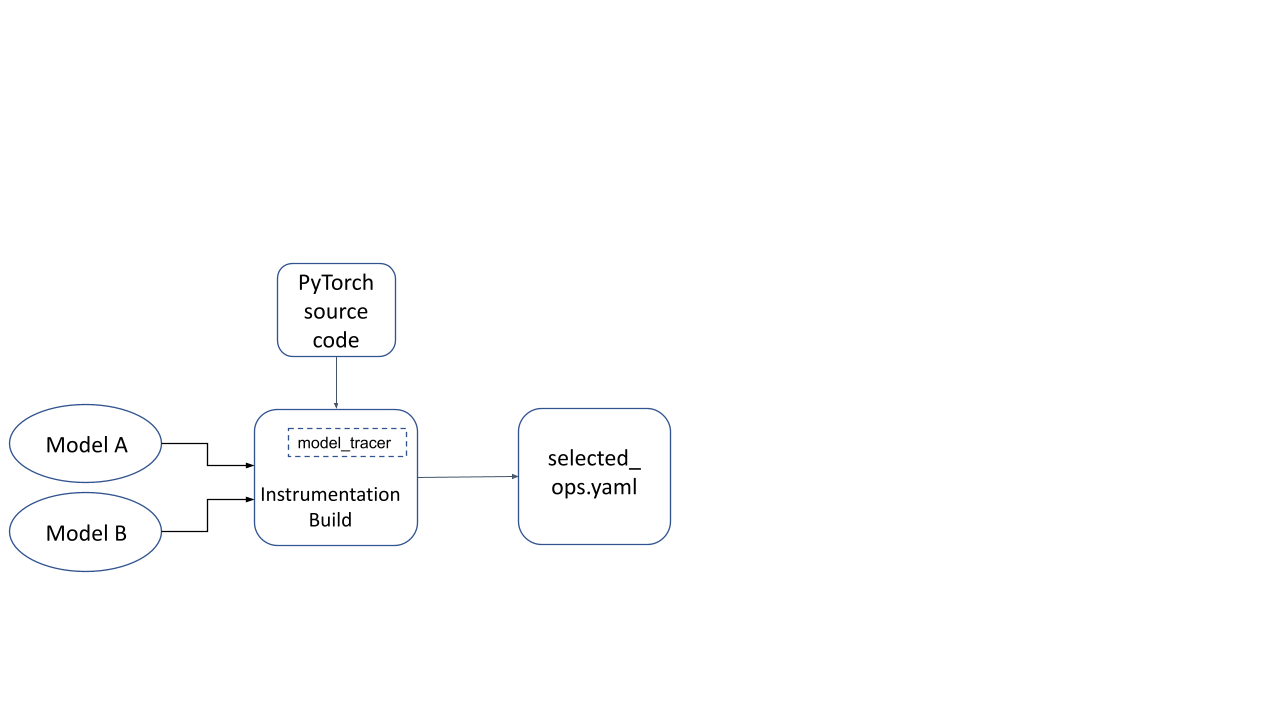
Figure 2: YAML file generated by running model(s) on an instrumentation build
# Generate YAML file
./build/bin/model_tracer
  --model_input_path /tmp/path_to_model.ptl
  --build_yaml_path /tmp/selected_ops.yaml
Now we build the PyTorch Runtime again, but this time using the YAML file generated by the tracer. The runtime now only includes those parts that are needed for this model. This is called “Selectively built PyTorch runtime” in the diagram below.
# Clean out cached configuration
make clean

# Build PyTorch using Selected Operators (from the YAML file)
# using the host toolchain, and use this generated library
BUILD_PYTORCH_MOBILE_WITH_HOST_TOOLCHAIN=1
USE_LIGHTWEIGHT_DISPATCH=0
BUILD_LITE_INTERPRETER=1
SELECTED_OP_LIST=/tmp/selected_ops.yaml
TRACING_BASED=1
  ./scripts/build_mobile.sh
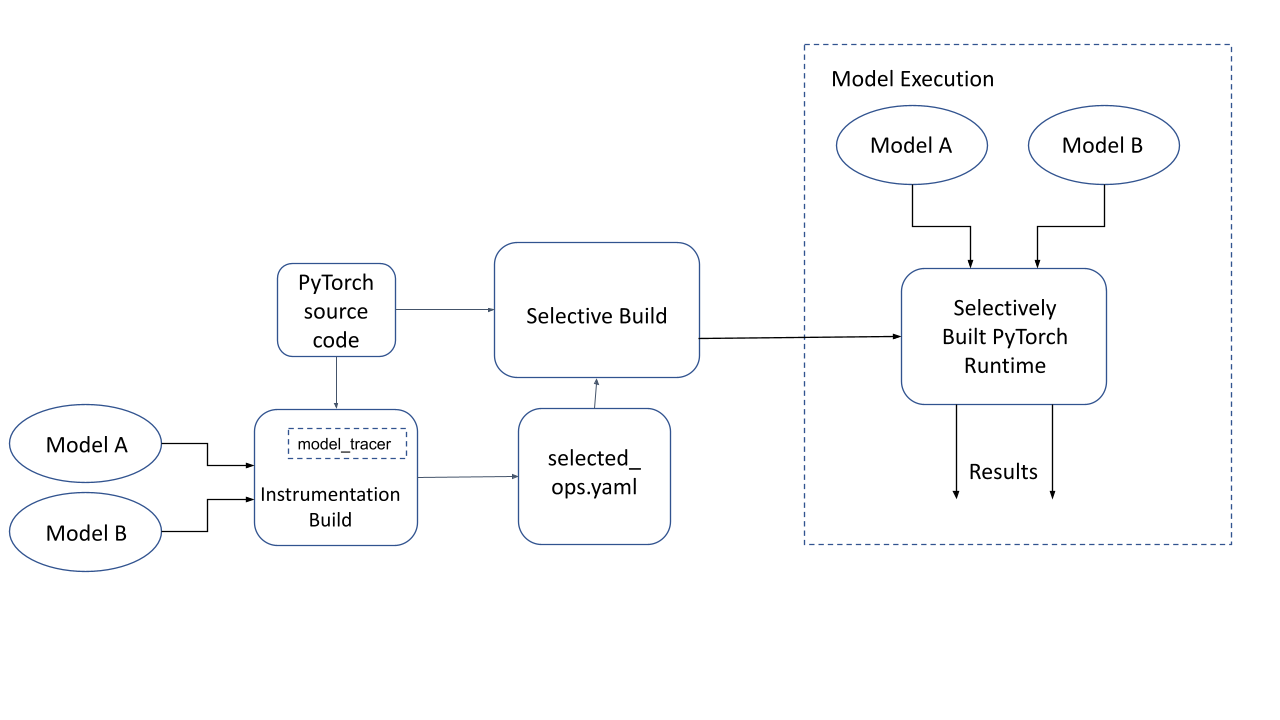
Figure 3: Selective Build of PyTorch and model execution on a selectively built PyTorch runtime
Show me the code!
We’ve put together a notebook to illustrate what the process above looks like in code using a simple PyTorch model.
For a more hands-on tutorial to deploy this on Android/iOS this tutorial should be helpful.
Technical FAQs
Why is Tracing needed for a Selective Build of PyTorch?
In PyTorch, CPU kernels can call other operators via the PyTorch Dispatcher. Simply including the set of root operators called directly by the model is not sufficient as there might be many more being called under-the-hood transitively. Running the model on representative inputs and observing the actual list of operators called (aka “tracing”) is the most accurate way of determining what parts of PyTorch are used.
Additionally, factors such as which dtypes a kernel should handle are also runtime features that depend on actual input provided to the model. Hence, the tracing mechanism is extremely suitable for this purpose.
Which features can be selected (in or out) by using Tracing Based Selective Build?
The following features can be selected for the PyTorch runtime during the tracing based selective build process:
- CPU/QuantizedCPU kernels for PyTorch’s ATen Operators: If a PyTorch Operator is not needed by a model targeted at a selectively built runtime, then the registration of that CPU kernel is omitted in the runtime. This is controlled via Torchgen code-gen.
- Primary Operators: This is controlled by a macro named TORCH_SELECTIVE_SCHEMA (via templated selective build) that either selects a primary operator or de-selects it based on information in a generated header file.
- Code that handles specific dtypes in CPU kernels: This is performed by generating exception throws in specific case statements in the switch case generated by the macro AT_PRIVATE_CHECK_SELECTIVE_BUILD.
- Registration of Custom C++ Classes that extend PyTorch: This is controlled by the macro TORCH_SELECTIVE_CLASS, which can be used when registering Custom C++ Classes. The torch::selective_class_<> helper is to be used in conjunction with the macro TORCH_SELECTIVE_CLASS.
What is the structure of the YAML file used during the build?
The YAML file generated after tracing looks like the example below. It encodes all the elements of the “selectable” build feature as specified above.
include_all_non_op_selectives: false
build_features: []
operators:
    aten::add.Tensor:
        is_used_for_training: false
        is_root_operator: true
        include_all_overloads: false
    aten::len.t:
        is_used_for_training: false
        is_root_operator: true
        include_all_overloads: false
kernel_metadata:
    _local_scalar_dense_cpu:
    - Float
    add_stub:
    - Float
    copy_:
    - Bool
    - Byte
    mul_cpu:
    - Float
custom_classes: []
How exactly is code eliminated from the generated binary?
Depending on the specific scenario, there are 2 main techniques that are used to hint the compiler and linker about unused and unreachable code. This code is then cleaned up by the compiler or linker as unreachable code.
[1] Unreferenced functions removed by the Linker
When a function that isn’t transitively referenced from any visible function is present in the compiled object files that are being linked together, the linker will remove it (if the right build flags are provided). This is leveraged in 2 scenarios by the selective build system.
Kernel Registration in the Dispatcher
If an operator’s kernel isn’t needed, then it isn’t registered with the dispatcher. An unregistered kernel means that the function is unreachable, and it will be removed by the linker.
Templated Selective Build
The general idea here is that a class template specialization is used to select a class that either captures a reference to a function or not (depending on whether it’s used) and the linker can come along and clean out the unreferenced function.
For example, in the code below, there’s no reference to the function “fn2”, so it will be cleaned up by the linker since it’s not referenced anywhere.
#include <vector>
#include <cstdio>

template <typename T, bool>
struct FunctionSelector {
    T fn_;
    FunctionSelector(T fn): fn_(fn) {}
    T get() { return this->fn_; }
};

// The "false" specialization of this class does NOT retain the argument passed
// to the class constructor, which means that the function pointer passed in
// is considered to be unreferenced in the program (unless it is referenced
// elsewhere).
template <typename T>
struct FunctionSelector<T, false> {
    FunctionSelector(T) {}
};

template <typename T>
FunctionSelector<T, true> make_function_selector_true(T fn) {
    return FunctionSelector<T, true>(fn);
}

template <typename T>
FunctionSelector<T, false> make_function_selector_false(T fn) {
    return FunctionSelector<T, false>(fn);
}

typedef void(*fn_ptr_type)();

std::vector<fn_ptr_type> fns;

template <typename T>
void add_fn(FunctionSelector<T, true> fs) {
    fns.push_back(fs.get());
}

template <typename T>
void add_fn(FunctionSelector<T, false>) {
    // Do nothing.
}

// fn1 will be kept by the linker since it is added to the vector "fns" at
// runtime.
void fn1() {
    printf("fn1n");
}

// fn2 will be removed by the linker since it isn't referenced at all.
void fn2() {
    printf("fn2n");
}

int main() {
    add_fn(make_function_selector_true(fn1));
    add_fn(make_function_selector_false(fn2));
}
[2] Dead Code Eliminated by the Compiler
C++ Compilers can detect dead (unreachable) code by analyzing the code’s control flow statically. For example, if there’s a code-path that comes after an unconditional exception throw, then all the code after it will be marked as dead code and not converted to object code by the compiler. Typically, compilers require the use of the -fdce flag to eliminate dead code.
In the example below, you can see that the C++ code on the left (in the red boxes) doesn’t have any corresponding generated object code on the right.
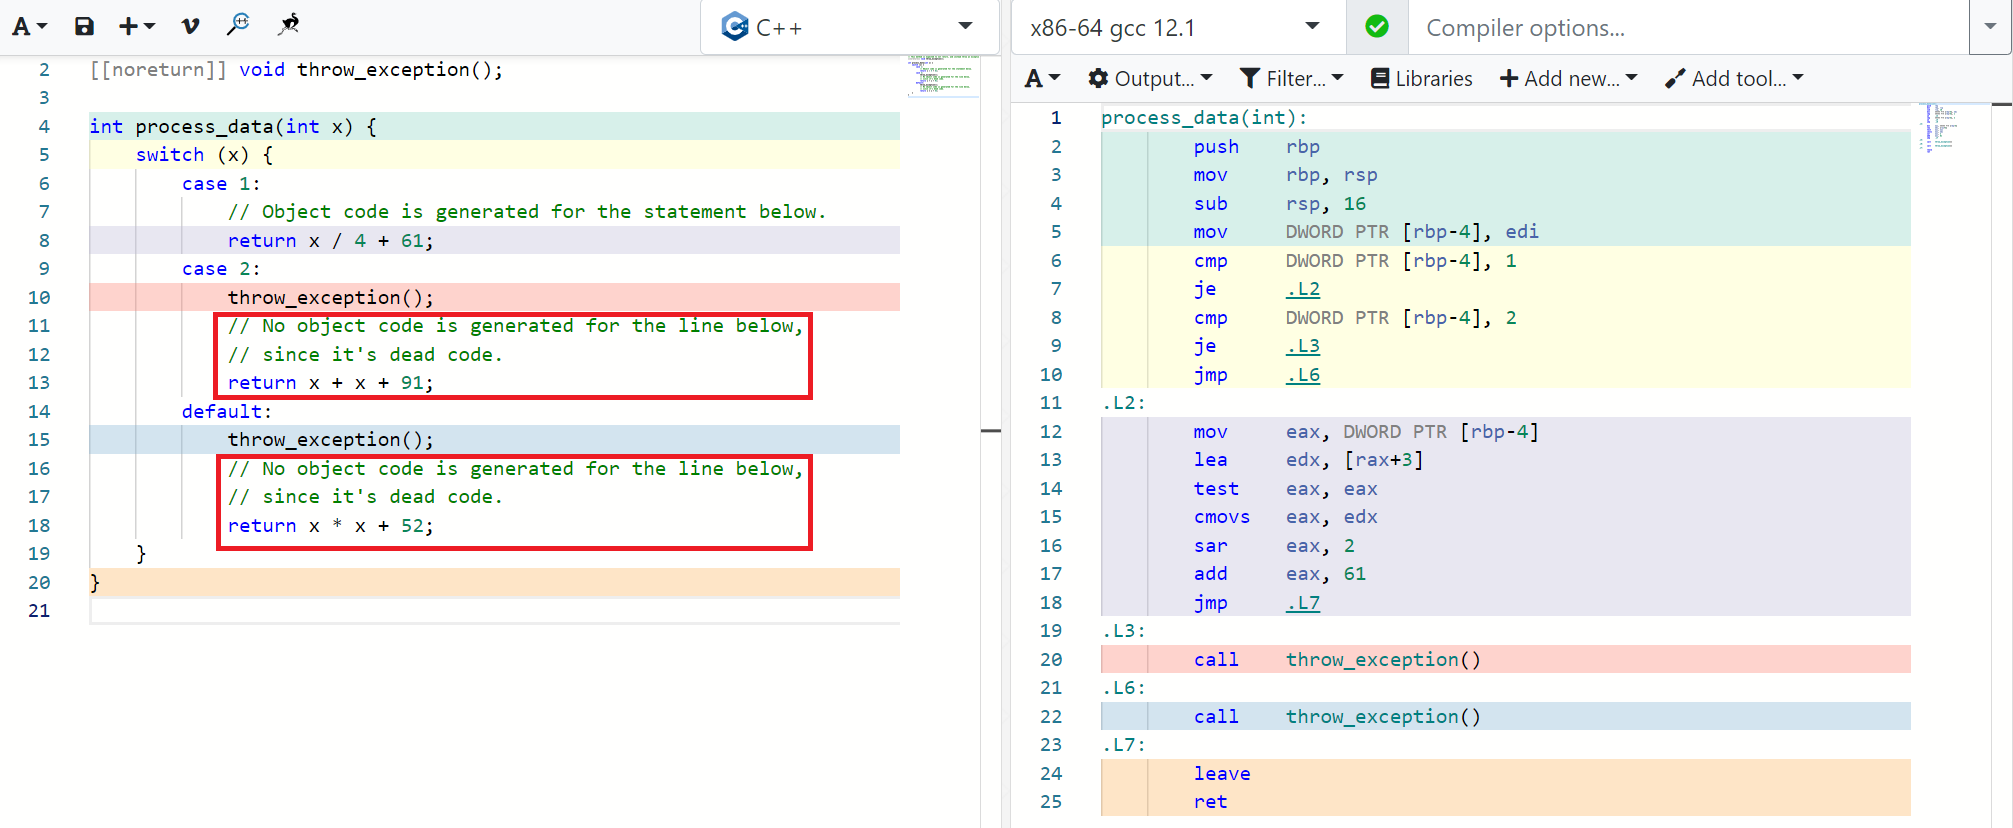
Figure 4: Dead Code Elimination by C++ Compilers
This property is leveraged in the bodies of PyTorch kernel implementations that have a lot of repeated code to handle multiple dtypes of a Tensor. A dtype is the underlying data-type that the Tensor stores elements of. This can be one of float, double, int64, bool, int8, etc…
Almost every PyTorch CPU kernel uses a macro of the form AT_DISPATCH_ALL_TYPES* that is used to substitute some code specialized for every dtype that the kernel needs to handle. For example:
AT_DISPATCH_ALL_TYPES_AND_COMPLEX_AND3(
    kBool, kHalf, kBFloat16, dtype, "copy_kernel", [&] {
  cpu_kernel_vec(
      iter,
      [=](scalar_t a) -> scalar_t { return a; },
      [=](Vectorized<scalar_t> a) -> Vectorized<scalar_t> { return a; });
});
The macro AT_DISPATCH_ALL_TYPES_AND_COMPLEX_AND3 internally has a switch-case statement that looks like the code in Figure-4 above. The tracing process records the dtypes triggered for the kernel tag “copy_kernel” and the build process processes these tags and inserts throw statements in every case statement that is handling the dtype that isn’t required for this kernel tag.
This is how dtype selectivity is implemented in PyTorch’s Tracing Based Selective Build.
Conclusion
Tracing Based Selective Build is a practical and scalable approach to selecting only the used parts of an application to retain code that static analysis can not detect. This code is usually extremely data/input dependent in nature.
This article provides detailed insights into how Tracing Based Selective Build works under the hood, and the technical details related to its implementation. These techniques can also be applied to other applications and situations that can benefit from reduced binary size.