Figure 1: Behavior-driven AI development centers model iteration on evaluating and improving specific real-world use cases.
It has never been easier to prototype AI-driven systems. With a bit of programming knowledge and a couple of hours, you can spin up a chatbot for your notes, a text-based image editor, or a tool for summarizing customer feedback. But play around with your prototype for a bit, and you might find that it doesn’t work as well as you first expected. Your system might make up facts or respond with racist suggestions. How would you evaluate your model and predict its performance in deployment?
The canonical process for benchmarking AI systems revolves around model-centric metrics. Calculate a metric (F1-score, precision, etc.), and if it increases, you are going in the right direction. But these metrics are oversimplified objectives that sand away the complexity of model behavior and cannot fully represent a model’s performance. A metric may tell you how well your model can predict the next word in a sentence, but it won’t tell you how factually accurate, logical, or fair your model is across diverse, real-world use cases. Generative AI systems such as ChatGPT or Stable Diffusion make evaluation even more challenging since there are no well-defined metrics that can summarize their performance.
When creating deployed AI products, practitioners instead focus on the specific use cases their customers have and whether or not their models are fulfilling them. In interviews with 18 AI practitioners, we found that they constantly collect user feedback and develop “golden test sets” of behaviors that they expect deployed models to have. We term this behavior-driven AI development, a development process focused on evaluating and updating models to improve performance on real-world use cases. While chatbot A might sound more human-like, a practitioner will deploy chatbot B if it produces concise and accurate answers that customers prefer.
The landscape of AI evaluation tools primarily revolves around model-centric metrics that do not capture important behaviors like these chatbot characteristics. While there are specific tools for behavior-driven development, such as fairness toolkits and robustness analysis libraries, practitioners end up cobbling together disparate tools into ad-hoc scripts or computational notebooks that are hard to maintain and reproduce.
I believe that there are a set of abstractions that can unify AI evaluation in line with model use cases in practice. This philosophy revolves around model behaviors: metrics summarizing patterns of output on subgroups of instances. This simple concept can encode any model evaluation or analysis, from fairness audits to language model hallucinations. We show what this can look like with Zeno, an interactive platform we built for behavior-driven development that supports interactive data exploration, slicing, and reporting. By investigating their own models using Zeno, practitioners have been able to pinpoint significant and actionable issues such as biases and systematic failures.
What is model behavior?
The dictionary describes behavior as anything that an organism does involving action and response to stimulation. In the case of AI systems, model behavior is a specific pattern of output for a semantically meaningful subgroup of input data (stimulus). By semantically meaningful, I mean subgroups that can be described with human-interpretable concepts, such as “audio with noise in the background” or “people who identify as women.” Similarly, a pattern of output could be “high audio transcription error” or “low loan approval rate.”
Behaviors can be quantified as metrics on subgroups of data, often using the same metrics as are used for model-centric evaluation. But unlike summary metrics across an entire dataset, metrics in behavior-centric development quantify specific patterns of behavior, like how often an image generation model produces unintelligible text. Tests of model behaviors are like exams for specific subjects, while summary metrics resemble IQ tests.
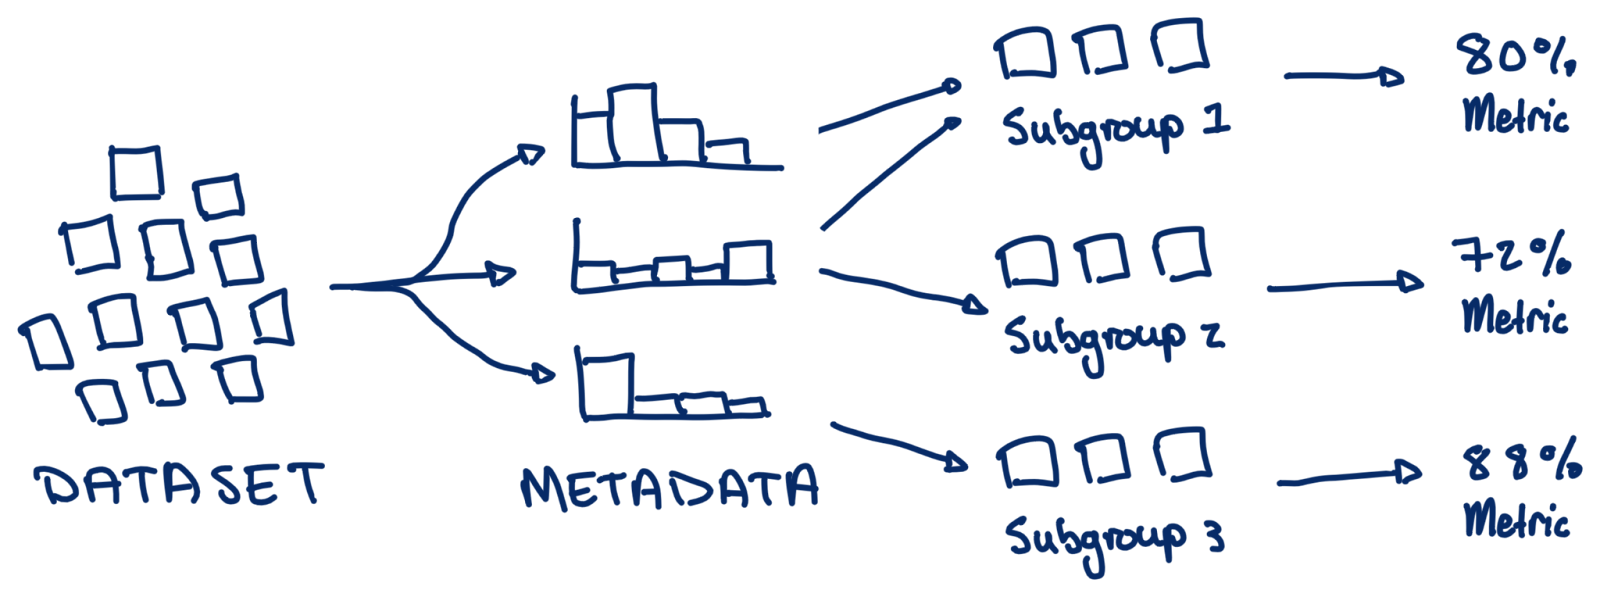
Model behaviors are a relatively simple concept, but encoding behaviors can be challenging in practice. Practitioners may not have enough data to validate or fix important model behaviors and have to collect or generate more data. If they have extensive data, they need ways to subdivide it into meaningful groups of instances – how do I find all images that have text? Lastly, for each subgroup, practitioners have to derive the appropriate metrics to quantify the prevalence of behavior – how do I detect blurry text? Succinctly, behavior-driven development requires sufficient data that is representative of expected behaviors and metadata for defining and quantifying the behaviors.
A platform for behavior-driven AI development
The beauty of a behavior-based framing on AI development is that it is still data and model agnostic. While the specific behaviors for each ML task will be vastly different, subgroups of data and metrics are universal concepts.
To test this theory, we built a platform for behavior-driven AI development called Zeno. Zeno is a platform that empowers users to explore data and model outputs, interactively create subgroups of data, and calculate and quantify model behaviors. Zeno consists of a Python API for scaffolding the data needed for analysis and a user interface for interactively creating subgroups and evaluating behaviors.
The Python API is a set of decorator functions (wrappers on user-defined functions) that can be used to plug in ML models and derive metadata features and metrics from input data. Since the decorators are generic wrappers, Zeno supports any Python-based model, processing function, or metric. Zeno preprocesses the input data with these functions, which it passes into the UI for analysis.
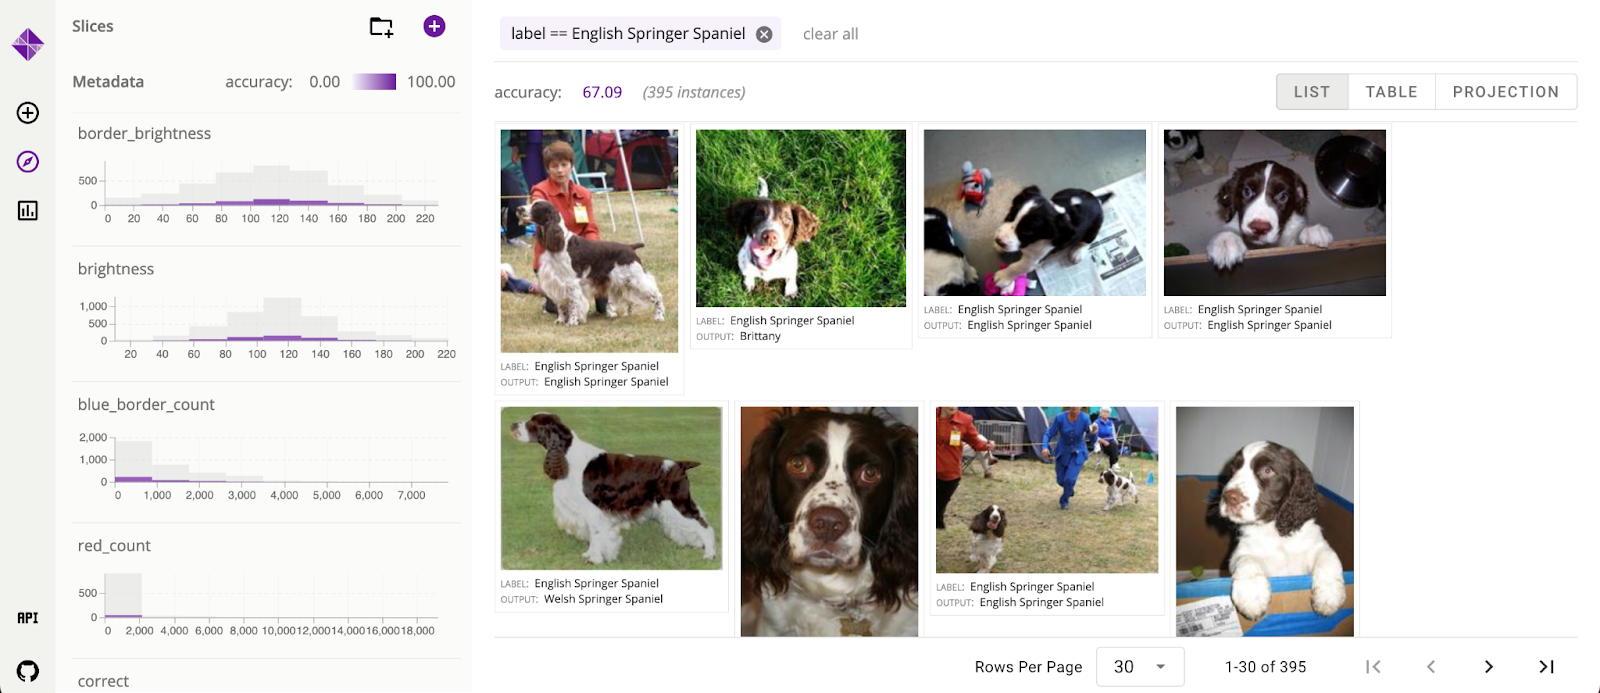
Zeno’s UI is the primary interface for behavior-driven evaluation. It allows users to interactively explore and filter their data, create slices, calculate metrics, and create exportable visualizations. On the right side of the UI is Zeno’s instance view, where users can explore the raw data on which the model is being evaluated. In addition to the standard list view, users can also see the data in a table or a 2D scatterplot representation. The left side of the interface holds the metadata panel. All the metadata columns that either came with the dataset or were generated with the Python API have their distributions displayed in the panel. Users can interactively filter the distributions to update the instance view and create named subgroups.
The UI also has a report page for creating interactive summary visualizations of behaviors. For example, a user could create a bar chart comparing the performance of three models across ten different slices. Or they could create a line chart showing how a model performs on data slices from each day of data. These visualizations can be exported or shared directly with other stakeholders.
Case Studies
We have worked with various ML practitioners to apply Zeno to the models and tasks on which they work. Using Zeno, practitioners found significant model issues and areas for improvement, including gender biases and regional model disparities.
Audio transcription. This first case study I ran myself after I heard that OpenAI released a new speech-to-text model, Whisper, with state-of-the-art performance. I was curious how the model compared to some existing off-the-shelf transcription models. Instead of looking at aggregate metrics, I ran the models on the Speech Accent Archive dataset, which has speakers worldwide saying the same phrase. By filtering the dataset’s extensive metadata, I found that the models perform worse for English speakers who learned the language later in life and speakers from countries where English is not the native language.
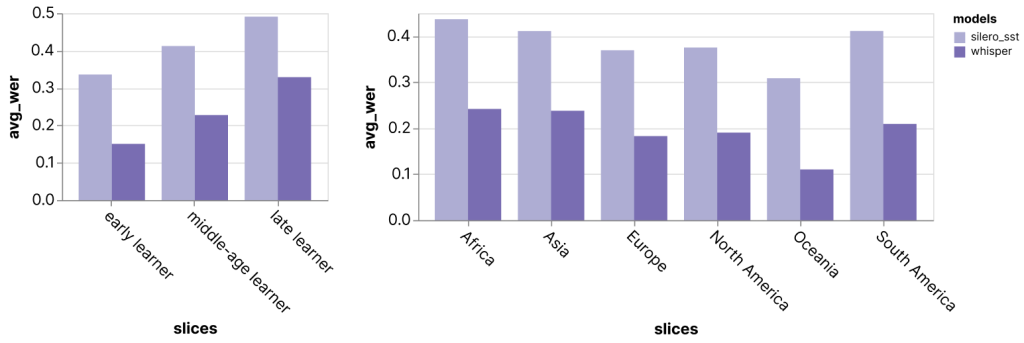
Charts exported directly from the Zeno Report UI.
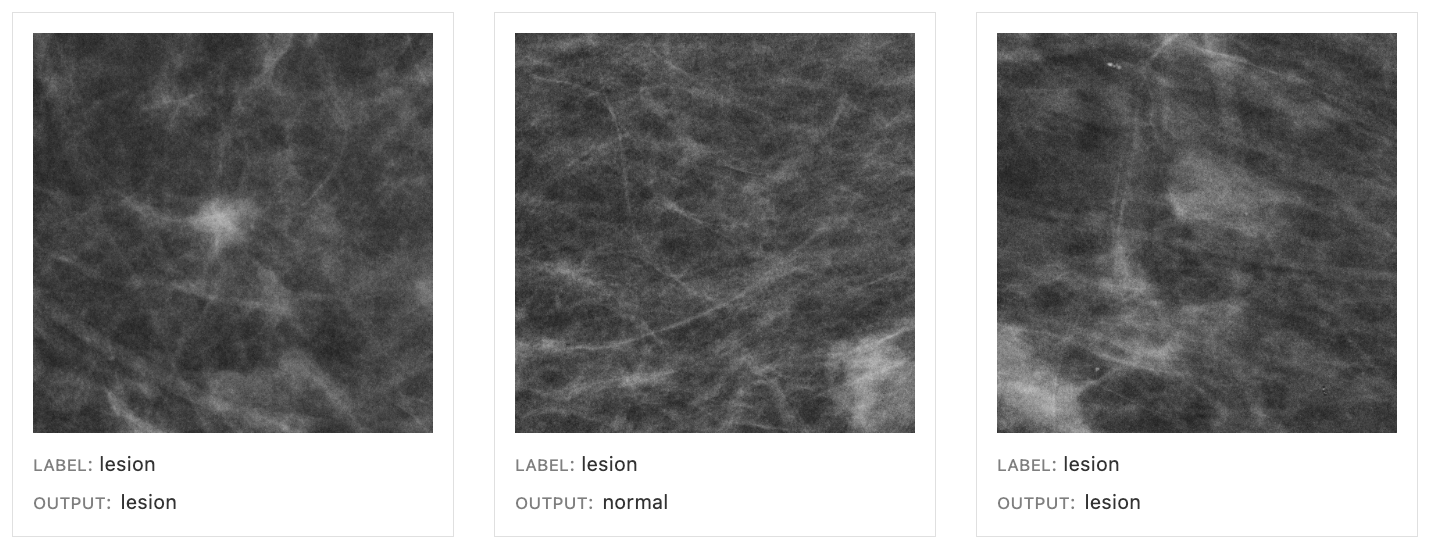
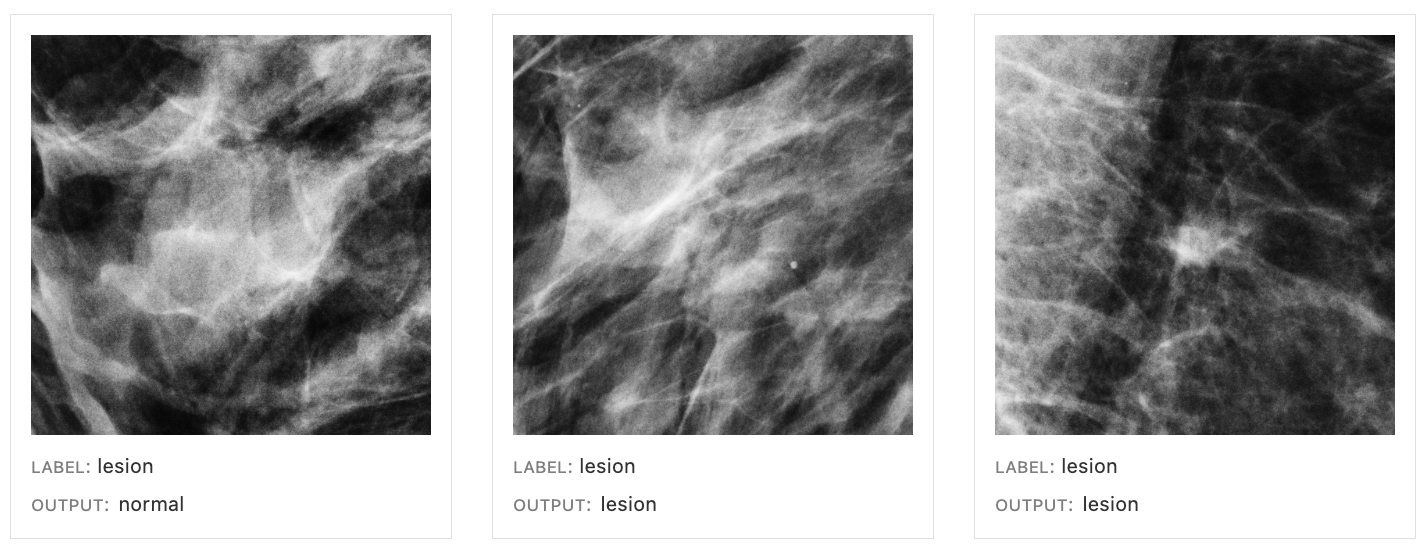
Cancer classification. In another case study, we worked with a researcher who wanted to improve a breast cancer classifier for mammogram images. Since the data was anonymized and lacked meaningful metadata, the practitioner wrote dozens of functions using a Python library to extract meaningful metadata features. By exploring the distributions, they found that images with higher “entropy” correlating with denser breast tissue had a significantly higher error rate than images with lower entropy, or less dense, tissue. This finding matches performance differences in human radiologists, who also perform worse for images of denser breast tissue since it makes it harder to detect lesions.
| Low density (4937) entropy < 2.75 && gray level variance < 2.5 |
High density (656) entropy > 2.75 && gray level variance > 2.5 |
|
| AUC | 0.86 | 0.76 |
Image generation. Models with complex outputs often do not have clearly defined metrics, including text-to-image generation models such as DALL*E and Stable Diffusion. We can instead look at metrics that measure specific behaviors. In this example, a practitioner we worked with was exploring the DiffusionDB dataset, which has over two million prompt-image pairs from the Stable Diffusion model. The dataset also has metadata for how NSFW or inappropriate the prompts and images are. This data was used to derive an “average NSFW” metric, which can show us interesting potential biases in the model. For example, the participant compared the images generated using prompts with the word “boy” versus “girl” and found that prompts with “girl” generated images with a significantly higher NSFW level than prompts with “boy”, showing potential biases in the types of images created by the model.
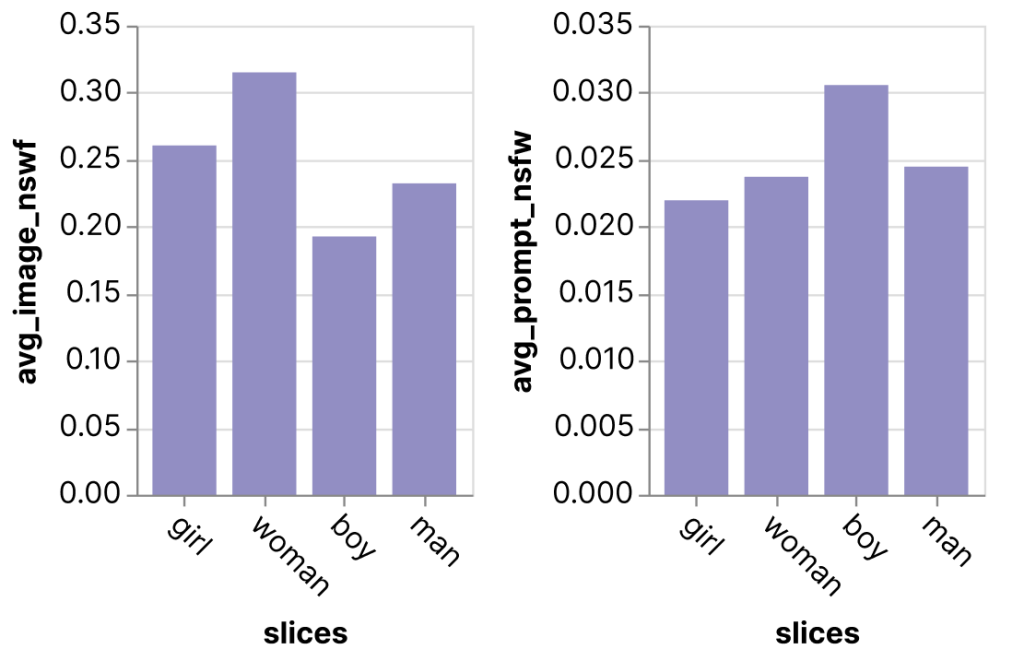
Charts exported directly from the Zeno Report UI.
Discussion and Opportunities
Model iteration is still a primarily reactive process of finding and defining behaviors after a model has been deployed and the customer complaints start rolling in. There remains significant room for improving this process, from making it easier to ideate model behaviors to tracking model changes over time.
Discovering behaviors. While practitioners often need a model to discover the behaviors the model should have, methods for defining expected model behaviors before deployment can prevent serious real-world model issues. For example, crowdsourcing techniques for eliciting potential edge cases could preemptively catch model errors. Algorithmic methods that find clusters of data with high error have also shown promise for surfacing problematic behaviors.
Data discovery and generation. Having high-quality, representative data remains a persistent obstacle for behavioral evaluation. In some domains with ample data, such as natural images, methods like Stable Diffusion have shown promise for generating new data for evaluation or training. In less data-rich domains, techniques for searching through large unlabeled datasets, such as text-based image search, can surface valuable data for evaluation and retraining. It is also challenging to derive metadata from instances for creating subgroups and calculating metrics. While it can be easy to generate metadata for simple concepts like “image brightness,” many behaviors are defined by complex metadata such as “images with a person wearing clear glasses” that cannot be encoded by a simple function. Foundation models have shown some promise in using text-based descriptions to generate complex metadata and metrics.
Model comparison. Models are almost never one-off jobs and can be updated daily or weekly. While it is easy to compare aggregate metrics, it can be challenging to compare model performance in behavior-driven development. To pick between models, users may have to compare dozens of behaviors and qualitative insights. Improved visual encodings or intelligent recommendations of model differences could help users make informed decisions and deploy the right models.
Fixing behaviors. Discovering and encoding behaviors is one thing, but fixing behaviors is another massive challenge. A common approach to fixing issues is to gather more data and retrain the model, but this process can lead to catastrophic forgetting and regressions. There are recent techniques that align well with behavior-driven development, such as slice-based learning, which can selectively fix model behaviors without new data.
Conclusion
There is significant excitement for this new era of AI systems. But along with their growing capability, the complexity of their behavior is also increasing. We need powerful tools to empower behavior-driven development and ensure we build intelligent systems that align with human values. Zeno provides a general-purpose platform that empowers users to do this deep evaluation across the diverse tasks of modern AI. Learn more about Zeno at zenoml.com, read the full paper, or reach out if you would like to use Zeno for your models!
Acknowledgments
I’d like to thank Will Epperson, Jason I. Hong, Yi-Cheng Huang, Misha Khodak, Adam Perer, Venkat Sivaraman, Ameet Talwalkar, and Kristen Vossler for their thoughtful feedback and advice.