This is part 2 of the Understanding GPU Memory blog series. Our first post Understanding GPU Memory 1: Visualizing All Allocations over Time shows how to use the memory snapshot tool. In this part, we will use the Memory Snapshot to visualize a GPU memory leak caused by reference cycles, and then locate and remove them in our code using the Reference Cycle Detector.
Sometimes when we were using the Memory Snapshot, we saw plots of GPU memory that looked similar to this.
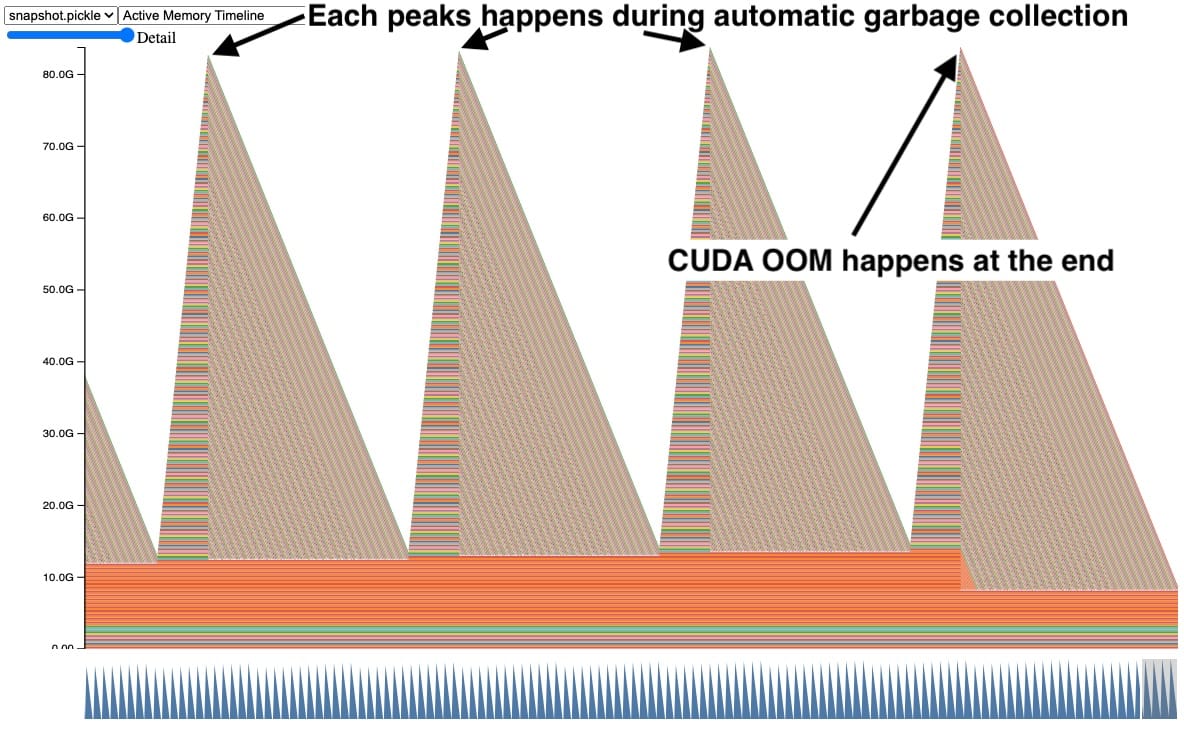
In this snapshot, each peak shows GPU tensors building up over time and then several tensors getting released at once. In addition, a CUDA OOM happens on the right side causing all the tensors to be released. Seeing the tensors accumulate like this is a clear indication of a problem, but it doesn’t immediately suggest why.
Tensors in Reference Cycles
During early debugging, we dug in further to find that this **pattern happens a lot when your Python code has objects with reference cycles. ** Python will clean up non-cyclic objects immediately using reference counting. However objects in reference cycles are only cleaned up later by a cycle collector. If these cycles refer to a GPU tensor, the GPU tensor will stay alive until that cycle collector runs and removes the reference cycle. Let’s take a look at a simplified example.
Code Snippet behind the snapshot (full code in Appendix A):
    def leak(tensor_size, num_iter=100000, device="cuda:0"):
      class Node:
        def __init__(self, T):
          self.tensor = T
          self.link = None

      for _ in range(num_iter):
        A = torch.zeros(tensor_size, device=device)
        B = torch.zeros(tensor_size, device=device)
        a, b = Node(A), Node(B)

        # A reference cycle will force refcounts to be non-zero.
        a.link, b.link = b, a
        # Python will eventually garbage collect a & b, but will
        # OOM on the GPU before that happens (since python
        # runtime doesn't know about CUDA memory usage).
In this code example, the tensors A and B are created, where A has a link to B and vice versa. This forces a non-zero reference count when A and B go out of scope. When we run this for 100,000 iterations, we expect the automatic garbage collection to free the reference cycles when going out of scope. However, this will actually CUDA OOM.
Why doesn’t automatic garbage collection work?
The automatic garbage collection works well when there is a lot of extra memory as is common on CPUs because it amortizes the expensive garbage collection by using Generational Garbage Collection. But to amortize the collection work, it defers some memory cleanup making the maximum memory usage higher, which is less suited to memory constrained environments. The Python runtime also has no insights into CUDA memory usage, so it cannot be triggered on high memory pressure either. It’s even more challenging as GPU training is almost always memory constrained because we will often raise the batch size to use any additional free memory.
The CPython’s garbage collection frees unreachable objects held in reference cycles via the mark-and-sweep. The garbage collection is automatically run when the number of objects exceeds certain thresholds. There are 3 generations of thresholds to help amortize the expensive costs of running garbage collection on every object. The later generations are less frequently run. This would explain why automatic collections will only clear several tensors on each peak, however there are still tensors that leak resulting in the CUDA OOM. Those tensors were held by reference cycles in later generations.
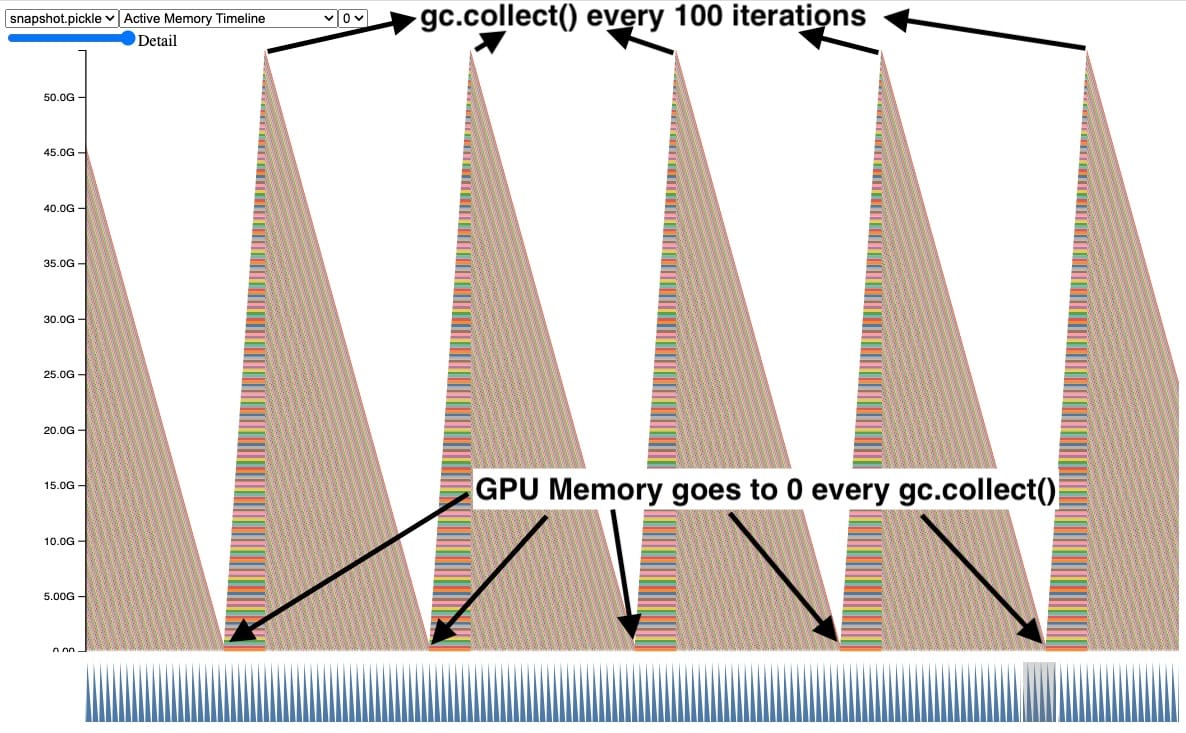
Explicitly calling gc.collect()
One way to fix this is by explicitly calling the garbage collector frequently. Here we can see that the GPU memory for tensors out of scope gets cleaned up when we explicitly call the garbage collector every 100 iterations. This also controls the maximum GPU peak memory held by leaking tensors.
Although this works and fixes the CUDA OOM issue, calling gc.collect() too frequently can cause other issues including QPS regressions. Therefore we cannot simply increase the frequency of garbage collection on every training job. It’s best to just avoid creating reference cycles in the first place. More on this in section, Reference Cycle Detector.
Sneaky Memory Leak in Callback
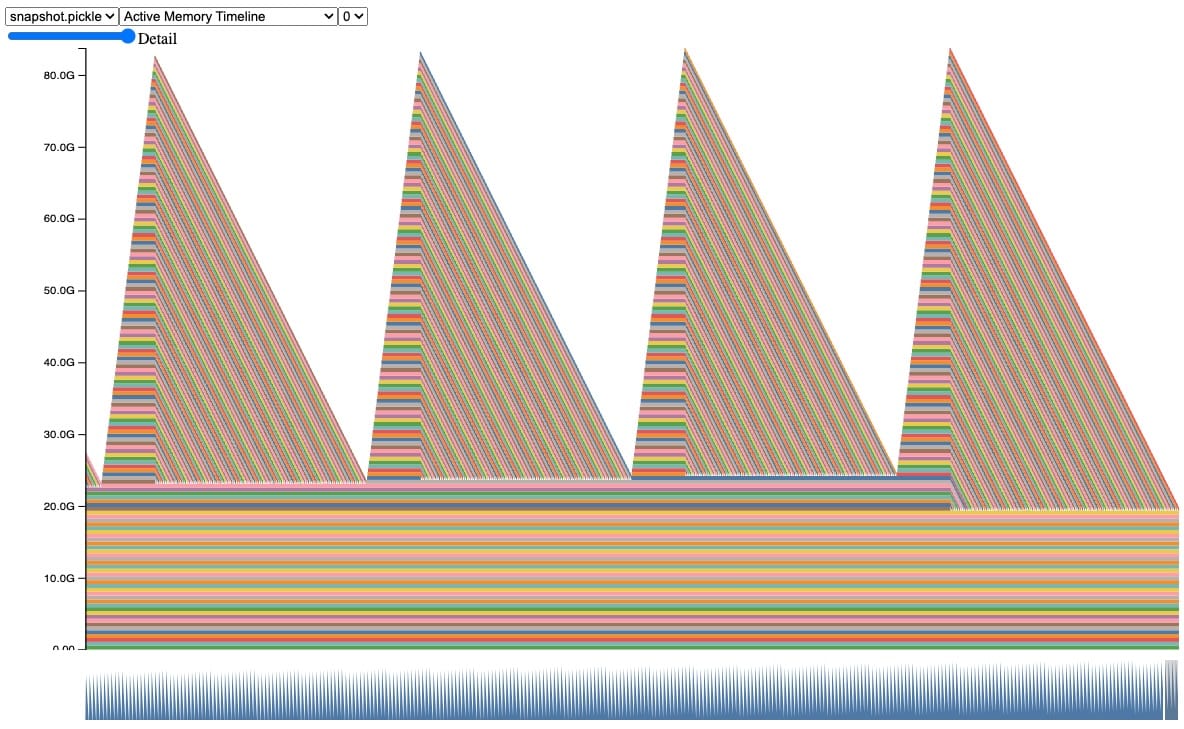
Real examples are more complicated, so let’s look at a more realistic example that has a similar behavior. In this snapshot, we can observe the same behavior of tensors being accumulated and freed during automatic garbage collection, until we hit a CUDA OOM.
Code Snippet behind this snapshot (full code sample in Appendix A):
    class AwaitableTensor:
      def __init__(self, tensor_size):
        self._tensor_size = tensor_size
        self._tensor = None

      def wait(self):
        self._tensor = torch.zeros(self._tensor_size, device="cuda:0")
        return self._tensor

    class AwaitableTensorWithViewCallback:
      def __init__(self, tensor_awaitable, view_dim):
        self._tensor_awaitable = tensor_awaitable
        self._view_dim = view_dim
        # Add a view filter callback to the tensor.
        self._callback = lambda ret: ret.view(-1, self._view_dim)

      def wait(self):
        return self._callback(self._tensor_awaitable.wait())

    async def awaitable_leak(
      tensor_size=2**27, num_iter=100000,
    ):
      for _ in range(num_iter):
        A = AwaitableTensor(tensor_size)
        AwaitableTensorWithViewCallBack(A, 4).wait()
In this code, we define two classes. The class AwaitableTensor will create a tensor when waited upon. Another class AwaitableTensorWithViewCallback will apply a view filter on the AwaitableTensor via callback lambda.
When running awaitable_leak, which creates tensor A (512 MB) and applies a view filter for 100,000 iterations, we expect that A should be reclaimed each time it goes out of scope because the reference count should reach 0. However, this will actually OOM!
While we know there is a reference cycle here, it isn’t clear from the code where the cycle is created. To help with these situations, we have created a tool to locate and report these cycles.
Reference Cycle Detector
Introducing the Reference Cycle Detector, which helps us find reference cycles keeping GPU tensors alive. The API is fairly simple:
- During model initialization:
- Import:
from torch.utils.viz._cycles import warn_tensor_cycles - Start:
warn_tensor_cycles()
- Import:
The Reference Cycle Detector will issue warnings every time that the cycle collector runs and finds a CUDA tensor that gets freed. The warning provides an object graph showing how the reference cycle refers to the GPU tensor.
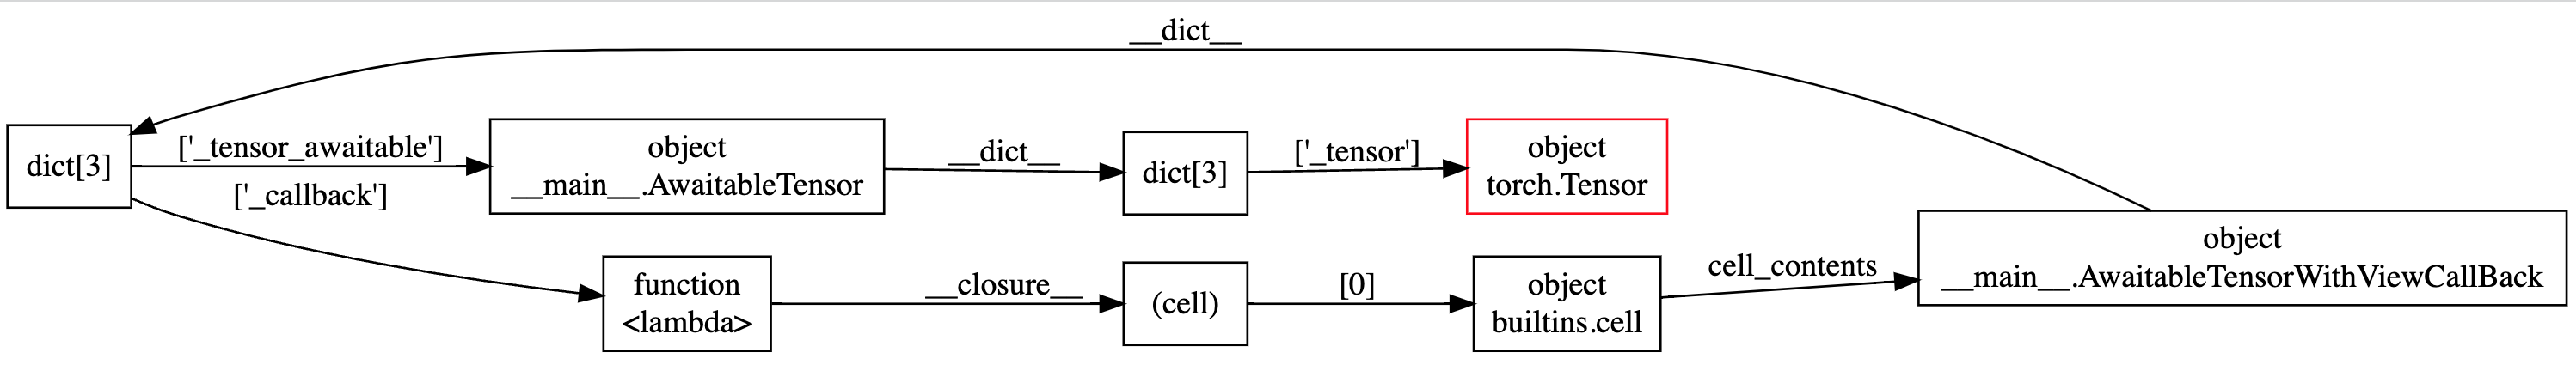
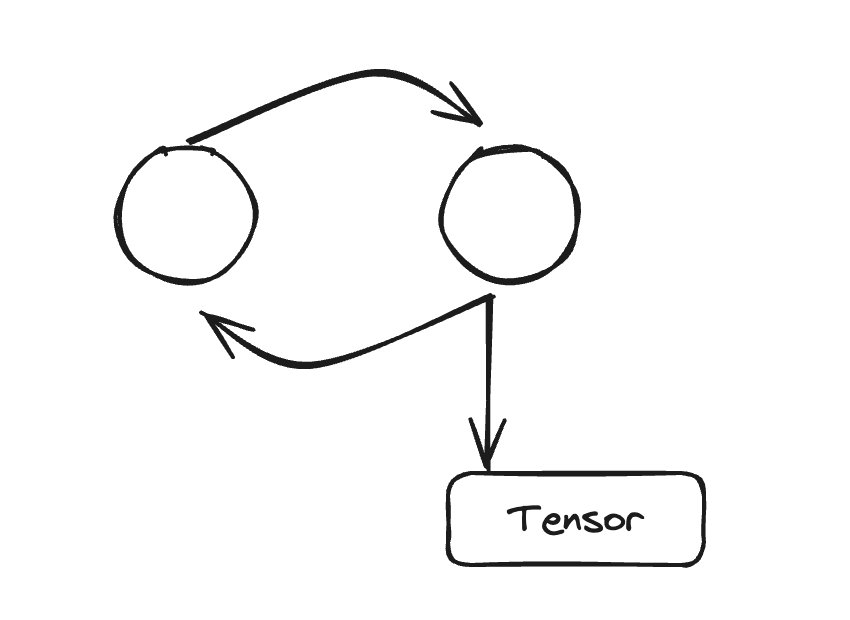
For instance in this object graph, we can easily observe that there is a circular dependency on the outer circle of the graph, and highlighted in red is the GPU tensor kept alive.
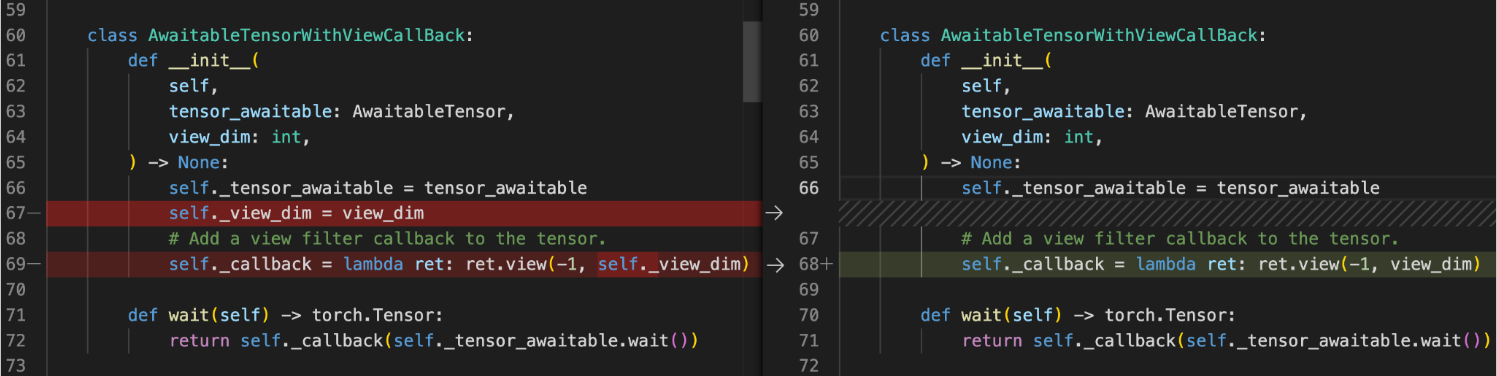
Most cycles are pretty easy to fix once they are discovered. For instance here we can remove the reference to self created by self._view_dim in the callback.
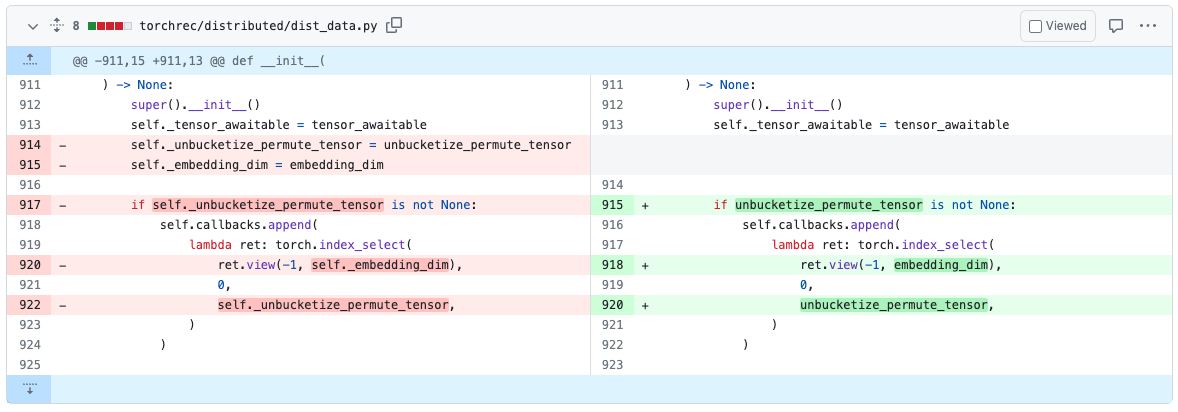
We’ve spent some time fixing cycles in existing models using these tools. For example in TorchRec, we’ve found and removed a reference cycle in PR#1226.
Once we’ve removed the reference cycles, the code will no longer issue a CUDA OOM nor show any memory leaks in their snapshots.
What are the other benefits of using the Reference Cycle Detector?
Removing these cycles will also directly lower the maximum GPU memory usage as well as make it less likely for memory to fragment because the allocator returns to the same state after each iteration.
Where can I find these tools?
We hope that the Reference Cycle Detector will greatly improve your ability to find and remove memory leaks caused by reference cycles. The Reference Cycle Detector is available in the v2.1 release of PyTorch as experimental features and More information about the Reference Cycle Detector can be found in the PyTorch Memory docs here.
Feedback
We look forward to hearing from you about any enhancements, bugs or memory stories that our tools helped to solve! As always, please feel free to open new issues on PyTorch’s Github page.
We are also open to contributions from the OSS community, feel free to tag Aaron Shi and Zachary DeVito in any Github PRs for reviews.
Acknowledgements
Really appreciate the content reviewers, Mark Saroufim, Gregory Chanan, and Adnan Aziz for reviewing this post and improving its readability.
Appendix
Appendix A – Code Sample
This code snippet was used to generate the plots and examples shown. Here are the arguments to reproduce the sections:
- Introduction:
python sample.py - Explicitly calling gc.collect():
python sample.py --gc_collect_interval=100 - Sneaky Memory Leak in Callback:
python sample.py --workload=awaitable - Ref Cycle Detector:
python sample.py --workload=awaitable --warn_tensor_cycles
sample.py:
# (c) Meta Platforms, Inc. and affiliates.
import argparse
import asyncio
import gc
import logging
import socket
from datetime import datetime, timedelta

import torch

logging.basicConfig(
   format="%(levelname)s:%(asctime)s %(message)s",
   level=logging.INFO,
   datefmt="%Y-%m-%d %H:%M:%S",
)
logger: logging.Logger = logging.getLogger(__name__)
logger.setLevel(level=logging.INFO)

TIME_FORMAT_STR: str = "%b_%d_%H_%M_%S"

# Keep a max of 100,000 alloc/free events in the recorded history
# leading up to the snapshot.
MAX_NUM_OF_MEM_EVENTS_PER_SNAPSHOT: int = 100000

def start_record_memory_history() -> None:
   if not torch.cuda.is_available():
       logger.info("CUDA unavailable. Not recording memory history")
       return

   logger.info("Starting snapshot record_memory_history")
   torch.cuda.memory._record_memory_history(
       max_entries=MAX_NUM_OF_MEM_EVENTS_PER_SNAPSHOT
   )

def stop_record_memory_history() -> None:
   if not torch.cuda.is_available():
       logger.info("CUDA unavailable. Not recording memory history")
       return

   logger.info("Stopping snapshot record_memory_history")
   torch.cuda.memory._record_memory_history(enabled=None)

def export_memory_snapshot() -> None:
   if not torch.cuda.is_available():
       logger.info("CUDA unavailable. Not exporting memory snapshot")
       return

   # Prefix for file names.
   host_name = socket.gethostname()
   timestamp = datetime.now().strftime(TIME_FORMAT_STR)
   file_prefix = f"{host_name}_{timestamp}"

   try:
       logger.info(f"Saving snapshot to local file: {file_prefix}.pickle")
       torch.cuda.memory._dump_snapshot(f"{file_prefix}.pickle")
   except Exception as e:
       logger.error(f"Failed to capture memory snapshot {e}")
       return

# This function will leak tensors due to the reference cycles.
def simple_leak(tensor_size, gc_interval=None, num_iter=30000, device="cuda:0"):
    class Node:
        def __init__(self, T):
            self.tensor = T
            self.link = None

    for i in range(num_iter):
        A = torch.zeros(tensor_size, device=device)
        B = torch.zeros(tensor_size, device=device)
        a, b = Node(A), Node(B)
        # A reference cycle will force refcounts to be non-zero, when
        # a and b go out of scope.
        a.link, b.link = b, a
        # Python will eventually gc a and b, but may OOM on the CUDA
        # device before that happens (since python runtime doesn't
        # know about CUDA memory usage).

        # Since implicit gc is not called frequently enough due to
        # generational gc, adding an explicit gc is necessary as Python
        # runtime does not know about CUDA memory pressure.
        # https://en.wikipedia.org/wiki/Tracing_garbage_collection#Generational_GC_(ephemeral_GC)
        if gc_interval and i % int(gc_interval) == 0:
            gc.collect()

async def awaitable_leak(
    tensor_size, gc_interval=None, num_iter=100000, device="cuda:0"
):
    class AwaitableTensor:
        def __init__(self, tensor_size, device) -> None:
            self._tensor_size = tensor_size
            self._device = device
            self._tensor = None

        def wait(self) -> torch.Tensor:
            self._tensor = torch.zeros(self._tensor_size, device=self._device)
            return self._tensor

    class AwaitableTensorWithViewCallBack:
        def __init__(
            self,
            tensor_awaitable: AwaitableTensor,
            view_dim: int,
        ) -> None:
            self._tensor_awaitable = tensor_awaitable
            self._view_dim = view_dim
            # Add a view filter callback to the tensor.
            self._callback = lambda ret: ret.view(-1, self._view_dim)

        def wait(self) -> torch.Tensor:
            return self._callback(self._tensor_awaitable.wait())

    for i in range(num_iter):
        # Create an awaitable tensor
        a_tensor = AwaitableTensor(tensor_size, device)

        # Apply a view filter callback on the awaitable tensor.
        AwaitableTensorWithViewCallBack(a_tensor, 4).wait()

        # a_tensor will go out of scope.

        if gc_interval and i % int(gc_interval) == 0:
            gc.collect()

if __name__ == "__main__":
    parser = argparse.ArgumentParser(description="A memory_leak binary instance")
    parser.add_argument(
        "--gc_collect_interval",
        default=None,
        help="Explicitly call GC every given interval. Default is off.",
    )
    parser.add_argument(
        "--workload",
        default="simple",
        help="Toggle which memory leak workload to run. Options are simple, awaitable.",
    )
    parser.add_argument(
        "--warn_tensor_cycles",
        action="store_true",
        default=False,
        help="Toggle whether to enable reference cycle detector.",
    )
    args = parser.parse_args()

    if args.warn_tensor_cycles:
        from tempfile import NamedTemporaryFile

        from torch.utils.viz._cycles import observe_tensor_cycles

        logger.info("Enabling warning for Python reference cycles for CUDA Tensors.")

        def write_and_log(html):
            with NamedTemporaryFile("w", suffix=".html", delete=False) as f:
                f.write(html)
                logger.warning(
                    "Reference cycle includes a CUDA Tensor see visualization of cycle %s",
                    f.name,
                )

        observe_tensor_cycles(write_and_log)
    else:
        # Start recording memory snapshot history
        start_record_memory_history()

    # Run the workload with a larger tensor size.
    # For smaller sizes, we will not CUDA OOM as gc will kick in often enough
    # to reclaim reference cycles before an OOM occurs.
    size = 2**26  # 256 MB
    try:
        if args.workload == "awaitable":
            size *= 2
            logger.info(f"Running tensor_size: {size*4/1024/1024} MB")
            asyncio.run(
                awaitable_leak(tensor_size=size, gc_interval=args.gc_collect_interval)
            )
        elif args.workload == "simple":
            logger.info(f"Running tensor_size: {size*4/1024/1024} MB")
            simple_leak(tensor_size=size, gc_interval=args.gc_collect_interval)
        else:
            raise Exception("Unknown workload.")
    except Exception:
        logger.exception(f"Failed to allocate {size*4/1024/1024} MB")

    # Create the memory snapshot file
    export_memory_snapshot()

    # Stop recording memory snapshot history
    stop_record_memory_history()