Cities across the world are transforming their public services infrastructure with the mission of enhancing the quality of life of its residents. Roads and traffic management systems are part of the central nervous system of every city. They need intelligent monitoring and automation in order to prevent substantial productivity loss and in extreme cases life-threatening situations such as obstruction to free movement of emergency services.
Today, in most city traffic operations centers, monitoring video feeds from roadside cameras is a fairly manual activity. It requires operations center engineers to mentally correlate and apply institutional knowledge to determine if an ongoing situation is an anomaly, which makes this activity error-prone and susceptible to delays.

Where AI/ML based solutions have been applied to analyze video feeds, there is a lot of complexity involved in ingesting, curating, and preparing data in the right format and then optimizing and maintaining the effectiveness of these machine learning (ML) models over long periods of time. This has been one of the barriers to quickly implementing and scaling the adoption of ML capabilities and in turn realizing the automation outcomes at city traffic operation centers.
This post shows you how to use an integrated solution with Amazon Lookout for Metrics and Amazon Kinesis Data Analytics Studio (among other AWS services) to break these barriers by quickly and easily ingesting streaming data, aggregating and curating it, and subsequently detecting anomalies in the key performance indicators of your interest.
Lookout for Metrics automatically detects and diagnoses anomalies (outliers from the norm) in business and operational data. It’s a fully managed ML service, which uses specialized ML models to detect anomalies based on the characteristics of your data. You don’t need ML experience to use Lookout for Metrics.
Kinesis Data Analytics Studio provides an interactive notebook experience powered by Apache Zeppelin and Apache Flink to analyze streaming data. It also helps productionize your analytics application by building and deploying code as a Kinesis data analytics application straight from the notebook.
We demonstrate one of the most common traffic management scenarios, in which we detect anomalies in the number of vehicles and persons passing the view of ML-capable video infrastructure deployed at the roadside in order to enable capabilities such as automated traffic light pattern optimization, dynamic utilization of reserved lanes, and rapid deployment of emergency services. By the end of this post, you’ll learn how to use these managed services from AWS to meet the outcomes of smart cities to increase safety and reduce traffic. This solution can be equally applied to accelerate other outcomes for smart city management such as detecting anomalies in water supply (water pipe leaks), crowd density (safe campuses in the context of the pandemic), non-green energy usage, and community Wi-Fi traffic patterns, to name a few.
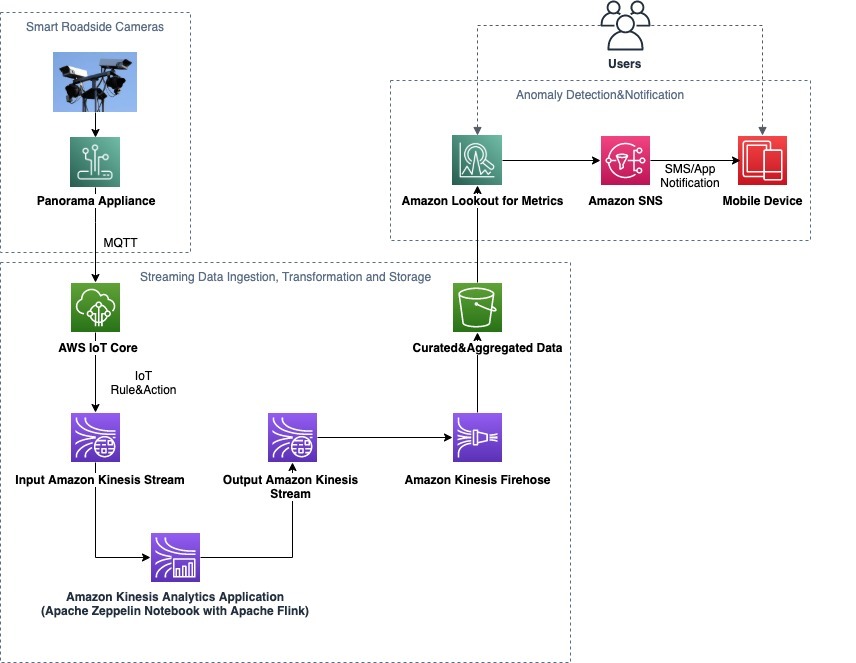
Solution architecture
The architecture consists of three functional blocks:
- Smart roadside cameras
- Streaming data ingestion, transformation, and storage
- Anomaly detection and notification
The solution provides a fully automated data path from the smart cameras all the way to a notification being raised to the user. You can also interact with the solution using the Lookout for Metrics UI in order to analyze the identified anomalies.
The following diagram illustrates our solution architecture.
Smart roadside cameras using AWS Panorama
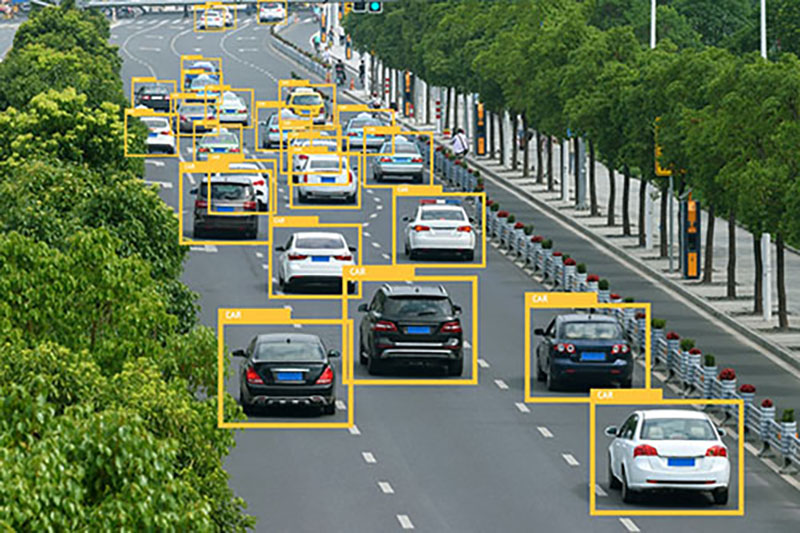
Data can be ingested from traffic cameras in several ways. The most optimal way is to analyze the video feed using computer vision ML algorithms instead of transporting thousands of video streams to the cloud and then running ML algorithms there. AWS released a computer vision appliance called AWS Panorama at AWS re:Invent 2020; it’s an ML appliance and software development kit (SDK) that allows you to bring computer vision to on-premises cameras to make predictions locally with high accuracy and low latency. AWS Panorama is well suited to address the use case of traffic monitoring. One AWS Panorama Appliance can ingest and analyze video streams from multiple video cameras. You can deploy a multi-object tracking ML model on the AWS Panorama Appliance to identify and track the vehicles passing by the camera. You can install AWS Panorama Appliances in sheltered cabinets in large road junctions or in cabinets by the roadside to cover a section of the road.
You can also send the inference results to AWS IoT Core to further process the data and make business decisions based on your requirements.
Because this post focuses on anomaly detection of traffic patterns, we assume that the AWS Panorama Appliance is already sending inference results to AWS IoT Core. In the subsequent sections, we focus on how the streaming data is processed from AWS IoT Core and analyzed to detect anomalies.
For more information, see AWS IoT and Building and deploying an object detection computer vision application at the edge with AWS Panorama.
Streaming data ingestion and transformation using Amazon Kinesis
Data from IoT devices is usually in the form of a continuous time series data stream. This is data that usually must be processed sequentially and incrementally on a record-by-record basis or over sliding time windows, and can be used for a variety of analytics, including correlations, aggregations, filtering, and sampling.
AWS IoT integrates with Amazon Kinesis Data Streams, which is a fully managed streaming data integration service. By default, the streaming data is available for 24 hours. This streaming data is then queried and transformed using a Kinesis data analytics application, which is built and deployed using Kinesis Data Analytics Studio. For more information, see Introducing Amazon Kinesis Data Analytics Studio – Quickly Interact with Streaming Data Using SQL, Python, or Scala.
We show you in the subsequent sections how to use Kinesis Data Analytics Studio, Kinesis Data Streams, and Amazon Kinesis Data Firehose to ingest traffic data from the IoT-powered smart cameras, transform it in real time using Flink SQL, and then deliver the data to an Amazon Simple Storage Service (Amazon S3) bucket in a custom prefix pattern that is compatible with Lookout for Metrics. It’s easy to build this data pipeline with minimal code. Also, because all the AWS services involved in the data pipeline are managed services, you can focus on enhancing functionality rather than running and maintaining infrastructure.
Anomaly detection using Lookout for Metrics
Lookout for Metrics automatically inspects and prepares the data dropped into Amazon S3 to detect anomalies with greater speed and accuracy than traditional methods used for anomaly detection. As anomalies are detected, you can provide feedback on detected anomalies to tune the results and improve accuracy over time. Lookout for Metrics makes it easy to diagnose detected anomalies by grouping anomalies that are related to the same event and sending an alert that includes a summary of the potential root cause. It also ranks anomalies in order of severity so you can prioritize your attention to what matters most to your business.
In the subsequent sections, we dive deep into configuring Amazon Kinesis services and Lookout for Metrics.
Prerequisites
To follow along and test this solution yourself, you need the following prerequisites:
- An AWS account
- The AWS Command Line Interface (AWS CLI) installed on your machine
- An AWS Panorama Appliance along with a smart camera or a MQTT message simulator that can provide data in the described JSON format
- An introductory level of knowledge of AWS IoT, AWS Glue, and Kinesis Data Analytics
Data ingestion and transformation using AWS IoT and Kinesis
We use Kinesis Data Streams to ingest the streaming data from AWS IoT Core. We create two streams: one for the source data and another for the transformed data.
The following AWS CLI command creates the input stream:
$ aws kinesis create-stream
--stream-name traffic-data-stream
--shard-count 1
--region eu-central-1
The following AWS CLI command creates the output stream:
$ aws kinesis create-stream
--stream-name processed-traffic-stream
--shard-count 1
--region eu-central-1
Let’s look at the data coming in from the AWS Panorama Appliance. You can view the inferred data from the multi-object tracking model by running a test on the AWS IoT console by providing the IoT topic where the inferences of the model are published. The data the you receive is in JSON format and shows the object detected and a unique ID for the appearance of a particular person or car in the region of interest of the camera. A snippet of the data is as follows:
{
  "person": <person id>
}
{
  "car": <car id>
}
Now we create an AWS IoT Core rule to send the incoming data from the AWS Panorama Appliance to the Kinesis data stream. We limit the data to persons and cars, and include a timestamp using the following query in the AWS IoT rule definition. Inclusion of the timestamp is mandatory for anomaly detection.
SELECT person,car,timestamp() as event_time FROM <IOT topic>We also add an action as part of the rule definition to send the data selected to the input data stream we created previously.
At this point, we have data from the AWS Panorama Appliance streaming into our traffic-data-stream stream.
Now let’s create a Kinesis Data Analytics studio to analyze the data streaming in. We create the notebook of type Apache Flink, which allows us to analyze the data using SQL. You need to either create a new AWS Glue database or use an existing one to store the table definitions for the incoming and outgoing data streams. For detailed steps for creating an Apache Zeppelin notebook, see Introducing Amazon Kinesis Data Analytics Studio – Quickly Interact with Streaming Data Using SQL, Python, or Scala or Using a Studio notebook with Kinesis Data Analytics for Apache Flink.
After we create the notebook, we create a new note and call it traffic-anomaly-data-transformer. This should provide you an interactive environment to write your code (see the following screenshot).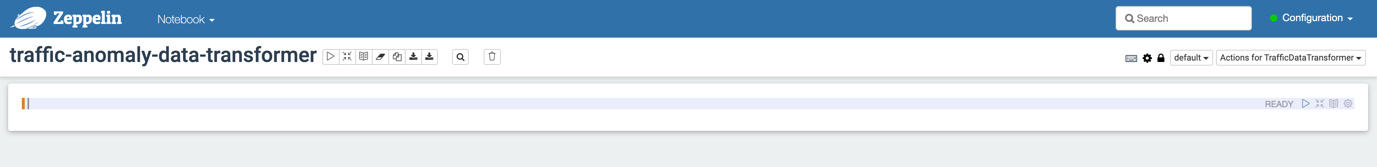
Enter the following SQL statement to create a table for the traffic data source:
%flink.ssql
create TABLE traffic_data_source (
    person FLOAT,
    car FLOAT,
    event_time AS PROCTIME()
)
PARTITIONED BY (person)
WITH (
    'connector' = 'kinesis',
    'stream' = 'traffic-data-stream',
    'aws.region' = 'eu-central-1',
    'scan.stream.initpos' = 'LATEST',
    'format' = 'json'
);
The first part of the SQL statement uses %flink.ssql to tell Apache Zeppelin to provide a stream SQL environment for the Apache Flink interpreter.
The second part describes the connector used to receive data in the table (for example, Kinesis or Kafka), the name of the stream, the AWS Region, and the overall data format of the stream (such as JSON or CSV). We can also choose the starting position to process the stream; we use LATEST to read the most recent data first.
Now let’s create a table for the traffic data destination as follows:
%flink.ssql
CREATE TABLE traffic_data_dest (
    person BIGINT,
    car    BIGINT,
    hop_time TIMESTAMP(3)
)
WITH (
'connector' = 'kinesis',
'stream' = 'processed-traffic-stream',
'aws.region' = 'eu-central-1',
'scan.stream.initpos' = 'LATEST',
'format' = 'json'
);
Next, we run the following query, which counts the number of persons and cars seen in a window of 5 minutes and inserts that data into the traffic_data_dest data stream:
%flink.ssql(type=update)
INSERT INTO traffic_data_dest
SELECT COUNT(person) AS person,COUNT(car) AS car,
       TUMBLE_END(event_time, INTERVAL '5' minute) as tumble_time
  FROM traffic_data_source
 GROUP BY TUMBLE(event_time, INTERVAL '5' minute);
In the preceding code, we use the TUMBLE_END function to record the timestamp on the record sent to the data stream as the end of the 5-minute window rather than the start of the window. This is important later in the post, when we assign custom prefix names in Amazon S3 based on time intervals—using TUMBLE_END ensures that the timestamp on the record and the prefix name are for the same 5-minute interval.
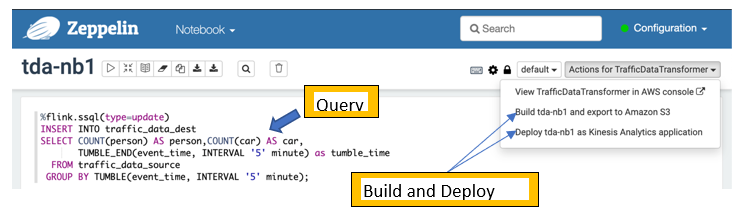
After this is successful, deploy this query as a Kinesis data analytics application. To do this, we add a new note called tda-nb1 (short for “traffic data application, notebook 1”) and copy only the preceding SQL statement that queries data from the source stream and inserts it into the destination stream. We don’t need to copy the create table SQL statements because the tables have already been created in AWS Glue.
The Apache Zeppelin notebook provides a fully automated deployment capability at the push of a button. You perform two steps: build and export the code to an S3 bucket of your choice, and deploy the code as a Kinesis data analytics application.
One important step is to update the AWS Identity and Access Management (IAM) roles of the Kinesis data analytics application in order to access the source data stream, destination data stream, and the AWS Glue Data Catalog.
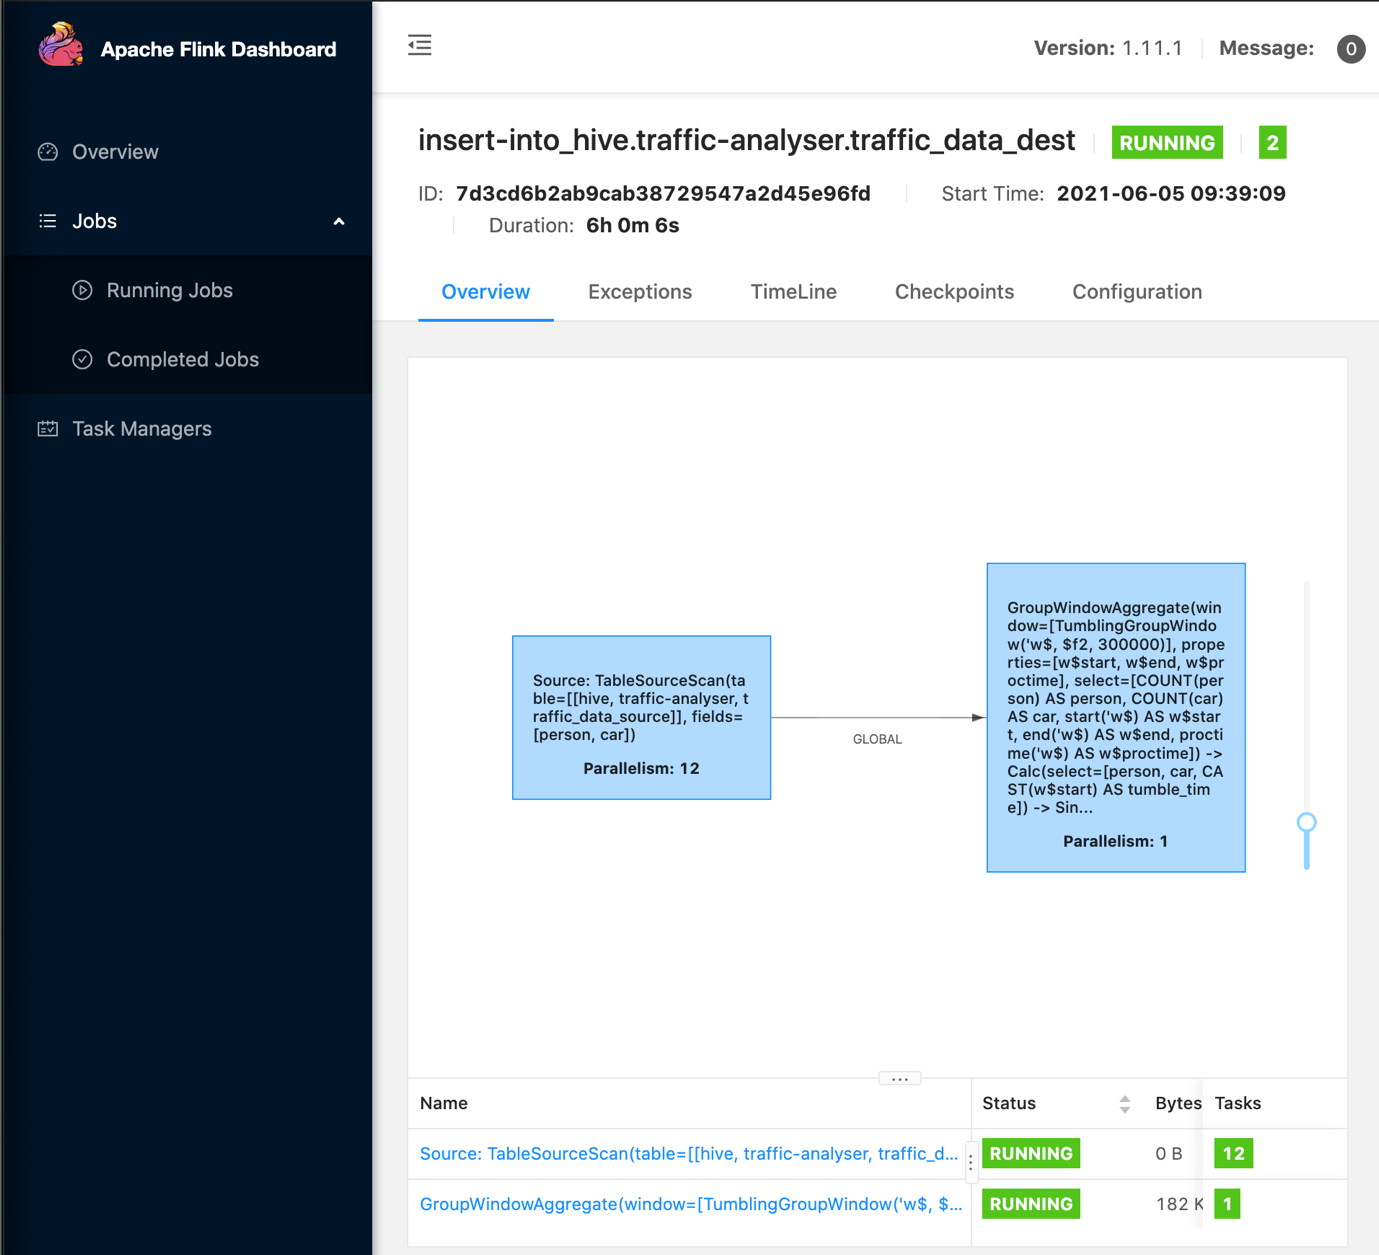
We now run the application. We should see the application graph (as in the following screenshot) showing the data flow from source to destination, and you should be able to open the Apache Flink dashboard to get more information about the application run.
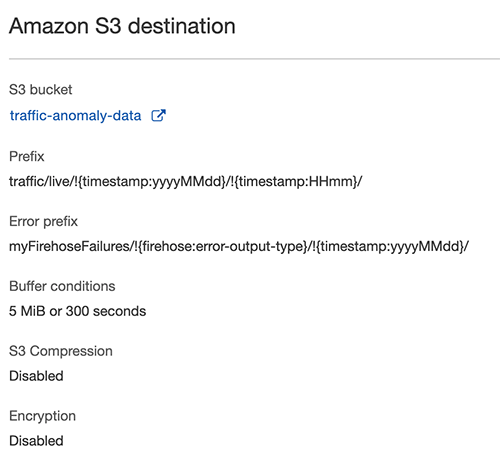
We now create a Kinesis Data Firehose delivery stream that reads from the processed-traffic-data stream (output stream) and delivers the data to Amazon S3. One of the key points to note is the configuration of the custom prefix that is configured for the Amazon S3 destination. This prefix pattern ensures that the data is created in the S3 bucket as per the prefix hierarchy expected by Lookout for Metrics. (More on this later in this post.) For more information about custom prefixes for S3 objects, see Custom Prefixes for Amazon S3 Objects.
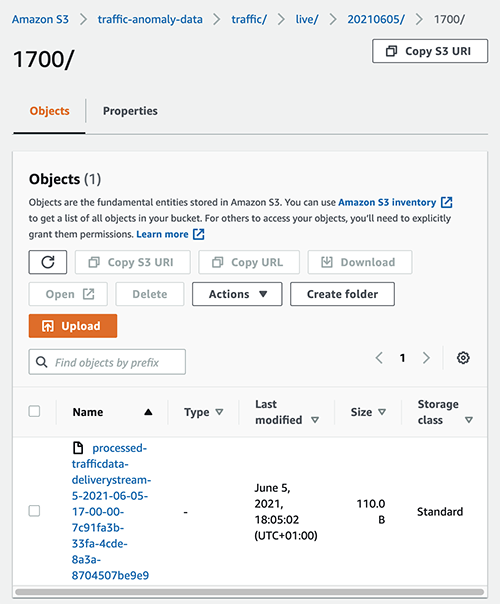
As shown in the following screenshot, the data is delivered to the specified S3 bucket in the prefix structure.
The data within one of the files is as follows:
{"person":12,"car":56,"hop_time":"2021-06-05T16:55:00"}
{"person":15,"car":121,"hop_time":"2021-06-05T17:00:00"}
The timestamps show that each file contains data for two 5-minute intervals.
With minimal code, we have now ingested the data from the camera, created a durable input stream from the ingested data, transformed the data based on the metrics we want to measure (the number of cars and persons), and stored the data in an S3 bucket based on the requirements for Lookout for Metrics.
In the following section, we take a deeper look at the constructs within Lookout for Metrics.
Lookout for Metrics deep dive
Let’s look at the terms and concepts within Lookout for Metrics, how they apply to this use case, and how easy it is to configure these concepts using the Lookout for Metrics console.
Detector
A detector is a Lookout for Metrics resource that monitors a dataset and identifies anomalies at a predefined frequency. Detectors use ML to find patterns in data and distinguish between expected variations in data and legitimate anomalies. To improve its performance, a detector learns more about your data over time.
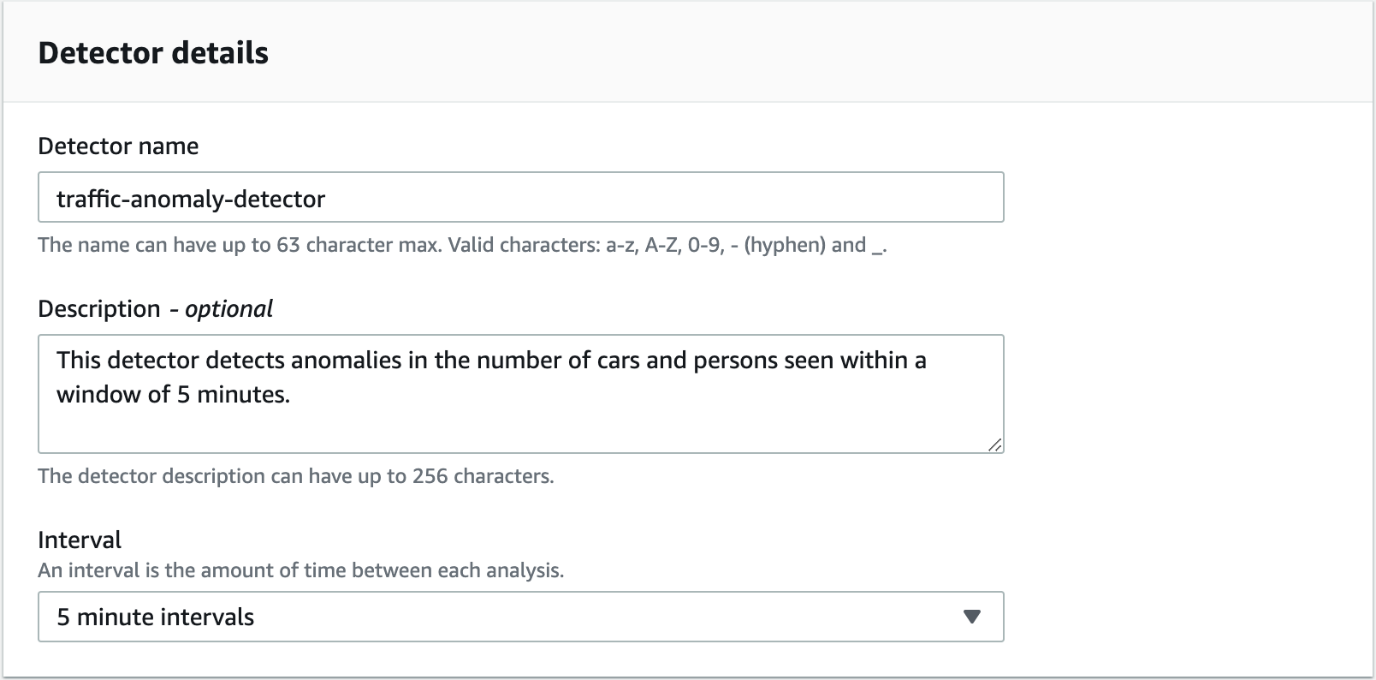
In our use case, the detector analyzes aggregated data from the camera every 5 minutes. To create the detector, navigate to the Lookout for Metrics console and choose Create Detector. Provide the name and description (optional) for the detector, along with the interval of 5 minutes.
Your data is encrypted by default with a key that AWS owns and manages for you. You can also configure if you want to use a different encryption key from the one that is used by default.
Now, let’s point this detector to the data that you want it to run anomaly detection on.
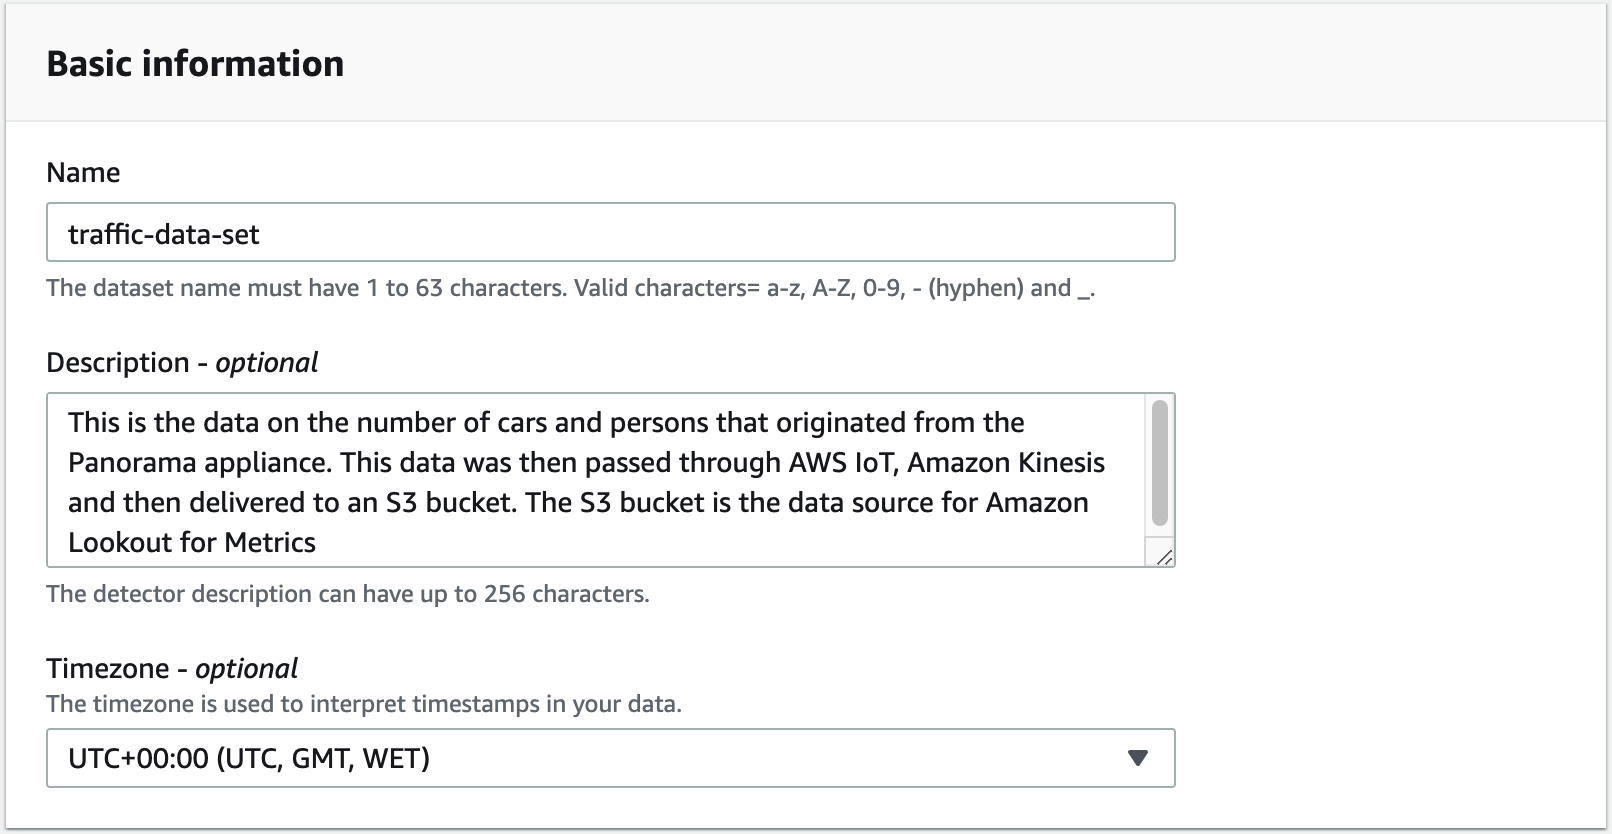
Dataset
A dataset tells the detector where to find your data and which metrics to analyze for anomalies.
We create the dataset on the Amazon Lookout for Metrics console, and provide a name (for this post, traffic-data-set), description (optional), and time zone.
In our use case, we choose Amazon S3 as our data source. With Amazon S3, you can create a detector in two modes:
- Backtest – This mode is used to find anomalies in historical data. It needs all records to be consolidated in a single file.
- Continuous – This mode is used to detect anomalies in live data. We use this mode with our use case because we want to detect anomalies as we receive traffic data from the roadside camera. The rest of this post talks about configuring continuous mode.
The path where the live data lands every 5 minutes is configured. As explained in the data ingestion and transformation section, the data is stored in the following folder structure.
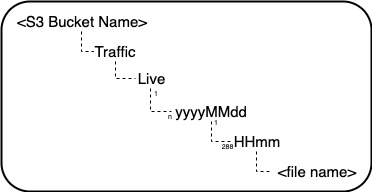
The details of the S3 prefix path and the folder structure is configured as shown in the following screenshot.
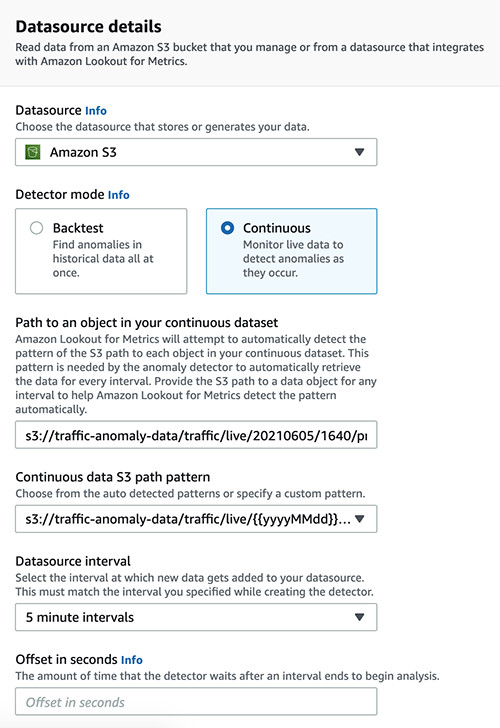
If there is a delay in the data ingestion into Amazon S3, you can define an offset in seconds that defines the time the detector waits before it runs the anomaly analysis for a particular interval.
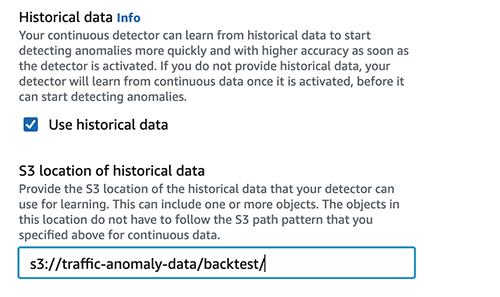
Also, if you have historical data from which the detector can learn patterns, you can provide it during this configuration. The data here is expected to be in the same format that you use to perform a backtest. Providing historical data speeds up the ML model training process. If this isn’t available, the continuous detector waits for sufficient data to be available before making inferences.
You can specify additional configurations to help Lookout for Metrics understand the format of the data that you are analyzing. Also, you must specify the IAM role that is used by Lookout for Metrics to access the data source.
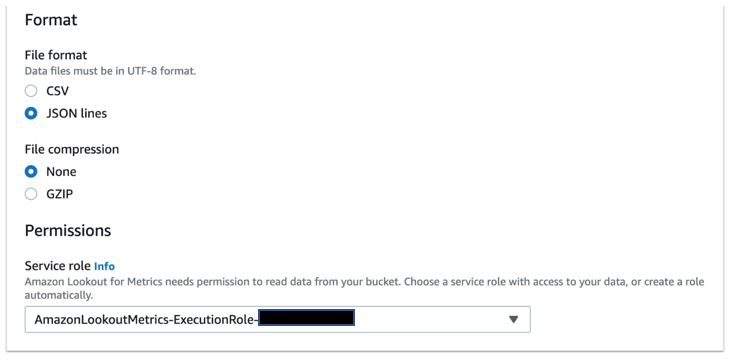
At this point, Lookout for Metrics accesses the data source and validates whether it can parse the data. If the parsing is successful, it gives you a “Validation successful” message and takes you to the next screen, where you configure measures, dimensions, and timestamps.
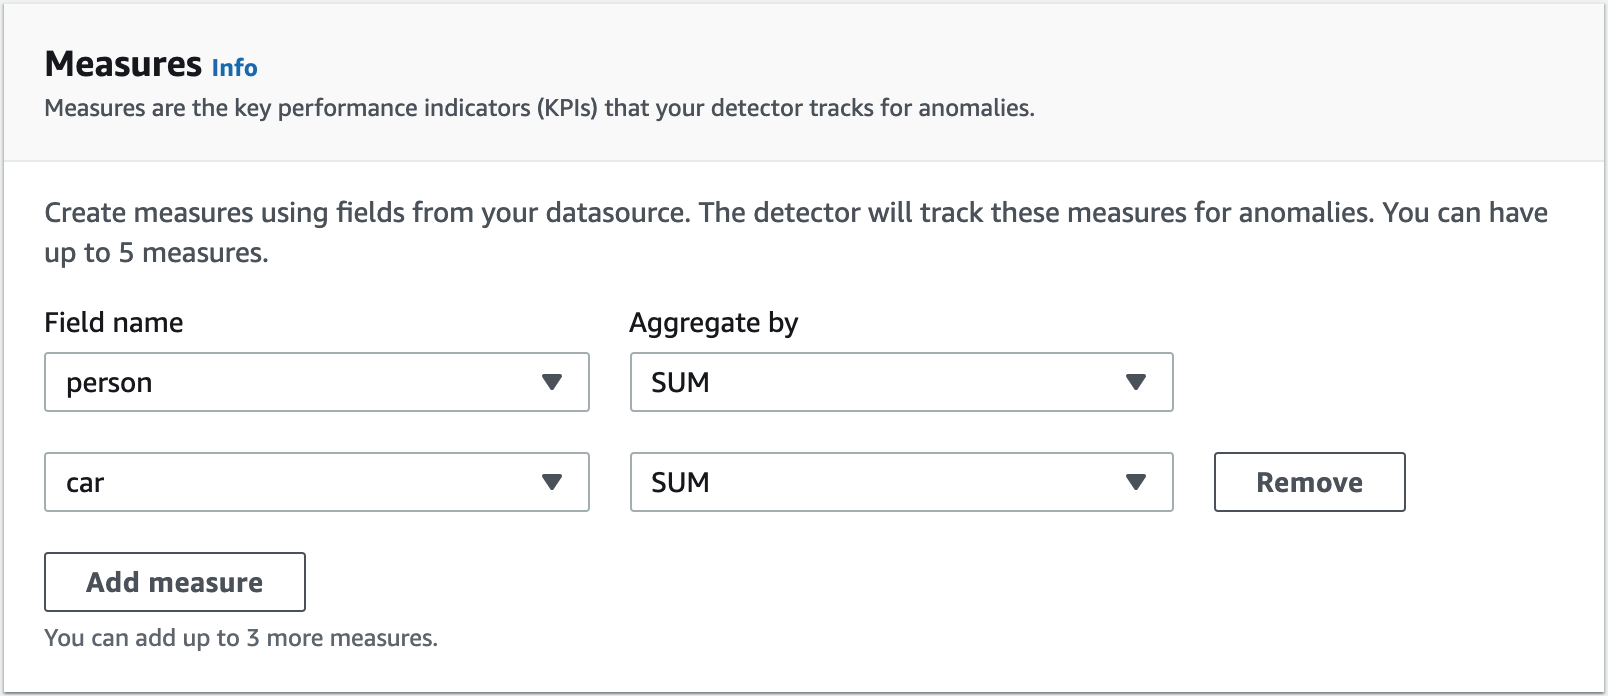
Measures, dimensions and timestamps
Measures define KPIs that you want to track anomalies for. You can add up to five measures per detector. The fields that are used to create KPIs from your source data must be of numeric format. The KPIs can be currently defined by aggregating records within the time interval by doing a SUM or AVERAGE.
In our use case, we add one measure, which does the SUM of the objects seen in the 5-minute interval.
Dimensions give you the ability to slice and dice your data by defining categories or segments. This allows you to track anomalies for a subset of the whole set of data for which a particular measure is applicable.
In our use case, we have only one camera feeding data to the solution. Imagine if we had all the cameras from the city connected. Then we could use the camera ID or other metadata such as locality name as dimensions.
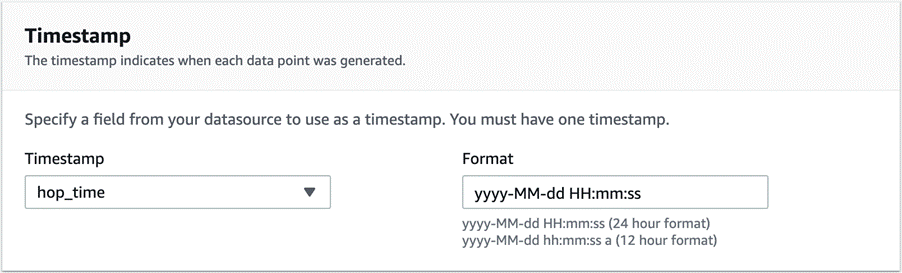
Every record in the dataset must have a timestamp. The following configuration allows you to choose the field that represents the timestamp value and also the format of the timestamp.
The next screen allows you to review all the details you have added and then save and activate the detector.
The detector then begins learning the data streaming into the data source. At this stage, the status of the detector changes to Initializing.
It’s important to note the minimum amount of data that is required before which Lookout for Metrics can start detecting anomalies. For more information about requirements and limits, see Lookout for Metrics quotas.
Fantastic! With minimal configuration, you have created your detector, pointed it at a dataset, and defined the metrics that you want Lookout for Metrics to find anomalies in.
Anomaly visualization
Lookout for Metrics provides a rich UI experience for users who want to use the AWS Management Console to analyze the anomalies being detected. It also provides the capability to query the anomalies via API.
Let’s look at an example anomaly detected from our traffic data use case.
The following screenshot shows an anomaly detected in the count of cars at the said time and date with a severity score of 100. It also shows the percentage contribution of the dimension towards the anomaly. In this case, 100% contribution comes from the car dimension.
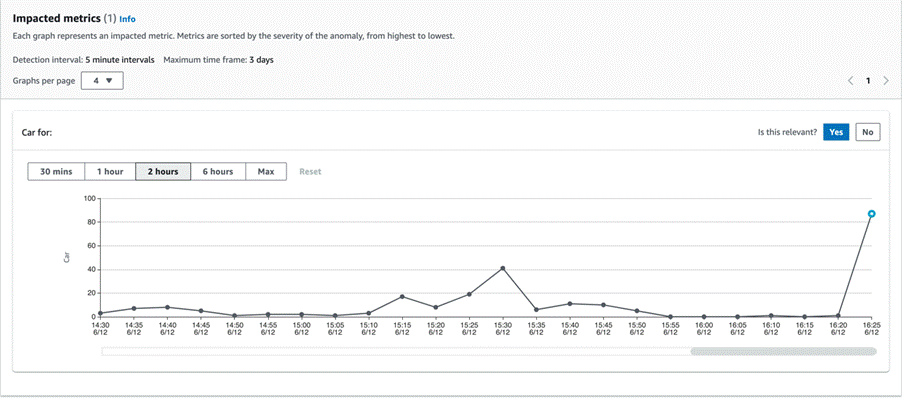
Further down the page, you also get a line graph of the metric, along with the ability to view the metric data across time periods of the previous 30 minutes, 1 hour, 2 hours, 6 hours, or the maximum number of intervals. The anomaly is highlighted in blue on the graph.
As the service detects anomalies, it also allows you to provide human feedback to specify whether the detected anomaly is relevant. In our scenario, because the number of cars suddenly increased to 87 from 1, it was highlighted as an anomaly as compared to previous data, and we confirmed that by choosing Yes.
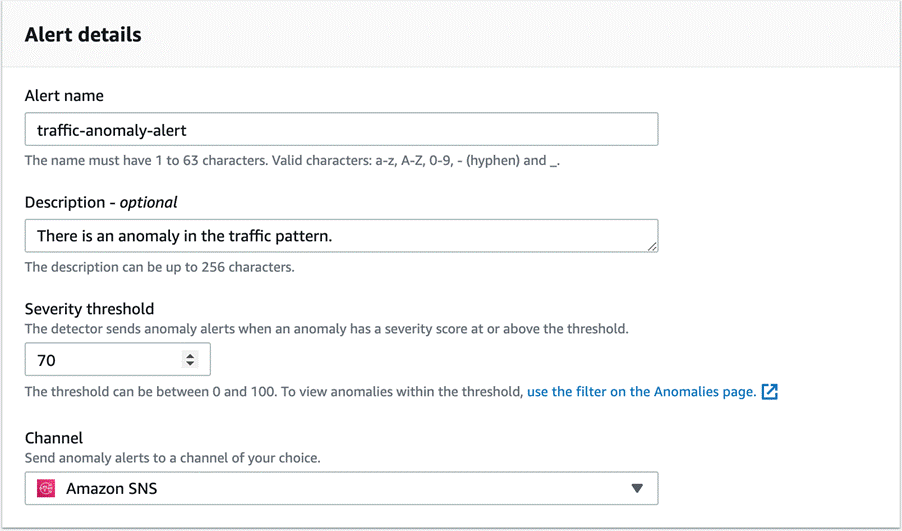
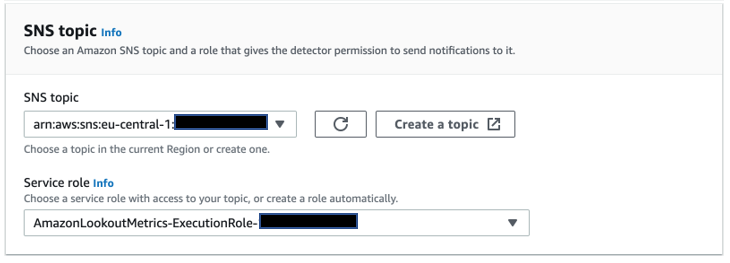
Alerts
Lookout for Metrics allows you to send alerts using a variety of channels. You can configure the anomaly severity score threshold at which the alerts must be triggered.
In our use case, we configure alerts to be sent to an Amazon Simple Notification Service (Amazon SNS) channel, which in turn sends an SMS.
You can also use an alert to trigger automations using AWS Lambda functions in order to drive API-driven operations on AWS IoT Core. You can use IoT device shadows to control display devices in order to control traffic signals or traffic lane sign boards. If a rapid action team of personnel needs to be deployed, we could imagine the alert triggering a workforce management system that selects and deploys available personnel to the site to deal with the emergency.
Conclusion
Cities have the opportunity to derive insights from traffic management systems and make better decisions to improve public safety, make daily commutes less frustrating, and improve the overall quality of life of its residents.
In this post, we showed you how to use Lookout for Metrics and Kinesis to remove the undifferentiated heavy lifting involved in managing the end-to-end lifecycle of building ML-powered anomaly detection applications.
We believe that this solution will truly help you accelerate your ability to find anomalies in key business metrics and allow you focus your efforts on growing and improving your business.
We encourage you to learn more by visiting the Amazon Lookout for Metrics Developer Guide and Using a Studio notebook with Kinesis Data Analytics for Apache Flink, and also try out the end-to-end solution enabled by these services with the dataset relevant to your business KPIs.
We’re eager and excited to see what you’ll build using Amazon Lookout for Metrics and Amazon Kinesis Data Analytics Studio in the context of smart cities and beyond.
About the Authors
 Ajay Ravindranathan is a Sr Partner Solutions Architect with Amazon Web Services, and is passionate about helping customers build modern applications using AWS services. Ajay has a keen interest in building AI/ML powered cloud-native products that can help telecommunications service providers on their digital transformation journey.
 Bala KP is a Sr Partner Solutions Architect with Amazon Web Services. He works with partners and customers in the financial services and insurance domain to provide them with architecture guidance on building scalable and secure applications in AWS.