SAP and NVIDIA Create AI for ‘The Most Valuable Language,’ CEOs Unveil at Sapphire Orlando

SAP and NVIDIA Create AI for ‘The Most Valuable Language,’ CEOs Unveil at Sapphire Orlando

German enterprise cloud leader SAP is harnessing generative AI and industrial digital twins in the development of next-generation enterprise applications for its customers.

At SAP’s Sapphire event today, in Orlando, Florida, NVIDIA and the enterprise software company unveiled generative AI efforts featuring NVIDIA AI Enterprise software to offer two new capabilities for Joule, SAP’s generative AI copilot — SAP Consulting capabilities and ABAP Developer capabilities.

To help streamline the selling and buying process of complex products, SAP is also integrating NVIDIA Omniverse Cloud application programming interfaces, or APIs, into its Intelligent Product Recommendation solution. This will enable salespeople to visualize 3D product digital twins directly in SAP Intelligent Product Recommendation. NVIDIA Omniverse, based on OpenUSD, lets users simulate how configurable equipment might physically fit into and operate in the real world, saving time and costs while improving efficiency and safety.

These new advances come after the companies announced AI-focused collaborations at GTC in March.

“One of the most amazing breakthroughs in large language models and generative AI is that we’ve managed to learn the representation of almost any language,” said NVIDIA founder and CEO Jensen Huang, speaking by video link at the SAP Sapphire conference. “In our company, the most valuable language is CUDA. At SAP, the most valuable language is ABAP.”

“We’ve created some amazing generative APIs that understand the language of SAP, that understand the language of supply chains, that understand the language of ERP systems, so that we have a specialist, an agent and AI to help us to do all the things that we want to do to manage our business,” said SAP CEO Christian Klein.

NVIDIA AI Helps to Accelerate Joule, SAP’s Generative AI Copilot  

Joule, which is embedded across SAP’s portfolio of cloud solutions and applications, allows users to work faster while gaining smarter insights grounded in business data. At SAP Sapphire, the company announced a new consulting capability for Joule leveraging NVIDIA NeMo Retriever microservices.

NVIDIA NeMo Retriever connects AI applications with proprietary data to drive retrieval-augmented generation, or RAG. This brings domain expertise and knowledge of the business to LLMs so that AI copilots and coding assistants can give more accurate and relevant responses.

With the new AI-powered SAP Consulting capabilities — connected to 200,000 pages of SAP learning content, help, product documentation, and community content — tens of thousands of SAP consultants can be more productive, while accessing the latest product and process details when working with end customers. Joule’s SAP Consulting capabilities are already being previewed by internal SAP consultants as well as leading system integrators.

NVIDIA-powered AI is also coming to assist the more than 5 million developers using SAP’s ABAP programming language. SAP’s custom model was trained on over 250 million lines of proprietary ABAP code using NVIDIA HGX H100 systems and will be deployed using NVIDIA NIM inference microservices for optimal runtime performance. Joule’s ABAP Developer capabilities can help developers generate, complete and explain code as well as create software unit tests, which allows them to spend more time building and deploying features rather than manually writing lines of code.

As announced at GTC 2024, this NVIDIA AI Enterprise software, including NeMo and NIM, is expected to be accessible in the generative AI hub in SAP AI Core for developers and customers to leverage.

Omniverse to Help Optimize Sales Processes for Complex Products

Using NVIDIA AI and Omniverse, SAP is building the future of connectivity and is reimagining key business processes, including the sales process for manufacturers.

SAP Intelligent Product Recommendation software utilizes generative AI to analyze requirements described in natural language and generate recommendations for the most suitable configurable products. With Omniverse Cloud APIs integrated with the application, users can then interact with physically accurate models of complex products in a digital twin of the environment where they will be installed. This lets sales teams generate quotes more quickly and helps sales representatives recommend the best solutions for their customers’ needs.

In addition, SAP Intelligent Product Recommendation can use NVIDIA AI to analyze text from multiple sources, including emails and notes captured in customer relationship management software or from product specifications documents. This lets the software generate  recommendations based on key, custom parameters, such as power requirements, lead times and expected carbon footprint.

Watch the replay of the Sapphire Orlando keynote here.

Read More

NVIDIA and Cisco Weave Fabric for Generative AI

NVIDIA and Cisco Weave Fabric for Generative AI

Building and deploying AI applications at scale requires a new class of computing infrastructure — one that can handle the massive amounts of data, compute power and networking bandwidth needed by generative AI models.

To better ensure these models perform optimally and efficiently, NVIDIA is teaming with Cisco to enable enterprise generative AI infrastructure.

Cisco’s new Nexus HyperFabric AI cluster solution, developed in collaboration with NVIDIA, provides a path for enterprises to operationalize generative AI. Cisco HyperFabric is an enterprise-ready, end-to-end infrastructure solution to scale generative AI workloads. It combines NVIDIA accelerated computing and AI software with Cisco AI-native networking and a robust VAST Data Platform.

“Enterprise applications are transforming into generative AI applications, significantly increasing data processing requirements and overall infrastructure complexity,” said Kevin Wollenweber, senior vice president and general manager of data center and provider connectivity at Cisco. “Together, Cisco and NVIDIA are advancing HyperFabric to advance generative AI for the world’s enterprises so they can use their data and domain expertise to transform productivity and insight.”

Powering a Full-Stack AI Fabric

Foundational to the solution are NVIDIA Tensor Core GPUs, which provide the accelerated computing needed to process massive datasets. The solution utilizes NVIDIA AI Enterprise, a cloud-native software platform that acts as the operating system for enterprise AI. NVIDIA AI Enterprise streamlines the development and deployment of production-grade AI copilots and other generative AI applications, ensuring optimized performance, security and application programming interface stability.

Included with NVIDIA AI Enterprise, NVIDIA NIM inference microservices accelerate the deployment of foundation models while ensuring data security. NIM microservices are designed to bridge the gap between complex AI development and enterprise operational needs. As organizations across various industries embark on their AI journeys, the combination of NVIDIA NIM and the Cisco Nexus HyperFabric AI cluster supports the entire process, from ideation to development and deployment of production-scale AI applications.

The Cisco Nexus HyperFabric AI cluster solution integrates NVIDIA Tensor Core GPUs and NVIDIA BlueField-3 SuperNICs and DPUs to enhance system performance and security. The SuperNICs offer advanced network capabilities, ensuring seamless, high-speed connectivity across the infrastructure. BlueField-3 DPUs offload, accelerate and isolate the infrastructure services, creating a more efficient AI solution.

BlueField-3 DPUs can also run security services like the Cisco Hypershield solution. It enables an AI-native, hyperdistributed security architecture, where security shifts closer to the workloads needing protection. Cisco Hypershield is another notable area of collaboration between the companies, focusing on creating AI-powered security solutions.

Join NVIDIA at Cisco Live

Learn more about how Cisco and NVIDIA power generative AI at Cisco Live — running through June 6 in Las Vegas — where the companies will showcase NVIDIA AI technologies at the Cisco AI Hub and share best practices for enterprises to get started with AI.

Attend these sessions to discover how to accelerate generative AI with NVIDIA, Cisco and other ecosystem partners:

  • Keynote Deep Dive: “Harness a Bold New Era: Transform Data Center and Service Provider Connectivity” with NVIDIA’s Kevin Deierling and Cisco’s Jonathan Davidson, Kevin Wollenweber, Jeremy Foster and Bill Gartner — Wednesday, June 5, from 1-2 p.m. PT
  • AI Hub Theater Presentation: “Accelerate, Deploy Generative AI Anywhere With NVIDIA Inference Microservices” with Marty Jain, vice president of sales and business development at NVIDIA — Tuesday, June 4, from 2:15-2:45 p.m. PT
  • WWT AI Hub Booth: Thought leadership interview with NVIDIA’s Jain and WWT Vice President of Cloud, Infrastructure and AI Solutions Neil Anderson — Wednesday, June 5, from 10-11 a.m. PT
  • NetApp Theater: “Accelerating Gen AI With NVIDIA Inference Microservices on FlexPod” with Sicong Ji, strategic platforms and solutions lead at NVIDIA — Wednesday, June 5, from 1:30-1:40 p.m. PT
  • Pure Storage Theater: “Accelerating Gen AI With NVIDIA Inference Microservices on FlashStack” with Joslyn Shakur, sales alliance manager at NVIDIA — Wednesday, June 5, from 2-2:10 p.m. PT ​

Sign up for generative AI news to stay up to date on the latest breakthroughs, developments and technologies.

Read More

Ready, Set, Contribute: PyTorch Docathon Kickoff H1 2024

The PyTorch Docathon is now live! This event is dedicated to enhancing the quality of the PyTorch documentation with the invaluable assistance of our community. Our hope with this Docathon is to simplify the process for new users to get started with PyTorch, guide them in effectively utilizing its features, and ultimately expedite the transition from research to production in machine learning.

JOIN THE KICK-OFF EVENT
on June 4th at 10 AM PT

Event Details

  • June 4: Kick-off – join a 30-minutes livestream kick off event on Discord on June 4th at 10 AM PT here. If you can’t join the kick-off event, watch our welcome video on YouTube
  • June 4-June 16: Submissions and Feedback
  • June 17-18: Final Reviews
  • June 20: Winner Announcements

How to Contribute

Review the Docathon H1 2024 issue in the pytorch/pytorch or pytorch/tutorials repo that contain all the necessary information on participating in the Docathon and highlights the specific issues to work on. Remember to sign the CLA in your first PR and adhere to the Code of Conduct guidelines.

Read the Code of Conduct

Take a moment to review the PyTorch code of conduct found here. This document outlines the expectations for behavior and communication within our team, and it is important that everyone is aware of and adheres to these guidelines.

Join our Discord

This channel serves as the main communication hub during the Docathon. You can join it using by using this link:

JOIN DISCORD SERVER

When you first join the server, you will have limited access. To gain full access to our Discord PyTorch Docathon Channel:

  1. Enter the server and navigate to the #self-roles channel.
  2. In the #self-roles channel, click on the ‘Join Docathon’ button in the relevant post to assign yourself the docathon role.
  3. After assigning the role, you will see the ‘PyTorch Docathon H1 2024 Section’ in the left-hand menu for discussions.
  4. To help prevent spam we are asking that you change your server username to your GitHub username or the email username you registered with.

Explore the GitHub Issues

All the Docathon issues are posted on GitHub. You can find them by the docathon-h1-2024 label in the following participating repositories:

The issues are categorized into three levels of difficulty: easy, medium, and advanced. If this is your first time contributing to PyTorch, we recommend starting with an issue at the easy level.

Prizes for Winners

We will have a leaderboard throughout the duration of the Docathon. The more you contribute, the higher you’ll get on the board! Our top three winners will get free admission to PyTorch Conference 2024.

Thank you to our Partners

This year, we’re thrilled to work with the PyTorch Teams at Meta, Google and Snowflake to help us put on a successful event. We’ll also be at Snowflake Dev Day on June 6 where you can hear from Meta’s Matthias Reso, and check out our PyTorch booth.

Happy contributing!

Read More

Entity Disambiguation via Fusion Entity Decoding

Entity disambiguation (ED), which links the mentions of ambiguous entities to their referent entities in a knowledge base, serves as a core component in entity linking (EL). Existing generative approaches demonstrate improved accuracy compared to classification approaches under the standardized ZELDA benchmark. Nevertheless, generative approaches suffer from the need for large-scale pre-training and inefficient generation. Most importantly, entity descriptions, which could contain crucial information to distinguish similar entities from each other, are often overlooked. We propose an…Apple Machine Learning Research

AGRaME: Any Granularity Ranking with Multi-Vector Embeddings

Ranking is a fundamental and popular problem in search. However, existing ranking algorithms usually restrict the granularity of ranking to full passages or require a specific dense index for each desired level of granularity. Such lack of flexibility in granularity negatively affects many applications that can benefit from more granular ranking, such as sentence-level ranking for open-domain question-answering, or proposition-level ranking for attribution. In this work, we introduce the idea of any-granularity ranking which leverages multi-vector approaches to rank at varying levels of…Apple Machine Learning Research

Implement serverless semantic search of image and live video with Amazon Titan Multimodal Embeddings

Implement serverless semantic search of image and live video with Amazon Titan Multimodal Embeddings

In today’s data-driven world, industries across various sectors are accumulating massive amounts of video data through cameras installed in their warehouses, clinics, roads, metro stations, stores, factories, or even private facilities. This video data holds immense potential for analysis and monitoring of incidents that may occur in these locations. From fire hazards to broken equipment, theft, or accidents, the ability to analyze and understand this video data can lead to significant improvements in safety, efficiency, and profitability for businesses and individuals.

This data allows for the derivation of valuable insights when combined with a searchable index. However,traditional video analysis methods often rely on manual, labor-intensive processes, making it challenging to scale and efficient. In this post, we introduce semantic search, a technique to find incidents in videos based on natural language descriptions of events that occurred in the video. For example, you could search for “fire in the warehouse” or “broken glass on the floor.” This is where multi-modal embeddings come into play. We introduce the use of the Amazon Titan Multimodal Embeddings model, which can map visual as well as textual data into the same semantic space, allowing you to use textual description and find images containing that semantic meaning. This semantic search technique allows you to analyze and understand frames from video data more effectively.

We walk you through constructing a scalable, serverless, end-to-end semantic search pipeline for surveillance footage with Amazon Kinesis Video Streams, Amazon Titan Multimodal Embeddings on Amazon Bedrock, and Amazon OpenSearch Service. Kinesis Video Streams makes it straightforward to securely stream video from connected devices to AWS for analytics, machine learning (ML), playback, and other processing. It enables real-time video ingestion, storage, encoding, and streaming across devices. Amazon Bedrock is a fully managed service that provides access to a range of high-performing foundation models from leading AI companies through a single API. It offers the capabilities needed to build generative AI applications with security, privacy, and responsible AI. Amazon Titan Multimodal Embeddings, available through Amazon Bedrock, enables more accurate and contextually relevant multimodal search. It processes and generates information from distinct data types like text and images. You can submit text, images, or a combination of both as input to use the model’s understanding of multimodal content. OpenSearch Service is a fully managed service that makes it straightforward to deploy, scale, and operate OpenSearch. OpenSearch Service allows you to store vectors and other data types in an index, and offers sub second query latency even when searching billions of vectors and measuring the semantical relatedness, which we use in this post.

We discuss how to balance functionality, accuracy, and budget. We include sample code snippets and a GitHub repo so you can start experimenting with building your own prototype semantic search solution.

Overview of solution

The solution consists of three components:

  • First, you extract frames of a live stream with the help of Kinesis Video Streams (you can optionally extract frames of an uploaded video file as well using an AWS Lambda function). These frames can be stored in an Amazon Simple Storage Service (Amazon S3) bucket as files for later processing, retrieval, and analysis.
  • In the second component, you generate an embedding of the frame using Amazon Titan Multimodal Embeddings. You store the reference (an S3 URI) to the actual frame and video file, and the vector embedding of the frame in OpenSearch Service.
  • Third, you accept a textual input from the user to create an embedding using the same model and use the API provided to query your OpenSearch Service index for images using OpenSearch’s intelligent vector search capabilities to find images that are semantically similar to your text based on the embeddings generated by the Amazon Titan Multimodal Embeddings model.

This solution uses Kinesis Video Streams to handle any volume of streaming video data without consumers provisioning or managing any servers. Kinesis Video Streams automatically extracts images from video data in real time and delivers the images to a specified S3 bucket. Alternatively, you can use a serverless Lambda function to extract frames of a stored video file with the Python OpenCV library.

The second component converts these extracted frames into vector embeddings directly by calling the Amazon Bedrock API with Amazon Titan Multimodal Embeddings.

Embeddings are a vector representation of your data that capture semantic meaning. Generating embeddings of text and images using the same model helps you measure the distance between vectors to find semantic similarities. For example, you can embed all image metadata and additional text descriptions into the same vector space. Close vectors indicate that the images and text are semantically related. This allows for semantic image search—given a text description, you can find relevant images by retrieving those with the most similar embeddings, as represented in the following visualization.

Visualisation of text and image embeddings

Starting December 2023, you can use the Amazon Titan Multimodal Embeddings model for use cases like searching images by text, image, or a combination of text and image. It produces 1,024-dimension vectors (by default), enabling highly accurate and fast search capabilities. You can also configure smaller vector sizes to optimize for cost vs. accuracy. For more information, refer to Amazon Titan Multimodal Embeddings G1 model.

The following diagram visualizes the conversion of a picture to a vector representation. You split the video files into frames and save them in a S3 bucket (Step 1). The Amazon Titan Multimodal Embeddings model converts these frames into vector embeddings (Step 2). You store the embeddings of the video frame as a k-nearest neighbors (k-NN) vector in your OpenSearch Service index with the reference to the video clip and the frame in the S3 bucket itself (Step 3). You can add additional descriptions in an additional field.

Conversion of a picture to a vector representation

The following diagram visualizes the semantic search with natural language processing (NLP). The third component allows you to submit a query in natural language (Step 1) for specific moments or actions in a video, returning a list of references to frames that are semantically similar to the query. The Amazon Titan MultimodalEmbeddings model (Step 2) converts the submitted text query into a vector embedding (Step 3). You use this embedding to look up the most similar embeddings (Step 4). The stored references in the returned results are used to retrieve the frames and video clip to the UI for replay (Step 5).

semantic search with natural language processing

The following diagram shows our solution architecture.

Solution Architecture

The workflow consists of the following steps:

  1. You stream live video to Kinesis Video Streams. Alternatively, upload existing video clips to an S3 bucket.
  2. Kinesis Video Streams extracts frames from the live video to an S3 bucket. Alternatively, a Lambda function extracts frames of the uploaded video clips.
  3. Another Lambda function collects the frames and generates an embedding with Amazon Bedrock.
  4. The Lambda function inserts the reference to the image and video clip together with the embedding as a k-NN vector into an OpenSearch Service index.
  5. You submit a query prompt to the UI.
  6. A new Lambda function converts the query to a vector embedding with Amazon Bedrock.
  7. The Lambda function searches the OpenSearch Service image index for any frames matching the query and the k-NN for the vector using cosine similarity and returns a list of frames.
  8. The UI displays the frames and video clips by retrieving the assets from Kinesis Video Streams using the saved references of the returned results. Alternatively, the video clips are retrieved from the S3 bucket.

This solution was created with AWS Amplify. Amplify is a development framework and hosting service that assists frontend web and mobile developers in building secure and scalable applications with AWS tools quickly and efficiently.

Optimize for functionality, accuracy, and cost

Let’s conduct an analysis of this proposed solution architecture to determine opportunities for enhancing functionality, improving accuracy, and reducing costs.

Starting with the ingestion layer, refer to Design considerations for cost-effective video surveillance platforms with AWS IoT for Smart Homes to learn more about cost-effective ingestion into Kinesis Video Streams.

The extraction of video frames in this solution is configured using Amazon S3 delivery with Kinesis Video Streams. A key trade-off to evaluate is determining the optimal frame rate and resolution to meet the use case requirements balanced with overall system resource utilization. The frame extraction rate can range from as high as five frames per second to as low as one frame every 20 seconds. The choice of frame rate can be driven by the business use case, which directly impacts embedding generation and storage in downstream services like Amazon Bedrock, Lambda, Amazon S3, and the Amazon S3 delivery feature, as well as searching within the vector database. Even when uploading pre-recorded videos to Amazon S3, thoughtful consideration should still be given to selecting an appropriate frame extraction rate and resolution. Tuning these parameters allows you to balance your use case accuracy needs with consumption of the mentioned AWS services.

The Amazon Titan Multimodal Embeddings model outputs a vector representation with an default embedding length of 1,024 from the input data. This representation carries the semantic meaning of the input and is best to compare with other vectors for optimal similarity. For best performance, it’s recommended to use the default embedding length, but it can have direct impact on performance and storage costs. To increase performance and reduce costs in your production environment, alternate embedding lengths can be explored, such as 256 and 384. Reducing the embedding length also means losing some of the semantic context, which has a direct impact on accuracy, but improves the overall speed and optimizes the storage costs.

OpenSearch Service offers on-demand, reserved, and serverless pricing options with general purpose or storage optimized machine types to fit different workloads. To optimize costs, you should select reserved instances to cover your production workload base, and use on-demand, serverless, and convertible reservations to handle spikes and non-production loads. For lower-demand production workloads, a cost-friendly alternate option is using pgvector with Amazon Aurora PostgreSQL Serverless, which offers lower base consumption units as compared to Amazon OpenSearch Serverless, thereby lowering the cost.

Determining the optimal value of K in the k-NN algorithm for vector similarity search is significant for balancing accuracy, performance, and cost. A larger K value generally increases accuracy by considering more neighboring vectors, but comes at the expense of higher computational complexity and cost. Conversely, a smaller K leads to faster search times and lower costs, but may lower result quality. When using the k-NN algorithm with OpenSearch Service, it’s essential to carefully evaluate the K parameter based on your application’s priorities—starting with smaller values like K=5 or 10, then iteratively increasing K if higher accuracy is needed.

As part of the solution, we recommend Lambda as the serverless compute option to process frames. With Lambda, you can run code for virtually any type of application or backend service—all with zero administration. Lambda takes care of everything required to run and scale your code with high availability.

With high amounts of video data, you should consider binpacking your frame processing tasks and running a batch computing job to access a large amount of compute resources. The combination of AWS Batch and Amazon Elastic Container Service (Amazon ECS) can efficiently provision resources in response to jobs submitted in order to eliminate capacity constraints, reduce compute costs, and deliver results quickly.

You will incur costs when deploying the GitHub repo in your account. When you are finished examining the example, follow the steps in the Clean up section later in this post to delete the infrastructure and stop incurring charges.

Refer to the README file in the repository to understand the building blocks of the solution in detail.

Prerequisites

For this walkthrough, you should have the following prerequisites:

Deploy the Amplify application

Complete the following steps to deploy the Amplify application:

  1. Clone the repository to your local disk with the following command:
    git clone https://github.com/aws-samples/Serverless-Semantic-Video-Search-Vector-Database-and-a-Multi-Modal-Generative-Al-Embeddings-Model

  2. Change the directory to the cloned repository.
  3. Initialize the Amplify application:
    amplify init

  4. Clean install the dependencies of the web application:
    npm ci

  5. Create the infrastructure in your AWS account:
    amplify push

  6. Run the web application in your local environment:
    npm run dev

Create an application account

Complete the following steps to create an account in the application:

  1. Open the web application with the stated URL in your terminal.
  2. Enter a user name, password, and email address.
  3. Confirm your email address with the code sent to it.

Upload files from your computer

Complete the following steps to upload image and video files stored locally:

  1. Choose File Upload in the navigation pane.
  2. Choose Choose files.
  3. Select the images or videos from your local drive.
  4. Choose Upload Files.

Upload files from a webcam

Complete the following steps to upload images and videos from a webcam:

  1. Choose Webcam Upload in the navigation pane.
  2. Choose Allow when asked for permissions to access your webcam.
  3. Choose to either upload a single captured image or a captured video:
    1. Choose Capture Image and Upload Image to upload a single image from your webcam.
    2. Choose Start Video Capture, Stop Video Capture, and finally
      Upload Video to upload a video from your webcam.

Search videos

Complete the following steps to search the files and videos you uploaded.

  1. Choose Search in the navigation pane.
  2. Enter your prompt in the Search Videos text field. For example, we ask “Show me a person with a golden ring.”
  3. Lower the confidence parameter closer to 0 if you see fewer results than you were originally expecting.

The following screenshot shows an example of our results.

Example of results

Clean up

Complete the following steps to clean up your resources:

  1. Open a terminal in the directory of your locally cloned repository.
  2. Run the following command to delete the cloud and local resources:
    amplify delete

Conclusion

A multi-modal embeddings model has the potential to revolutionize the way industries analyze incidents captured with videos. AWS services and tools can help industries unlock the full potential of their video data and improve their safety, efficiency, and profitability. As the amount of video data continues to grow, the use of multi-modal embeddings will become increasingly important for industries looking to stay ahead of the curve. As innovations like Amazon Titan foundation models continue maturing, they will reduce the barriers to use advanced ML and simplify the process of understanding data in context. To stay updated with state-of-the-art functionality and use cases, refer to the following resources:


About the Authors

Thorben Sanktjohanser is a Solutions Architect at Amazon Web Services supporting media and entertainment companies on their cloud journey with his expertise. He is passionate about IoT, AI/ML and building smart home devices. Almost every part of his home is automated, from light bulbs and blinds to vacuum cleaning and mopping.

Talha Chattha is an AI/ML Specialist Solutions Architect at Amazon Web Services, based in Stockholm, serving key customers across EMEA. Talha holds a deep passion for generative AI technologies. He works tirelessly to deliver innovative, scalable, and valuable ML solutions in the space of large language models and foundation models for his customers. When not shaping the future of AI, he explores scenic European landscapes and delicious cuisines.

Victor Wang is a Sr. Solutions Architect at Amazon Web Services, based in San Francisco, CA, supporting innovative healthcare startups. Victor has spent 6 years at Amazon; previous roles include software developer for AWS Site-to-Site VPN, AWS ProServe Consultant for Public Sector Partners, and Technical Program Manager for Amazon RDS for MySQL. His passion is learning new technologies and traveling the world. Victor has flown over a million miles and plans to continue his eternal journey of exploration.

Akshay Singhal is a Sr. Technical Account Manager at Amazon Web Services, based in San Francisco Bay Area, supporting enterprise support customers focusing on the security ISV segment. He provides technical guidance for customers to implement AWS solutions, with expertise spanning serverless architectures and cost-optimization. Outside of work, Akshay enjoys traveling, Formula 1, making short movies, and exploring new cuisines.

Read More

Prioritizing employee well-being: An innovative approach with generative AI and Amazon SageMaker Canvas

Prioritizing employee well-being: An innovative approach with generative AI and Amazon SageMaker Canvas

In today’s fast-paced corporate landscape, employee mental health has become a crucial aspect that organizations can no longer overlook. Many companies recognize that their greatest asset lies in their dedicated workforce, and each employee plays a vital role in collective success. As such, promoting employee well-being by creating a safe, inclusive, and supportive environment is of utmost importance.

However, quantifying and assessing mental health can be a daunting task. Traditional methods like employee well-being surveys or manual approaches may not always provide the most accurate or actionable insights. In this post, we explore an innovative solution that uses Amazon SageMaker Canvas for mental health assessment at the workplace.

We delve into the following topics:

  • The importance of mental health in the workplace
  • An overview of the SageMaker Canvas low-code no-code platform for building machine learning (ML) models
  • The mental health assessment model:
    • Data preparation using the chat feature
    • Training the model on SageMaker Canvas
    • Model evaluation and performance metrics
  • Deployment and integration:
    • Deploying the mental health assessment model
    • Integrating the model into workplace wellness programs or HR systems

In this post, we use a dataset from a 2014 survey that measures attitudes towards mental health and frequency of mental health disorders in the tech workplace, then we aggregate and prepare data for an ML model using Amazon SageMaker Data Wrangler for a tabular dataset on SageMaker Canvas. Then we train, build, test, and deploy the model using SageMaker Canvas, without writing any code.

Discover how SageMaker Canvas can revolutionize the way organizations approach employee mental health assessment, empowering them to create a more supportive and productive work environment. Stay tuned for insightful content that could reshape the future of workplace well-being.

Importance of mental health

Maintaining good mental health in the workplace is crucial for both employees and employers. In today’s fast-paced and demanding work environment, the mental well-being of employees can have a significant impact on productivity, job satisfaction, and overall company success. At Amazon, where innovation and customer obsession are at the core of our values, we understand the importance of fostering a mentally healthy workforce.

By prioritizing the mental well-being of our employees, we create an environment where they can thrive and contribute their best. This helps us deliver exceptional products and services. Amazon supports mental health by providing access to resources and support services. All U.S. employees and household members are eligible to receive five free counseling sessions, per issue every year, via Amazon’s Global Employee Assistance Program (EAP), Resources for Living. Employees can also access mental health care 24/7 through a partnership with the app Twill—a digital, self-guided mental health program. Amazon also partners with Brightline, a leading provider in virtual mental health support for children and teens.

Solution overview

SageMaker Canvas brings together a broad set of capabilities to help data professionals prepare, build, train, and deploy ML models without writing any code. SageMaker Data Wrangler has also been integrated into SageMaker Canvas, reducing the time it takes to import, prepare, transform, featurize, and analyze data. In a single visual interface, you can complete each step of a data preparation workflow: data selection, cleansing, exploration, visualization, and processing. Custom Spark commands can also expand the over 300 built-in data transformations. The built-in Data Quality and Insights report guides you in performing appropriate data cleansing, verifying data quality, and detecting anomalies such as duplicate rows and target leakage. Other analyses are also available to help you visualize and understand your data.

In this post, we try to understand the factors contributing to the mental health of an employee in the tech industry in a systematic manner. We begin by understanding the feature columns, presented in the following table.

Survey Attribute Survey Attribute Description
Timestamp Timestamp when survey was taken
Age Age of person taking survey
Gender Gender of person taking survey
Country Country of person taking survey
state If you live in the United States, which state or territory do you live in?
self_employed Are you self-employed?
family_history Do you have a family history of mental illness?
treatment Have you sought treatment for a mental health condition?
work_interfere If you have a mental health condition, do you feel that it interferes with your work?
no_employees How many employees does your company or organization have?
remote_work Do you work remotely (outside of an office) at least 50% of the time?
tech_company Is your employer primarily a tech company/organization?
benefits Does your employer provide mental health benefits?
care_options Do you know the options for mental health care your employer provides?
wellness_program Has your employer ever discussed mental health as part of an employee wellness program?
seek_help Does your employer provide resources to learn more about mental health issues and how to seek help?
anonymity Is your anonymity protected if you choose to take advantage of mental health or substance abuse treatment resources?
leave How easy is it for you to take medical leave for a mental health condition?
mentalhealthconsequence Do you think that discussing a mental health issue with your employer would have negative consequences?
physhealthconsequence Do you think that discussing a physical health issue with your employer would have negative consequences?
coworkers Would you be willing to discuss a mental health issue with your coworkers?
physhealthinterview Would you bring up a physical health issue with a potential employer in an interview?
mentalvsphysical Do you feel that your employer takes mental health as seriously as physical health?
obs_consequence Have you heard of or observed negative consequences for coworkers with mental health conditions in your workplace?
comments Any additional notes or comments

Prerequisites

You should complete the following prerequisites before building this model:

Log in to SageMaker Canvas

When the initial setup is complete, you can access SageMaker Canvas with any of the following methods, depending on your environment’s setup:

Import the dataset into SageMaker Canvas

In SageMaker Canvas, you can see quick actions to get started building and using ML and generative artificial intelligence (AI) models, with a no code platform. Feel free to explore any of the out-of-the-box models.

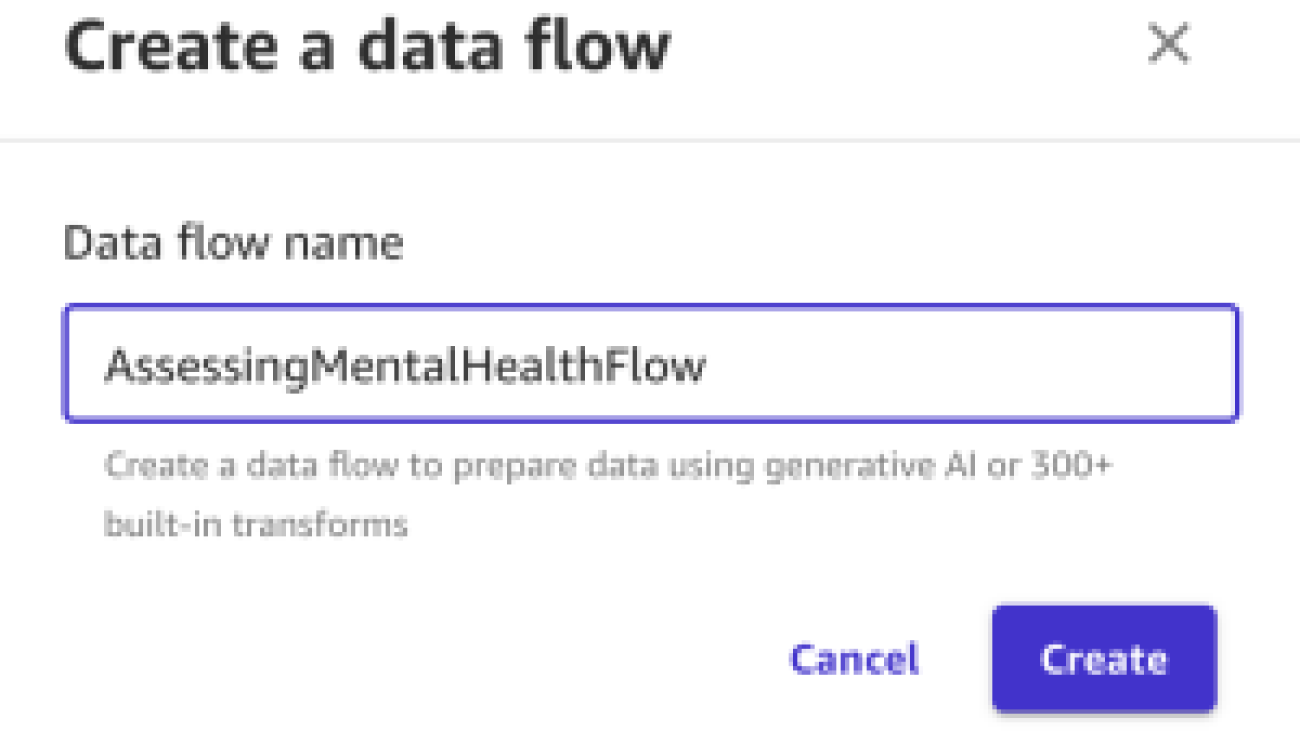
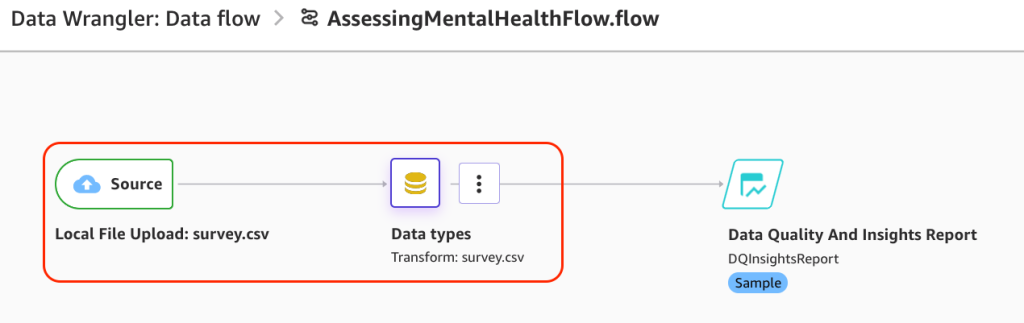
We start from creating a data flow. A data flow in SageMaker Canvas is used to build a data preparation pipeline that can be scheduled to automatically import, prepare, and feed into a model build. With a data flow, you can prepare data using generative AI, over 300 built-in transforms, or custom Spark commands.

Complete the following steps:

  • Choose Prepare and analyze data.
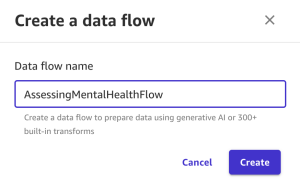
  • For Data flow name, enter a name (for example, AssessingMentalHealthFlow).
  • Choose Create.

SageMaker Data Wrangler will open.

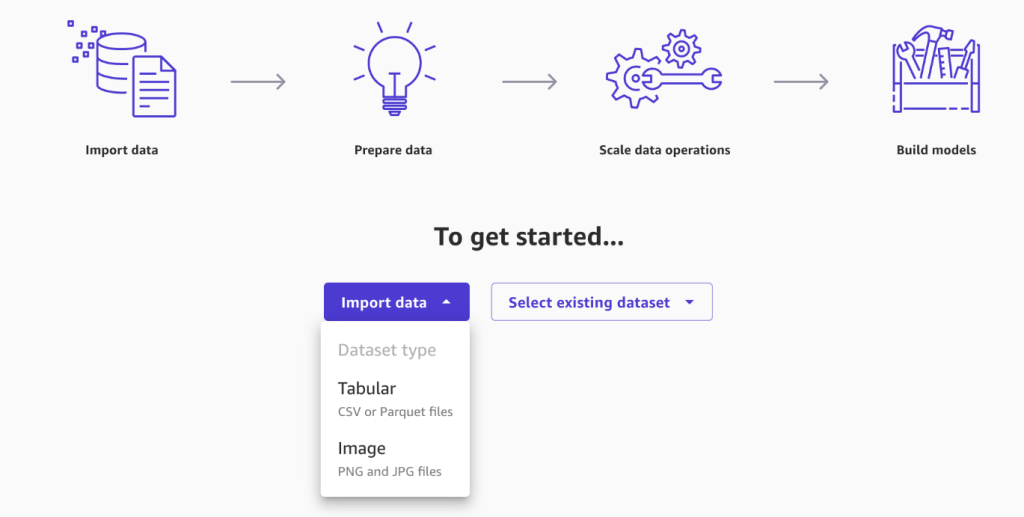
You can import data from multiple sources, ranging from AWS services, such as Amazon Simple Storage Service (Amazon S3) and Amazon Redshift, to third-party or partner services, including Snowflake or Databricks. To learn more about importing data to SageMaker Canvas, see Import data into Canvas.

  • Choose Import data, then choose Tabular.
  • Upload the dataset you downloaded in the prerequisites section.

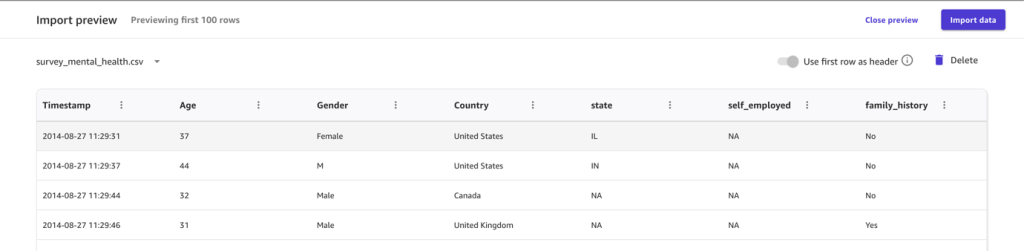
After a successful import, you will be presented with a preview of the data, which you can browse.

  • Choose Import data to finish this step.

Run a Data Quality and Insights report

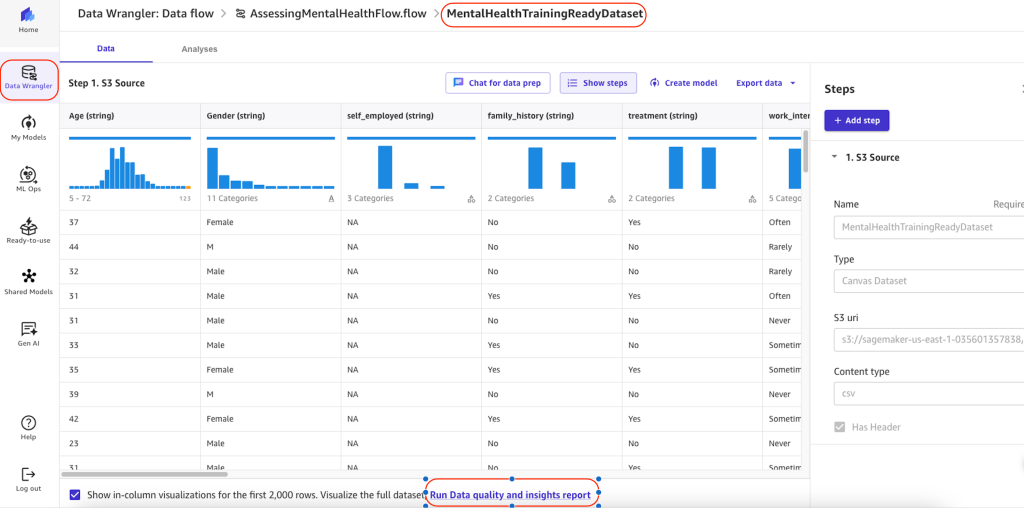
After you import the dataset, the SageMaker Data Wrangler data flow will open. You can run a Data Quality and Insights Report, which will perform an analysis of the data to determine potential issues to address during data preparation. Complete the following steps:

  • Choose Run Data quality and insights report.

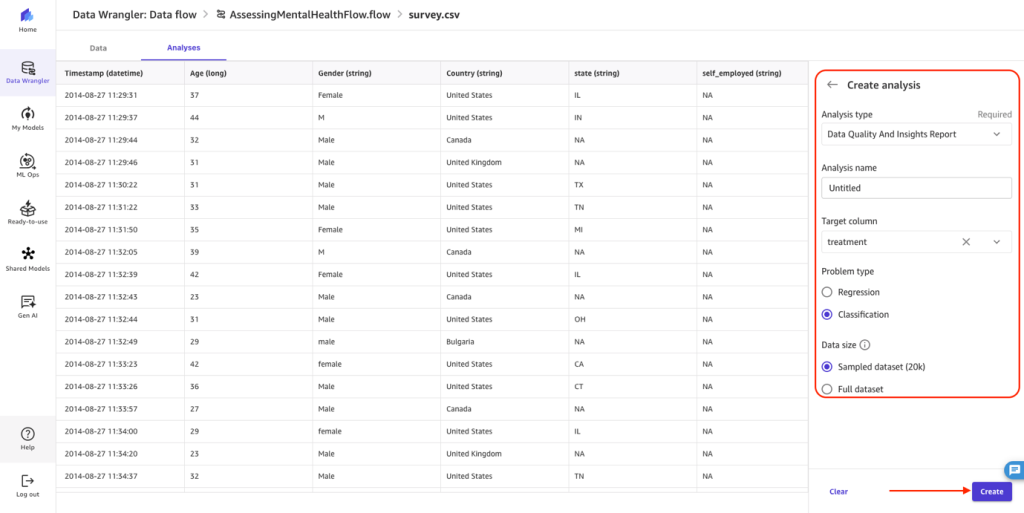
  • For Analysis name, enter a name.
  • For Target column, choose treatment.
  • For Problem type, select Classification.
  • For Data size, choose Sampled dataset.
  • Choose Create.

You are presented with the generated report, which details any high priority warnings, data issues, and other insights to be aware of as you add data transformations and move along the model building process.

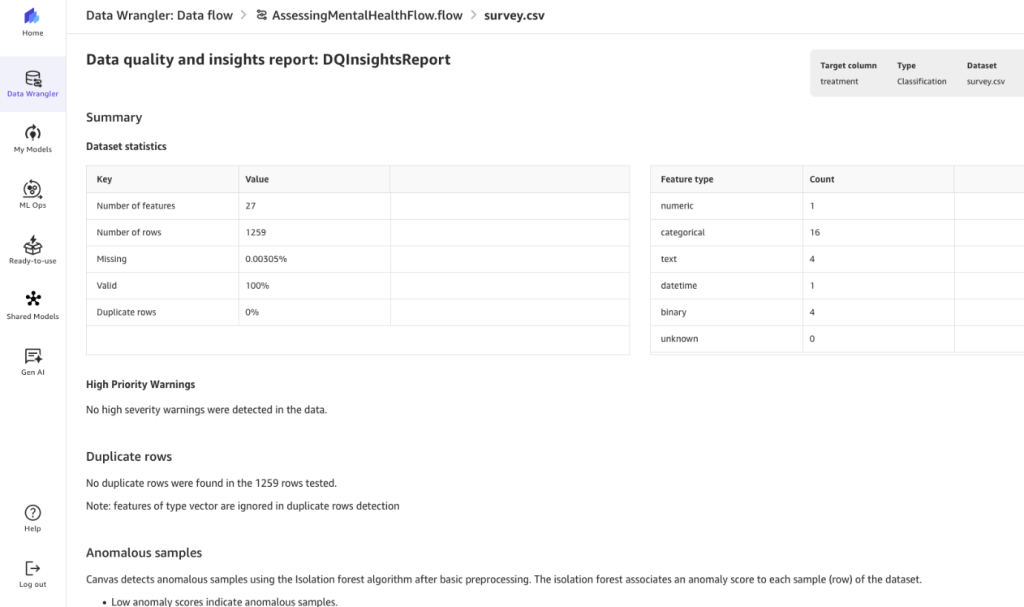
In this specific dataset, we can see that there are 27 features of different types, very little missing data, and no duplicates. To dive deeper into the report, refer to Get Insights On Data and Data Quality. To learn about other available analyzes, see Analyze and Visualize.

Prepare your data

As expected in the ML process, your dataset may require transformations to address issues such as missing values, outliers, or perform feature engineering prior to model building. SageMaker Canvas provides ML data transforms to clean, transform, and prepare your data for model building without having to write code. The transforms used are added to the model recipe, a record of the data preparation done on your data before building the model. You can refer to these advanced transformations and add them as transformation steps within your Data Wrangler flow.

Alternatively, you can use SageMaker Canvas to chat with your data and add transformations. We explore this option with some examples on our sample dataset.

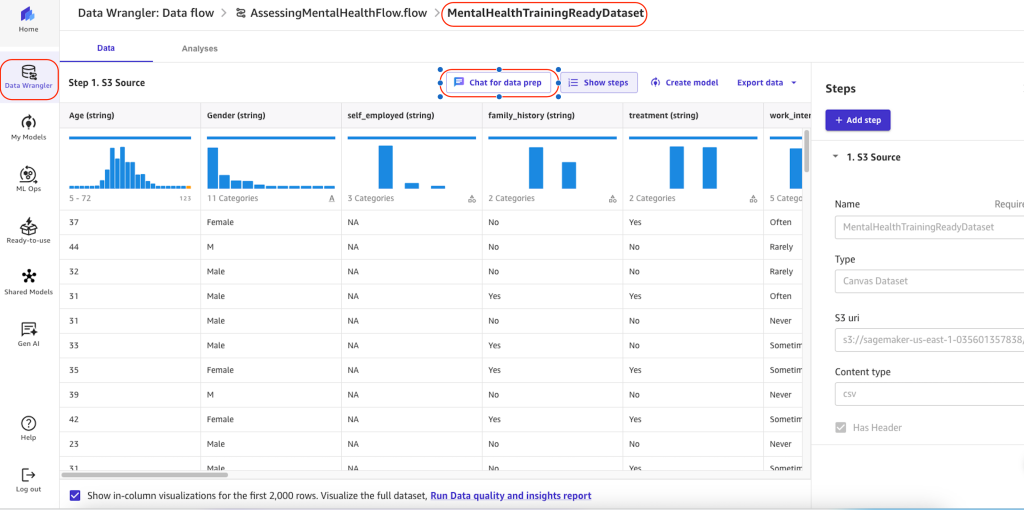
Use the chat feature for exploratory analysis and building transformations

Before you use the chat feature to prepare data, note the following:

  • Chat for data prep requires the AmazonSageMakerCanvasAIServicesAccess policy. For more information, see AWS managed policy: AmazonSageMakerCanvasAIServicesAccess.
  • Chat for data prep requires access to Amazon Bedrock and the Anthropic Claude v2 model within it. For more information, see Model access.
  • You must run SageMaker Canvas data prep in the same AWS Region as the Region where you’re running your model. Chat for data prep is available in the US East (N. Virginia), US West (Oregon), and Europe (Frankfurt) Regions.

To chat with your data, complete the following steps:

  • Open your SageMaker Canvas data flow.
  • Open your dataset by choosing Source or Data types.

  • Choose Chat for data prep and specify your prompts in the chat window.

  • Optionally, if an analysis has been generated by your query, choose Add to analyses to reference it for later.
  • Optionally, if you’ve transformed your data using a prompt, do the following:
  1. Choose Preview to view the results.
  2. Optionally modify the code in the transform and choose Update.
  3. If you’re happy with the results of the transform, choose Add to steps to add it to the steps pane.

Let’s try a few exploratory analyses and transformations through the chat feature.

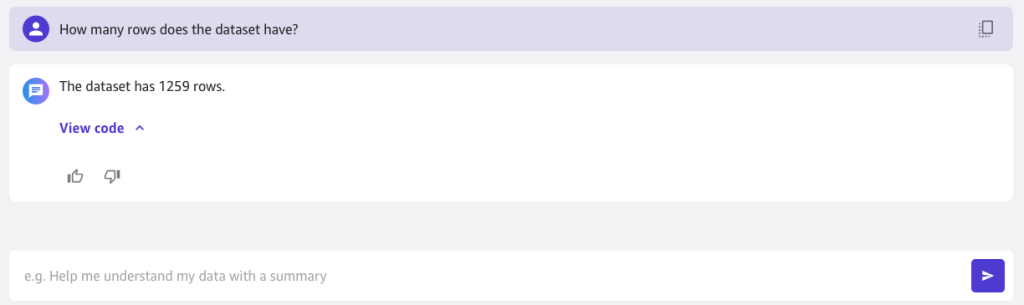
In the following example, we ask “How many rows does the dataset have?”

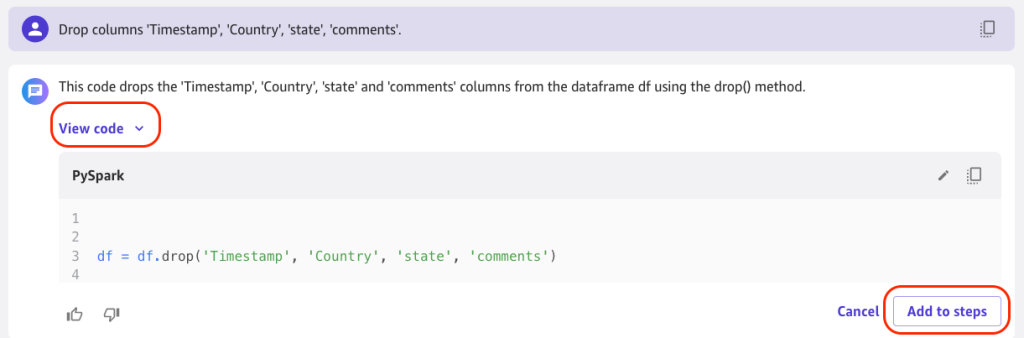
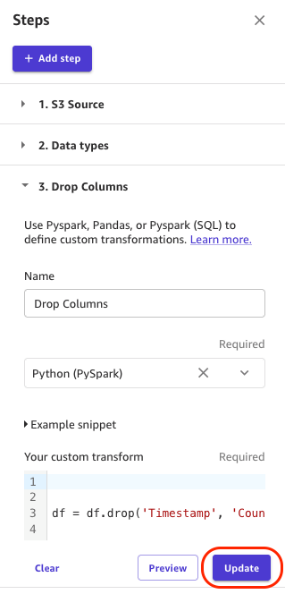
In the following example, we drop the columns Timestamp, Country, state, and comments, because these features will have least impact for classification of our model. Choose View code to see the generated Spark code that performs the transformation, then choose Add to steps to add the transformation to the data flow.

You can provide a name and choose Update to save the data flow.

In the next example, we ask “Show me all unique ages sorted.”

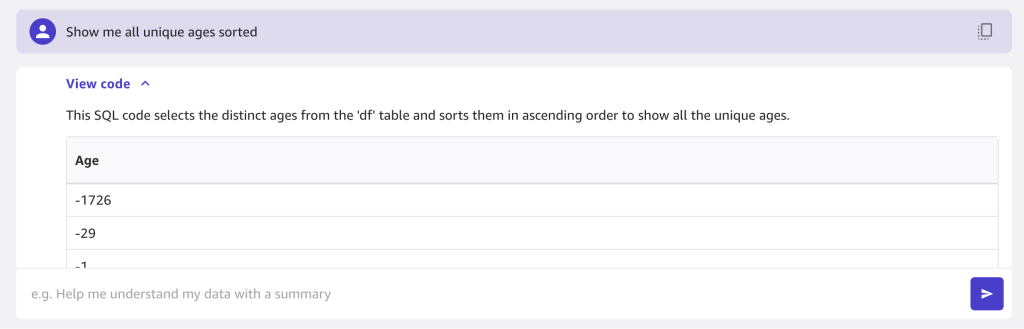
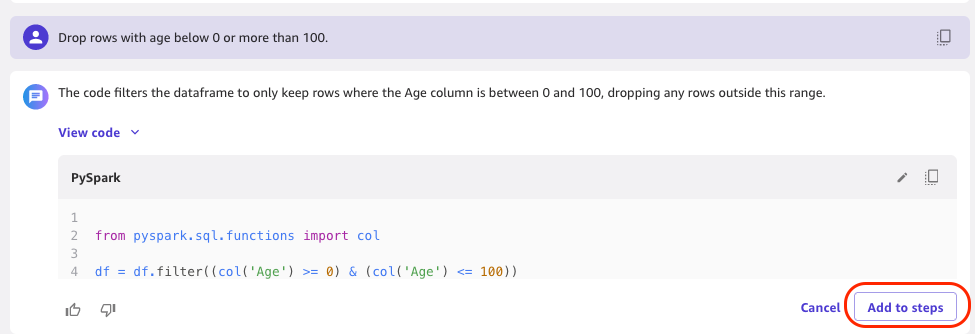
Some ages are negative, so we should filter on valid ages. We drop rows with age below 0 or more than 100 and add this to the steps.

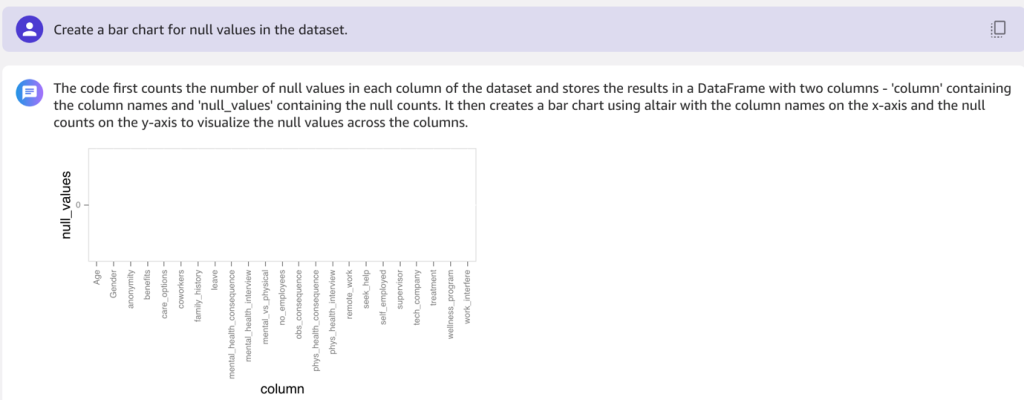
In the following example, we ask “Create a bar chart for null values in the dataset.”

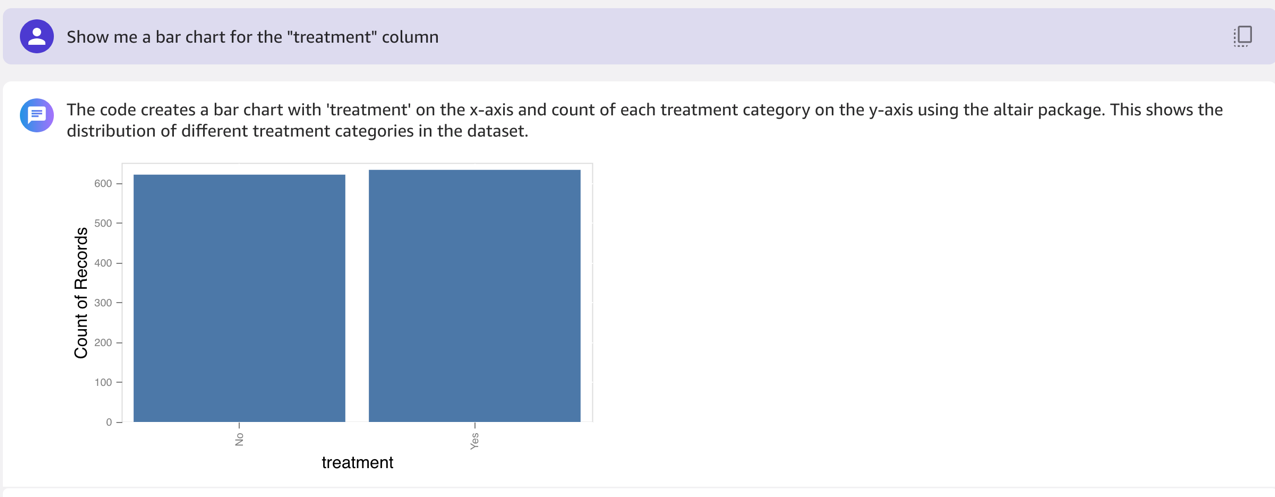
Then we ask for a bar chart for the treatment column.

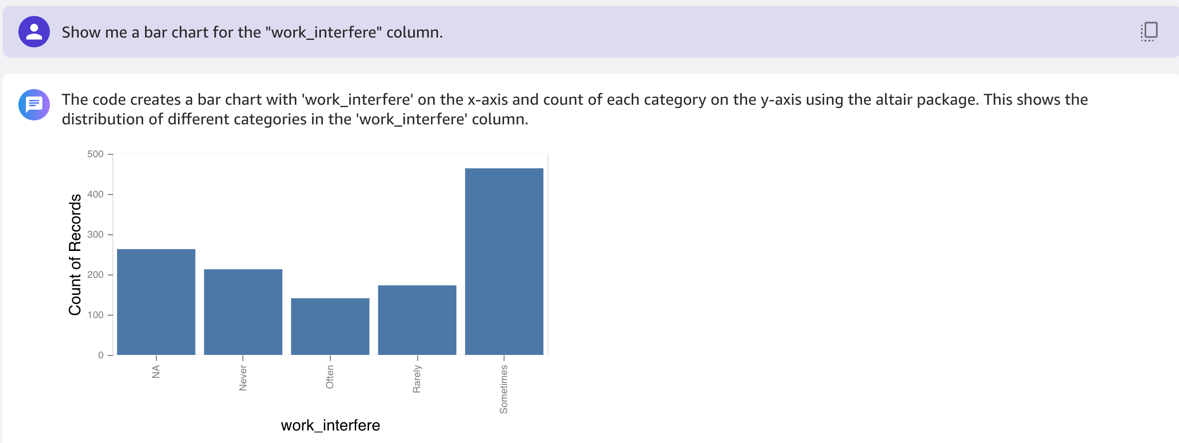
In the following example, we ask for a bar chart for the work_interfere column.

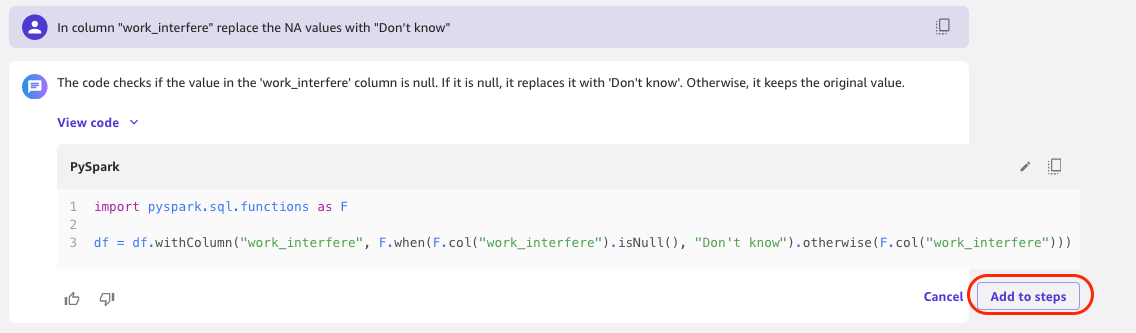
In the column work_interfere, we replace the NA values with “Don’t know.” We want to make the model weight missing values just as it weights people that have replied “Don’t know.”

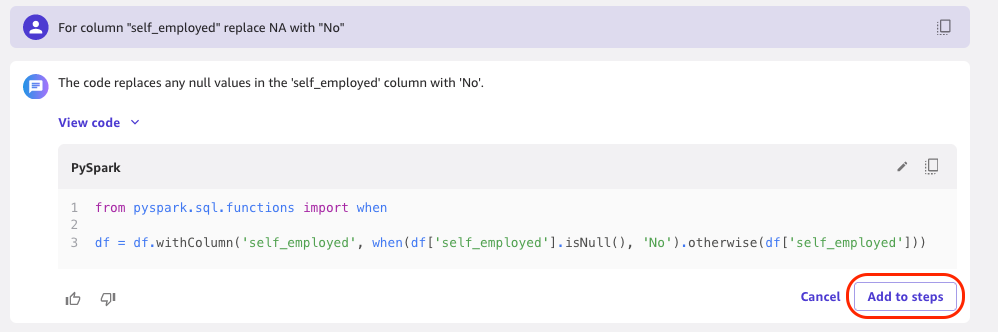
For the column self_employed, we want to replace NA with “No” to make the model weight missing values just as it weights people that have replied “NA.”

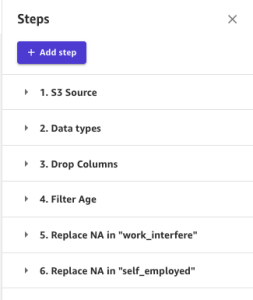
You can choose to add any other transformations as needed. If you’ve followed the preceding transformations, your steps should look like the following screenshot.

Perform an analysis on the transformed data

Now that transformations have been done on the data, you may want to perform analyses to make sure they haven’t affected data integrity.

To do so, navigate to the Analyses tab to create an analysis. For this example, we create a feature correlation analysis with the correlation type linear.

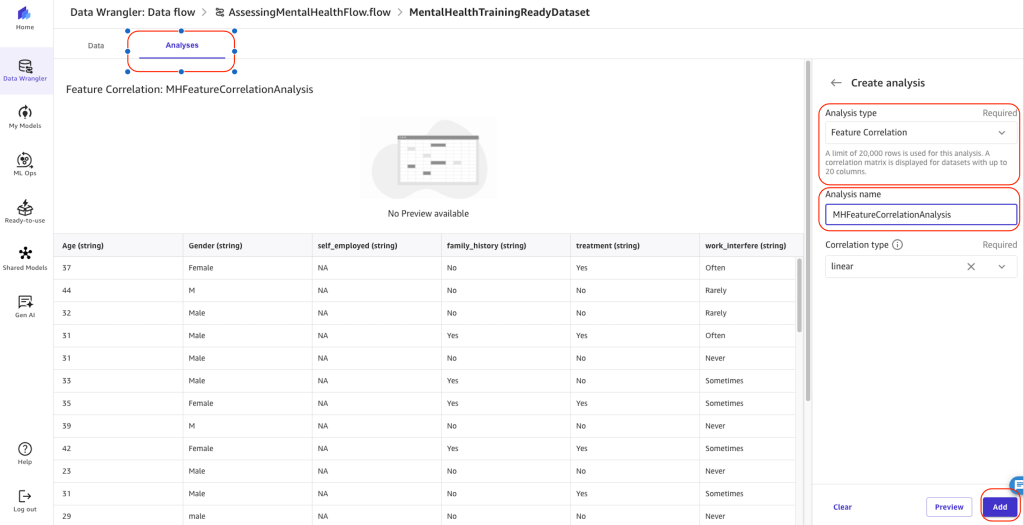
The analysis report will generate a correlation matrix. The correlation matrix measures the positive or negative correlation of features among themselves, between each other. A value closer to 1 means positive correlation, and a value closer to -1 means negative correlation.

Linear feature correlation is based on Pearson’s correlation. To find the relationship between a numeric variable (like age or income) and a categorical variable (like gender or education level), we first assign numeric values to the categories in a way that allows them to best predict the numeric variable. Then we calculate the correlation coefficient, which measures how strongly the two variables are related.

Linear categorical to categorical correlation is not supported.

Numeric to numeric correlation is in the range [-1, 1], where 0 implies no correlation, 1 implies perfect correlation, and -1 implies perfect inverse correlation. Numeric to categorical and categorical to categorical correlations are in the range [0, 1], where 0 implies no correlation and 1 implies perfect correlation.

Features that are not either numeric or categorical are ignored.

The following table lists for each feature what is the most correlated feature to it.

Feature Most Correlated Feature Correlation
Age (numeric) Gender (categorical) 0.248216
Gender (categorical) Age (numeric) 0.248216
seek_help (categorical) Age (numeric) 0.175808
no_employees (categorical) Age (numeric) 0.166486
benefits (categorical) Age (numeric) 0.157729
remote_work (categorical) Age (numeric) 0.139105
care_options (categorical) Age (numeric) 0.1183
wellness_program (categorical) Age (numeric) 0.117175
phys_health_consequence (categorical) Age (numeric) 0.0961159
work_interfere (categorical) Age (numeric) 0.0797424
treatment (categorical) Age (numeric) 0.0752661
mental_health_consequence (categorical) Age (numeric) 0.0687374
obs_consequence (categorical) Age (numeric) 0.0658778
phys_health_interview (categorical) Age (numeric) 0.0639178
self_employed (categorical) Age (numeric) 0.0628861
tech_company (categorical) Age (numeric) 0.0609773
leave (categorical) Age (numeric) 0.0601671
mental_health_interview (categorical) Age (numeric) 0.0600251
mental_vs_physical (categorical) Age (numeric) 0.0389857
anonymity (categorical) Age (numeric) 0.038797
coworkers (categorical) Age (numeric) 0.0181036
supervisor (categorical) Age (numeric) 0.0167315
family_history (categorical) Age (numeric) 0.00989271

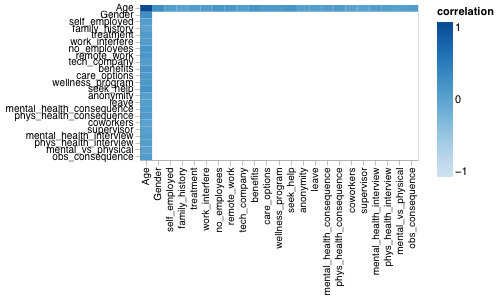
The following figure shows our correlation matrix.

You can explore more analyses of different types. For more details, see Explore your data using visualization techniques.

Export the dataset and create a model

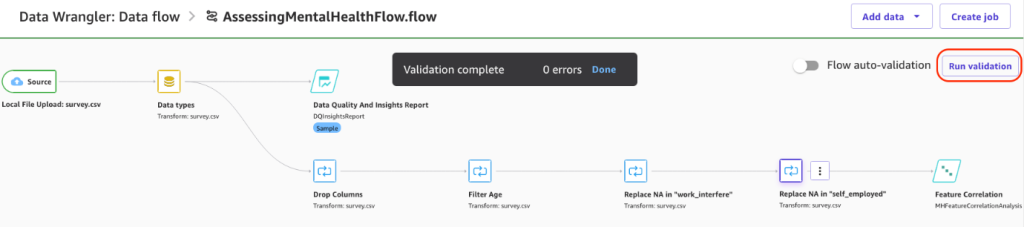
Return to the main data flow and run the SageMaker Data Wrangler validation flow. Upon successful validation, you are ready to export the dataset for model training.

Next, you export your dataset and build an ML model on top of it. Complete the following steps:

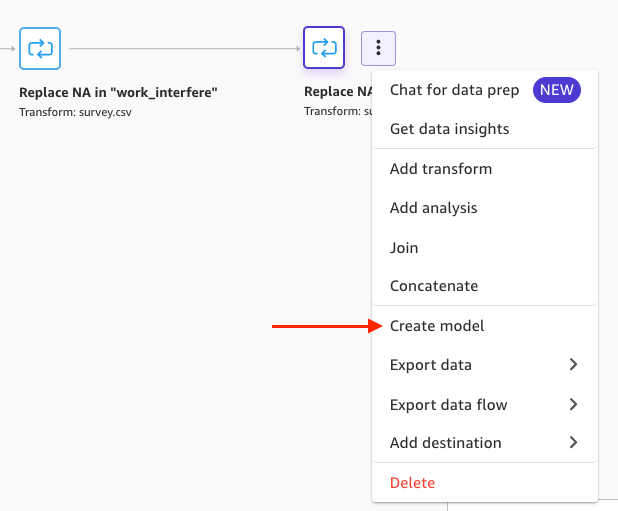
  • Open the expanded menu in the final transformation and choose Create model.

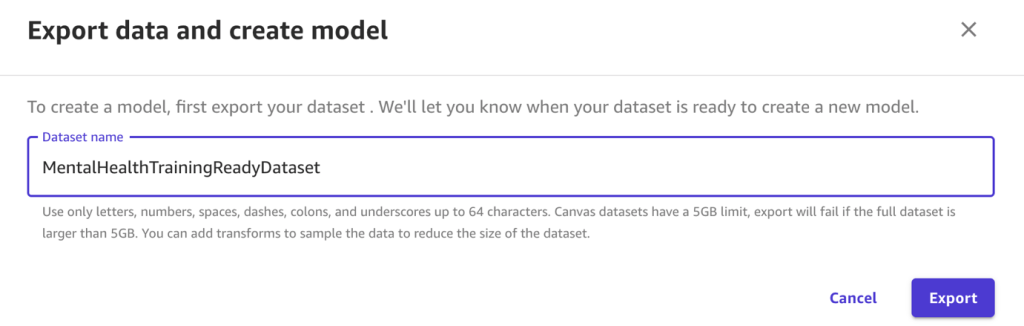
  • For Dataset name, enter a name.
  • Choose Export.

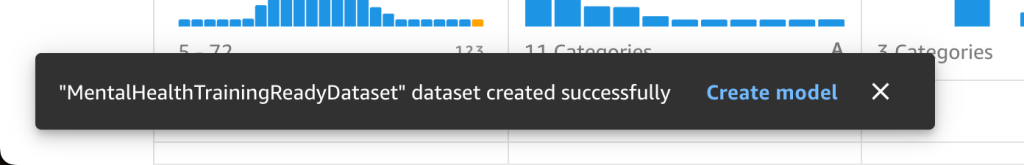
At this point, your mental health assessment dataset is ready for model training and testing.

  • Choose Create model.

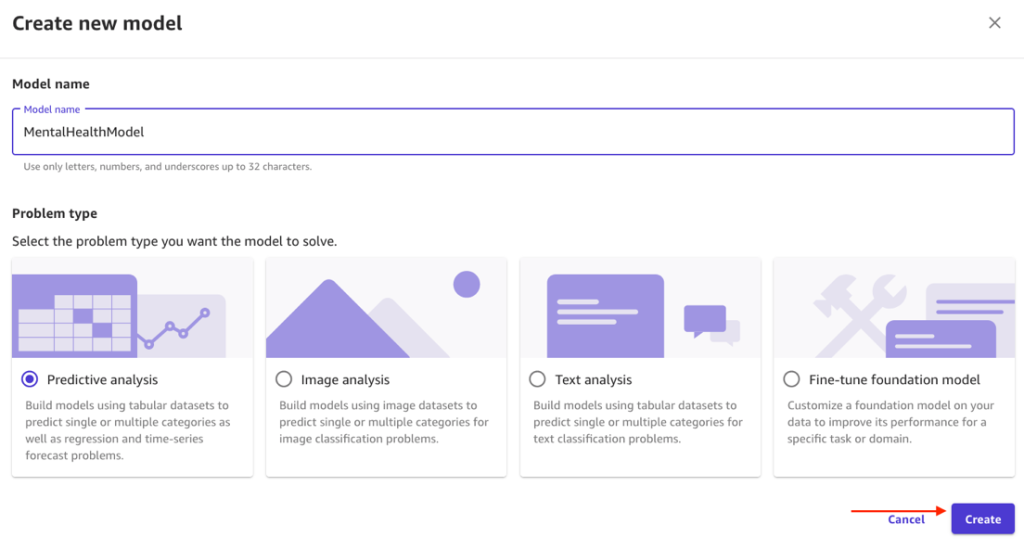
  • For Model name, enter a name.
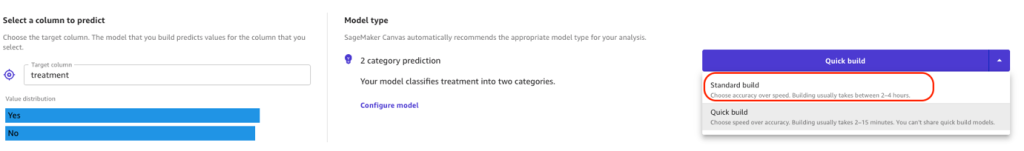
  • For Problem type, select Predictive analysis.

SageMaker Canvas suggested this based on the dataset, but you can override this for your own experimentation. For more information about ready-to-use models provided by SageMaker Canvas, see Use Ready-to-use models.

  • Choose Create.

  • For Target column, choose treatment as the column to predict.

Because Yes or No is predicted, SageMaker Canvas detected this is a two-category prediction model.

  • Choose Configure model to set configurations.

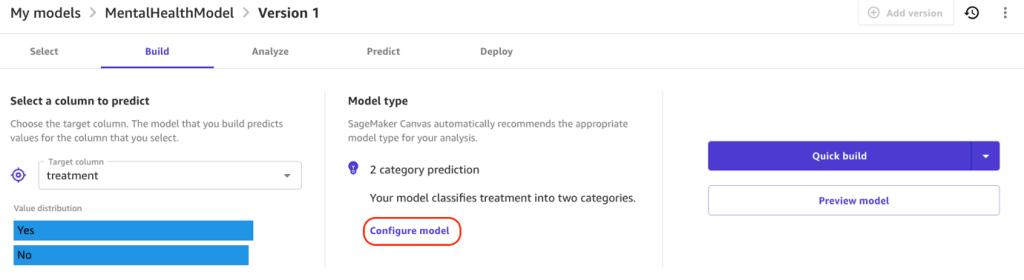
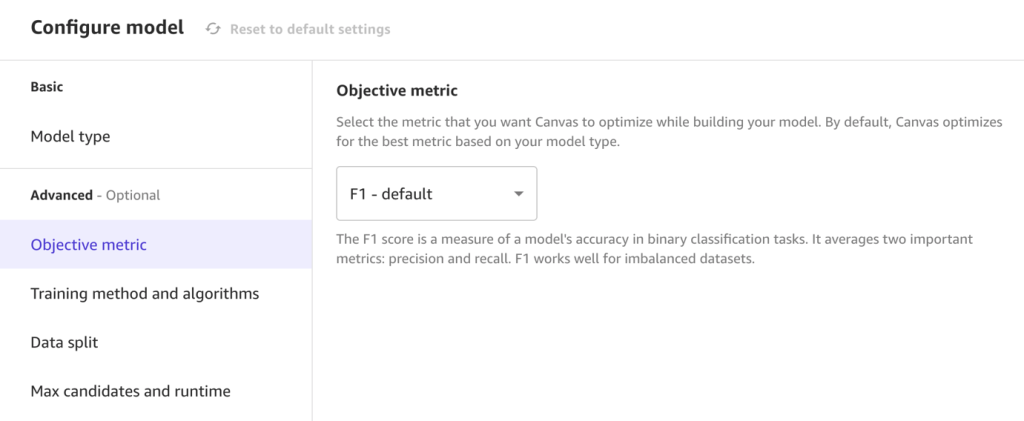
  • For Objective metric, leave as the default F1.

F1 averages two important metrics: precision and recall.

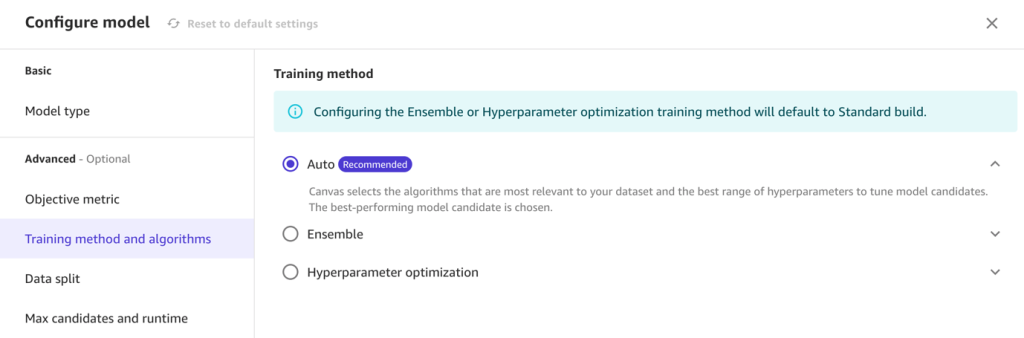
  • For Training method, select Auto.

This option selects the algorithm most relevant to your dataset and the best range of hyperparameters to tune model candidates. Alternatively, you could use the ensemble or hyperparameter optimization training options. For more information, see Training modes and algorithm support.

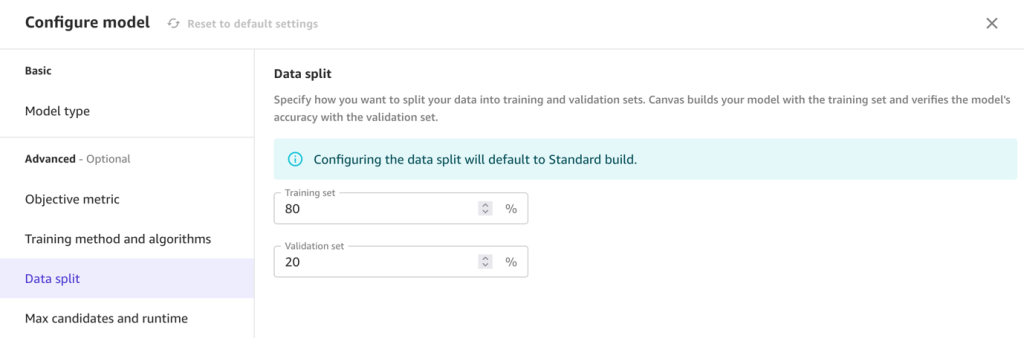
  • For Data split, specify an 80/20 configuration for training and validation, respectively.

  • Choose Save and then Preview model to generate a preview.

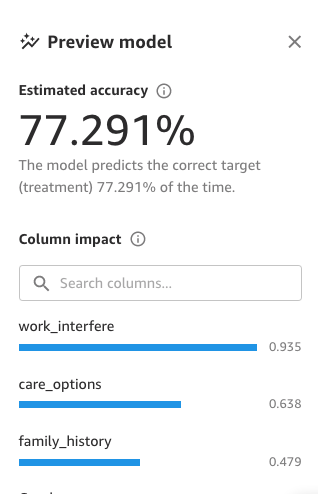
This preview runs on subset of data and provides information on estimated model accuracy and feature importance. Based on the results, you may still apply additional transformations to improve the estimated accuracy.

Although low impact features might add noise to the model, these may still be useful to describe situations specific to your use case. Always combine predictive power with your own context to determine which features to include.

You’re now ready to build the full model with either Quick build or Standard build. Quick build only supports datasets with fewer than 50,000 rows and prioritizes speed over accuracy, training fewer combinations of models and hyperparameters, for rapid prototyping or proving out value. Standard build prioritizes accuracy and is necessary for exporting the full Jupyter notebook used for training.

  • For this post, choose Standard build.

To learn more about how SageMaker Canvas uses training and validation datasets, see Evaluating Your Model’s Performance in Amazon SageMaker Canvas and SHAP Baselines for Explainability.

Your results may differ from those in this post. Machine learning introduces stochasticity in the model training process, which can lead to slight variations.

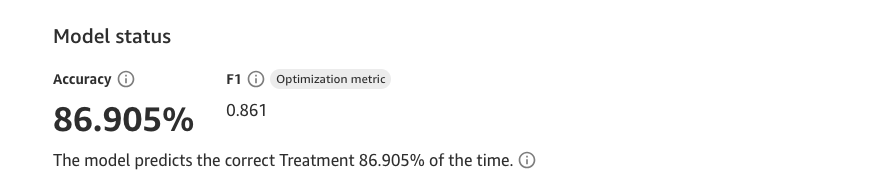
Here, we’ve built a model that will predict with about 87% accuracy whether an individual will seek mental health treatment. At this stage, think about how you could achieve a practical impact from the Machine Learning model. For example, here an organization may consider how they can apply the model to preemptively support individuals who’s attributes suggest they would seek treatment.

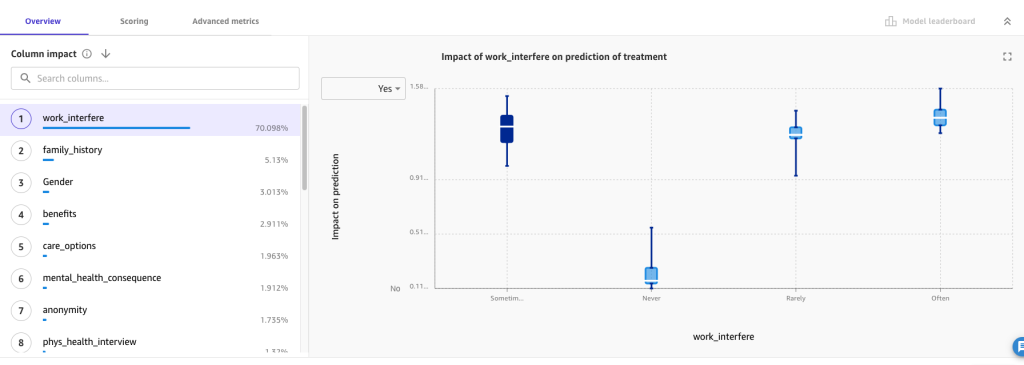
Review model metrics

Let’s focus on the first tab, Overview. Here, Column impact is the estimated importance of each attribute in predicting the target. Information here can help organizations gain insights that lead to actions based on the model. For example, we see that the work_interfere column has the most significant impact in predication for treatment. Additionally, better benefits and care_options increase the likelihood of employees opting in to treatment.

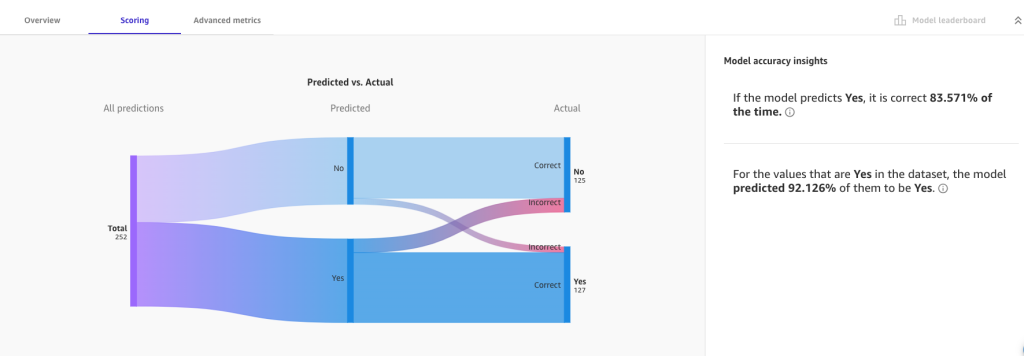
On the Scoring tab, we can visualize a Sankey (or ribbon) plot of the distribution of predicted values with respect to actual values, providing insight into how the model performed during validation.

For more detailed insights, we look at the Advanced metrics tab for metric values the model may have not been optimized for, the confusion matrix, and precision recall curve.

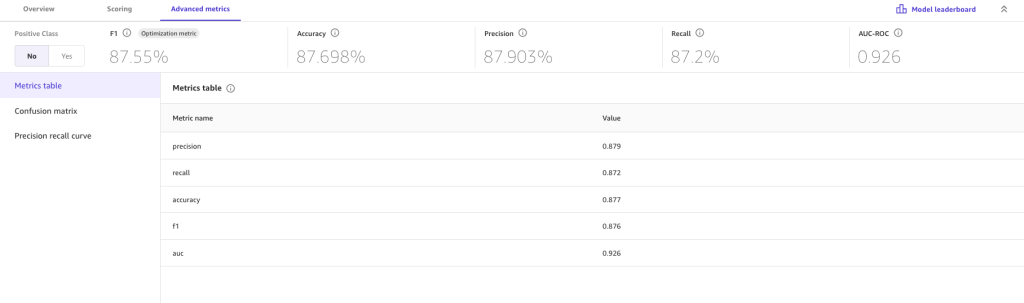
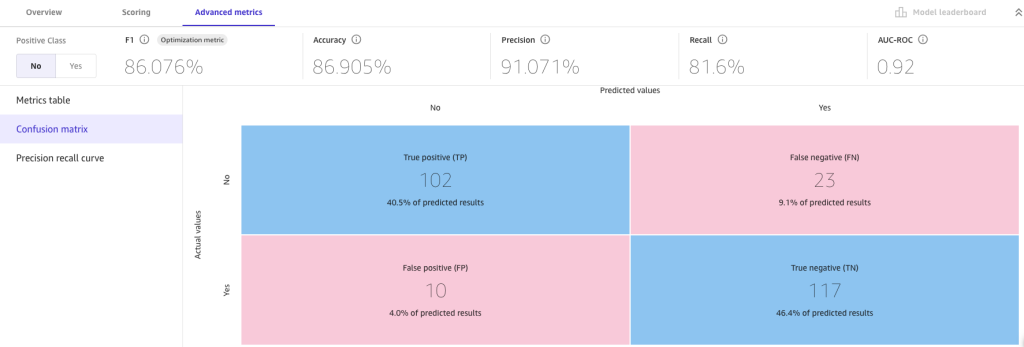
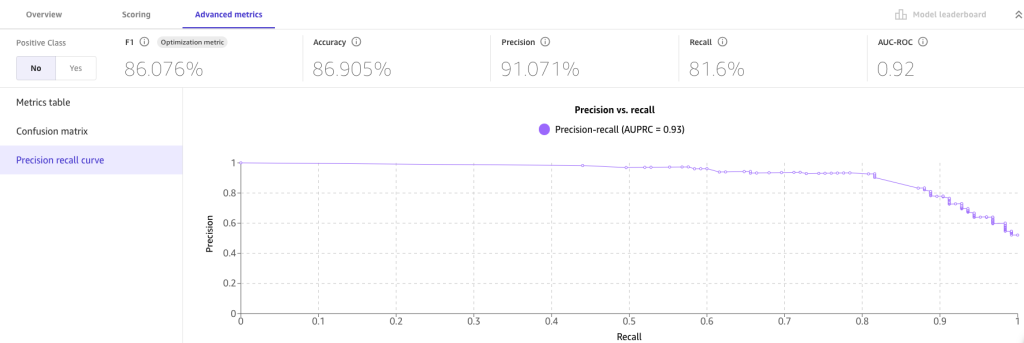
The advanced metrics suggest we can trust the resulting model. False positives (predicting an employee will opt in for treatment when they actually don’t) and false negatives (predicting an employee will opt out when they actually opt in) are low. High numbers for either may make us skeptical about the current build and more likely to revisit previous steps.

Test the model

Now let’s use the model for making predictions. Choose Predict to navigate to the Predict tab. SageMaker Canvas allows you to generate predictions in two forms:

  • Single prediction (single “what-if scenario”)
  • Batch prediction (multiple scenarios using a CSV file)

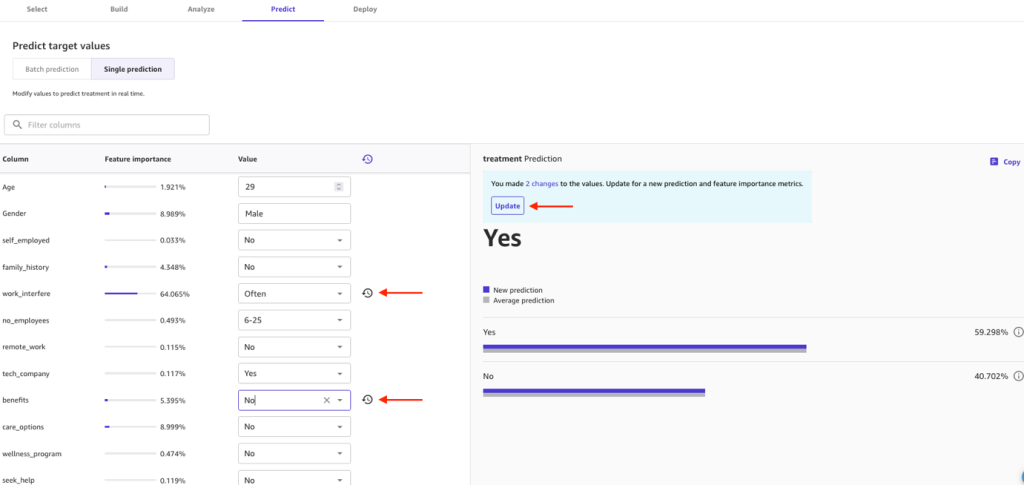
For a first test, let’s try a single prediction. Wait a few seconds for the model to load, and now you’re ready to generate new inferences. You can change the values to experiment with the attributes and their impact.

For example, let’s make the following updates:

  • Change work_interfere from Often to Sometimes
  • Change benefits from Yes to No

Choose Update and see if the treatment prediction is affected.

In SageMaker Canvas, you can generate batch predictions either manually or automatically on a schedule. Let’s try the manual approach. To learn about automating batch predictions, refer to Automate batch predictions.

  • In practice, use a dataset different from training for testing predictions. For this example though, lets use the same file as before. Be sure to remove the work_interfere column.
  • Choose Batch prediction and upload the downloaded file.
  • Choose Generate predictions.
  • When it’s complete, choose View to see the predictions.
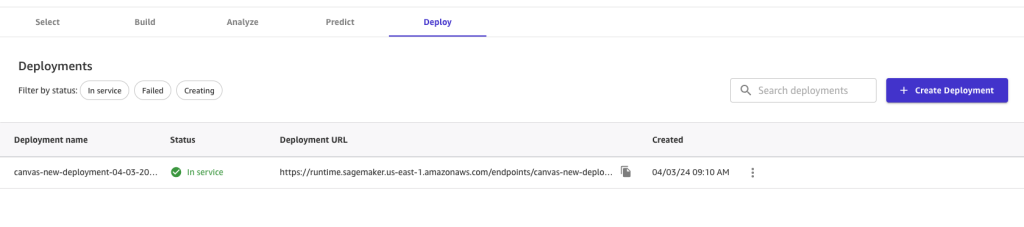
Deploy the model

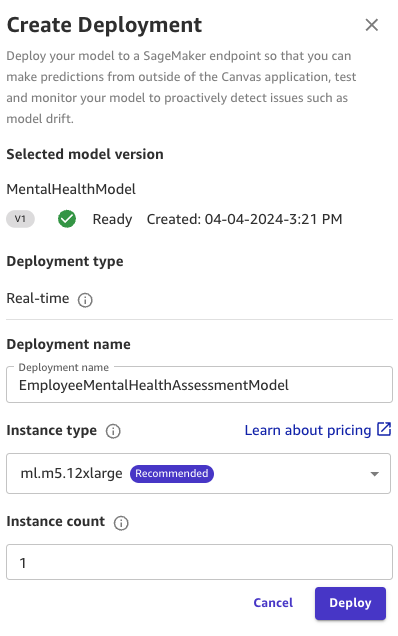
The final (optional) step of the SageMaker Canvas workflow for ML models is deploying the model. This uses SageMaker real-time inference endpoints to host the SageMaker Canvas model and expose an HTTPS endpoint for use by applications or developers.

  1. On the Deploy tab, choose Create deployment.
  2. For Deployment name, enter a name.
  3. For Instance type, choose an instance (for this post, ml.m5.2xlarge).
  4. Set Instance count to 1.
  5. Choose Deploy.

This instance configuration is sufficient for the demo. You can change the configuration later from the SageMaker Canvas UI or using SageMaker APIs. To learn more about auto scaling such workloads, see Automatically Scale Amazon SageMaker Models.

After the deployment is successful, you can invoke the endpoint using AWS SDKs or direct HTTPs calls. For more information, see Deploy models for real-time inference.

To learn more about model deployment, refer to Deploy your Canvas models to a SageMaker Endpoint and Deploy models for real-time inference.
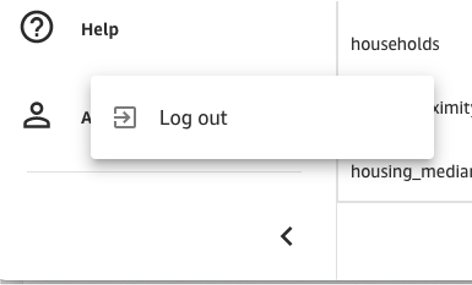
Clean up

Make sure to log out from SageMaker Canvas by choosing Log out. Logging out of the SageMaker Canvas application will release all resources used by the workspace instance, therefore avoiding incurring additional unintended charges.

Summary

Mental health is a dynamic and evolving field, with new research and insights constantly emerging. Staying up to date with the latest developments and best practices can be challenging, especially in a public forum. Additionally, when discussing mental health, it’s essential to approach the topic with sensitivity, respect, and a commitment to providing accurate and helpful information.

In this post, we showcased an ML approach to building a mental health model using a sample dataset and SageMaker Canvas, a low-code no-code platform from AWS. This can serve as guidance for organizations looking to explore similar solutions for their specific needs. Implementing AI to assess employee mental health and offer preemptive support can yield a myriad of benefits. By promoting detection of potential mental health needs, intervention can be more personalized and reduce the risk of drastic complications in the future. A proactive approach can also enhance employee morale and productivity, mitigating the likelihood of absenteeism, turnover and ultimately leads to a healthier and more resilient workforce.. Overall, using AI for mental health prediction and support signifies a commitment to nurturing a supportive work environment where employees can thrive.

To explore more about SageMaker Canvas with industry-specific use cases, explore a hands-on workshop. To learn more about SageMaker Data Wrangler in SageMaker Canvas, refer to Prepare Data. You can also refer to the following YouTube video to learn more about the end-to-end ML workflow with SageMaker Canvas.

Although this post provides a technical perspective, we strongly encourage readers who are struggling with mental health issues to seek professional help. Remember, there is always help available for those who ask.

Together, let’s take a proactive step towards empowering mental health awareness and supporting those in need.


About the Authors

Rushabh Lokhande is a Senior Data & ML Engineer with AWS Professional Services Analytics Practice. He helps customers implement big data, machine learning, analytics solutions, and generative AI implementations. Outside of work, he enjoys spending time with family, reading, running, and playing golf.

Bruno Klein is a Senior Machine Learning Engineer with AWS Professional Services Analytics Practice. He helps customers implement big data analytics solutions and generative AI implementations. Outside of work, he enjoys spending time with family, traveling, and trying new food.

Ryan Gomes is a Senior Data & ML Engineer with AWS Professional Services Analytics Practice. He is passionate about helping customers achieve better outcomes through analytics, machine learning, and generative AI solutions in the cloud. Outside of work, he enjoys fitness, cooking, and spending quality time with friends and family.

Read More

Introducing Aurora: The first large-scale foundation model of the atmosphere

Introducing Aurora: The first large-scale foundation model of the atmosphere

satellite image of Storm Ciarán

When Storm Ciarán battered northwestern Europe in November 2023, it left a trail of destruction. The low-pressure system associated with Storm Ciarán set new records for England, marking it as an exceptionally rare meteorological event. The storm’s intensity caught many off guard, exposing the limitations of current weather-prediction models and highlighting the need for more accurate forecasting in the face of climate change. As communities grappled with the aftermath, the urgent question arose: How can we better anticipate and prepare for such extreme weather events? 

A recent study by Charlton-Perez et al. (2024) underscored the challenges faced by even the most advanced AI weather-prediction models in capturing the rapid intensification and peak wind speeds of Storm Ciarán. To help address those challenges, a team of Microsoft researchers developed Aurora, a cutting-edge AI foundation model that can extract valuable insights from vast amounts of atmospheric data. Aurora presents a new approach to weather forecasting that could transform our ability to predict and mitigate the impacts of extreme events—including being able to anticipate the dramatic escalation of an event like Storm Ciarán.  

A flexible 3D foundation model of the atmosphere

Aurora is a 1.3 billion parameter foundation model for high-resolution  forecasting of weather and atmospheric processes. Aurora is a flexible 3D Swin Transformer with 3D Perceiver-based encoders and decoders. At pretraining time, Aurora is optimised to minimise a loss on multiple heterogeneous datasets with different resolutions, variables, and pressure levels. The model is then fine-tuned in two stages: (1) short-lead time fine-tuning of the pretrained weights (2) long-lead time (rollout) fine-tuning using Low Rank Adaptation (LoRA). The fine-tuned models are then deployed to tackle a diverse collection of operational forecasting scenarios at different resolutions.
Figure 1: Aurora is a 1.3 billion parameter foundation model for high-resolution forecasting of weather and atmospheric processes. Aurora is a flexible 3D Swin Transformer with 3D Perceiver-based encoders and decoders. At pretraining time, Aurora is optimized to minimize a loss on multiple heterogeneous datasets with different resolutions, variables, and pressure levels. The model is then fine-tuned in two stages: (1) short-lead time fine-tuning of the pretrained weights and (2) long-lead time (rollout) fine-tuning using Low Rank Adaptation (LoRA). The fine-tuned models are then deployed to tackle a diverse collection of operational forecasting scenarios at different resolutions.

Aurora’s effectiveness lies in its training on more than a million hours of diverse weather and climate simulations, which enables it to develop a comprehensive understanding of atmospheric dynamics. This allows the model to excel at a wide range of prediction tasks, even in data-sparse regions or extreme weather scenarios. By operating at a high spatial resolution of 0.1° (roughly 11 km at the equator), Aurora captures intricate details of atmospheric processes, providing more accurate operational forecasts than ever before—and at a fraction of the computational cost of traditional numerical weather-prediction systems. We estimate that the computational speed-up that Aurora can bring over the state-of-the-art numerical forecasting system Integrated Forecasting System (IFS) is ~5,000x. 

Beyond its impressive accuracy and efficiency, Aurora stands out for its versatility. The model can forecast a broad range of atmospheric variables, from temperature and wind speed to air-pollution levels and concentrations of greenhouse gases. Aurora’s architecture is designed to handle heterogeneous gold standard inputs and generate predictions at different resolutions and levels of fidelity. The model consists of a flexible 3D Swin Transformer with Perceiver-based encoders and decoders, enabling it to process and predict a range of atmospheric variables across space and pressure levels. By pretraining on a vast corpus of diverse data and fine-tuning on specific tasks, Aurora learns to capture intricate patterns and structures in the atmosphere, allowing it to excel even with limited training data when it is being fine-tuned for a specific task. 

Fast prediction of atmospheric chemistry and air pollution

Sample predictions for total column nitrogen dioxide by Aurora compared to CAMS analysis. Aurora was initialised with CAMS analysis at 1 Sep 2022 00 UTC. Predicting atmospheric gasses correctly is extremely challenging due to their spatially heterogeneous nature. In particular, nitrogen dioxide, like most variables in CAMS, is skewed towards high values in areas with large anthropogenic emissions such as densely populated areas in East Asia. In addition, it exhibits a strong diurnal cycle; e.g., sunlight reduces background levels through a process called photolysis. Aurora accurately captures both the extremes and background levels.
Latitude-weighted root mean square error (RMSE) of Aurora relative to CAMS, where negative values (blue) mean that Aurora is better. The RMSEs are computed over the period Jun 2022 to Nov 2022 inclusive. Aurora matches or outperforms CAMS on 74% of the targets.
Figure 2: Aurora outperforms operational CAMS across many targets. (a) Sample predictions for total column nitrogen dioxide by Aurora compared to CAMS analysis. Aurora was initialized with CAMS analysis at 1 Sep 2022 00 UTC. Predicting atmospheric gases correctly is extremely challenging due to their spatially heterogeneous nature. In particular, nitrogen dioxide, like most variables in CAMS, is skewed toward high values in areas with large anthropogenic emissions, such as densely populated areas in East Asia. In addition, it exhibits a strong diurnal cycle; e.g., sunlight reduces background levels via a process called photolysis. Aurora accurately captures both the extremes and background levels. (b) Latitude-weighted root mean square error (RMSE) of Aurora relative to CAMS, where negative values (blue) mean that Aurora is better. The RMSEs are computed over the period Jun 2022 to Nov 2022 inclusive. Aurora matches or outperforms CAMS on 74% of the targets.

A prime example of Aurora’s versatility is its ability to forecast air-pollution levels using data from the Copernicus Atmosphere Monitoring Service (CAMS), a notoriously difficult task due to the complex interplay of atmospheric chemistry, weather patterns, and human activities, as well as the highly heterogeneous nature of CAMS data. By leveraging its flexible encoder-decoder architecture and attention mechanisms, Aurora effectively processes and learns from this challenging data, capturing the unique characteristics of air pollutants and their relationships with meteorological variables. This enables Aurora to produce accurate five-day global air-pollution forecasts at 0.4° spatial resolution, outperforming state-of-the-art atmospheric chemistry simulations on 74% of all targets, demonstrating its remarkable adaptability and potential to tackle a wide range of environmental prediction problems, even in data-sparse or highly complex scenarios. 

Data diversity and model scaling improve atmospheric forecasting

One of the key findings of this study is that pretraining on diverse datasets significantly improves Aurora’s performance compared to training on a single dataset. By incorporating data from climate simulations, reanalysis products, and operational forecasts, Aurora learns a more robust and generalizable representation of atmospheric dynamics. It is thanks to its scale and diverse pretraining data corpus that Aurora is able outperform state-of-the-art numerical weather-prediction models and specialized deep-learning approaches across a wide range of tasks and resolutions. 

Performance versus ERA5 2021 at 6h lead time for models pretrained on different dataset configurations (i.e., no fine-tuning) labeled by C1-C4. The root mean square errors (RMSEs) are normalised by the performance of the ERA5-pretrained model (C1). Adding low-fidelity simulation data from CMIP6 (i.e., CMCC and IFS-HR) improves performance almost uniformly (C2). Adding even more simulation data improves performance further on most surface variables and for the atmospheric levels present in this newly added data (C3). Finally, configuration C4, which contains a good coverage of the entire atmosphere and also contains analysis data from GFS achieves the best overall performance with improvements across the board.
Pretraining on many diverse data sources improves the forecasting of extreme values at 6h lead time across all surface variables of IFS-HRES 2022. Additionally, the results also hold on wind speed, which is a nonlinear function of 10U and 10V.
Bigger models obtain lower validation loss for the same amount of GPU hours. We fit a power law that indicates a 5% reduction in the validation loss for every doubling of the model size.
Figure 3: Pretraining on diverse data and increasing model size improves performance. (a) Performance versus ERA5 2021 at 6h lead time for models pretrained on different dataset configurations (i.e., no fine-tuning) labeled by C1-C4. The root mean square errors (RMSEs) are normalized by the performance of the ERA5-pretrained model (C1). Adding low-fidelity simulation data from CMIP6 (i.e., CMCC and IFS-HR) improves performance almost uniformly (C2). Adding even more simulation data improves performance further on most surface variables and for the atmospheric levels present in this newly added data (C3). Finally, configuration C4, which contains good coverage of the entire atmosphere and also contains analysis data from GFS achieves the best overall performance with improvements across the board. (b) Pretraining on many diverse data sources improves the forecasting of extreme values at 6h lead time across all surface variables of IFS-HRES 2022. Additionally, the results also hold on wind speed, which is a nonlinear function of 10U and 10V. (c) Bigger models obtain lower validation loss for the same amount of GPU hours. We fit a power law that roughly translates into a 5 reduction in the training loss for every doubling of the model size.

A direct consequence of Aurora’s scale, both in terms of architecture design and training data corpus, as well as its pretraining and fine-tuning protocols, is its superior performance over the best specialized deep learning models. As an additional validation of the benefits of fine-tuning a large model pretrained on many datasets, we compare Aurora against GraphCast — pretrained only on ERA5 and currently considered the most skillful AI model at 0.25-degree resolution and lead times up to five days. Additionally, we include IFS HRES in this comparison, the gold standard in numerical weather prediction. We show that Aurora outperforms both when measured against analysis, weather station observations, and extreme values. 

Scorecard versus GraphCast at 0.25-degrees resolution. Aurora matches or outperforms GraphCast on 94% of targets. Aurora obtains the biggest gains (40%) over GraphCast in the upper atmosphere, where GraphCast performance is known to be poor. Large improvements up to 10-15% are observed at short and long lead times. The two models are closest to each other in the lower atmosphere at the 2--3 day lead time, which corresponds to the lead time GraphCast was rollout-finetuned on. At the same time, GraphCast shows slightly better performance up to five days and at most levels on specific humidity (Q).
Root mean square error (RMSE) for Aurora, GraphCast, and IFS-HRES as measured by global weather stations during 2022 for wind speed and surface temperature.
Thresholded RMSE for Aurora, GraphCast and IFS-HRES normalized by IFS-HRES performance. Aurora demonstrates improved prediction for the extreme values, or tails, of the surface variable distributions. In each plot values to the right of the centre line are cumulative RMSEs for targets found to sit above the threshold, and those to the left represent target values sitting below the threshold.
Figure 4: Aurora outperforms operational GraphCast across the vast majority of targets. (a) Scorecard versus GraphCast at 0.25-degrees resolution. Aurora matches or outperforms GraphCast on 94% of targets. Aurora obtains the biggest gains (40%) over GraphCast in the upper atmosphere, where GraphCast performance is known to be poor. Large improvements up to 10%-15% are observed at short and long lead times. The two models are closest to each other in the lower atmosphere at the 2-3 day lead time, which corresponds to the lead time GraphCast was rollout-finetuned on. At the same time, GraphCast shows slightly better performance up to five days and at most levels on specific humidity (Q). (b) Root mean square error (RMSE) and mean absolute error (MAE) for Aurora, GraphCast, and IFS-HRES as measured by global weather stations during 2022 for wind speed (left two panels) and surface temperature (right two panels). (c) Thresholded RMSE for Aurora, GraphCast and IFS-HRES normalized by IFS-HRES performance. Aurora demonstrates improved prediction for the extreme values, or tails, of the surface variable distributions. In each plot values to the right of the center line are cumulative RMSEs for targets found to sit above the threshold, and those to the left represent target values sitting below the threshold.

A paradigm shift in Earth system modeling 

The implications of Aurora extend far beyond atmospheric forecasting. By demonstrating the power of foundation models in the Earth sciences, this research paves the way for the development of comprehensive models that encompass the entire Earth system. The ability of foundation models to excel at downstream tasks with scarce data could democratize access to accurate weather and climate information in data-sparse regions, such as the developing world and polar regions. This could have far-reaching impacts on sectors like agriculture, transportation, energy harvesting, and disaster preparedness, enabling communities to better adapt to the challenges posed by climate change. 

As the field of AI-based environmental prediction evolves, we hope Aurora will serve as a blueprint for future research and development. The study highlights the importance of diverse pretraining data, model scaling, and flexible architectures in building powerful foundation models for the Earth sciences. With continued advancements in computational resources and data availability, we can envision a future where foundation models like Aurora become the backbone of operational weather and climate prediction systems, providing timely, accurate, and actionable insights to decision-makers and the public worldwide. 

Acknowledgements

We are grateful for the contributions of Cristian Bodnar, a core contributor to this project.

The post Introducing Aurora: The first large-scale foundation model of the atmosphere appeared first on Microsoft Research.

Read More