Throughout the pandemic, the Alexa team has continued to invent on behalf of our customers.Read More
Now Hear This: Startup Gives Businesses a New Voice
Got a conflict with your 2pm appointment? Just spin up a quick assistant that takes good notes and when your boss asks about you even identifies itself and explains why you aren’t there.
Nice fantasy? No, it’s one of many use cases a team of some 50 ninja programmers, AI experts and 20 beta testers is exploring with Dasha. And they’re looking for a few good developers to join a beta program for the product that shows what’s possible with conversational AI on any device with a mic and a speaker.
“Conversational AI is going to be [seen as] the biggest paradigm shift of the last 40 years,” the chief executive and co-founder of Dasha, Vlad Chernyshov, wrote in a New Year’s tweet.
Using the startup’s software, its partners are already creating cool prototypes that could help make that prediction come true.
For example, a bank is testing Dasha to create a self-service support line. And the developer of a popular console game is using it to create an in-game assistant that players can consult via a smartwatch on their character’s wrist.
Custom Conversations Created Quickly
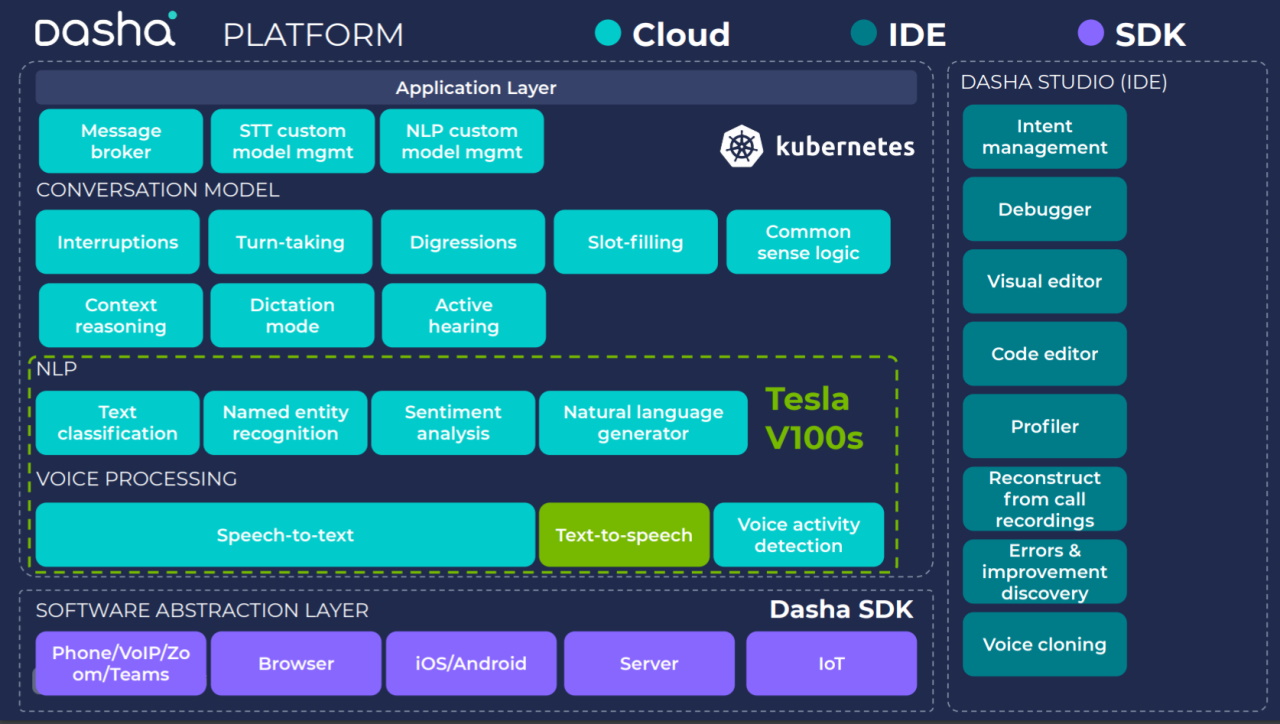
Dasha’s development tool lets an average IT developer use familiar library calls to design custom dialogs for any business process. They can tap into the startup’s unique capabilities in speech recognition, synthesis and natural-language processing running on NVIDIA GPUs in the cloud.
“We built all the core technology in house because today’s alternatives have too high a latency, the voice does not sound natural or the level of controls is not flexible enough for what customers want to do,” Chernyshov said.
The startup prides itself on its software that both creates and understands speech with natural inflections of emotion, breathing—even the “ums” and “ahs” that pepper real conversations. That level of fluency is helping early users get better responses from programs like Dasha Delight that automates post-sales satisfaction surveys.
Delighting Customers with Conversational AI
A bank that caters to small businesses gave Delight to its two-person team handling customer satisfaction surveys. With automated surveys, they covered more customers and even developed a process to respond to complaints, sometimes with problem fixes in less than an hour.
Separately, the startup developed a smartphone app called Dasha Assistant. It uses conversational AI to screen out unwanted sales calls but put through others like the pizza man confirming an order.
Last year, the company even designed an app to automate contact tracing for COVID-19.
An Ambitious Mission in AI
While one team of developers pioneers such new use cases, a separate group of researchers at Dasha pushes the envelope in realistic speech synthesis.
“We have a mission of going after artificial general intelligence, the ability for computers to understand like humans do, which we believe comes through developing systems that speak like humans do because speech is so closely tied to our intelligence,” said Chernyshov.
Below: Chernyshov demos a customer service experience with Dasha’s conversational AI.
He’s had a passion for dreaming big ideas and coding them up since 2007. That’s when he built one of the first instant messaging apps for Android at his first startup while pursuing his computer science degree in the balmy southern Siberian city of Novosibirsk, in Russia.
With no venture capital community nearby, the startup died, but that didn’t stop a flow of ideas and prototypes.
By 2017 Chernyshov learned how to harness AI and wrote a custom program for a construction company. It used conversational AI to automate the work of seeking a national network of hundreds of dealers.
“We realized the main thing preventing mainstream adoption of conversational AI was that most automated systems were really stupid and nobody was focused on making them comfortable and natural to talk with,” he said.
A 7x Speed Up With GPUs
To get innovations to the market quickly, Dasha runs all AI training and inference work on NVIDIA A100 Tensor Cores and earlier generation GPUs.
The A100 trains Dasha’s latest models for speech synthesis in a single day, 7x faster than previous-generation GPUs. In one of its experiments, Dasha trained a Transformer model 1.85x faster using four A100s than with eight V100 GPUs.
“We would never get here without NVIDIA. Its GPUs are an industry standard, and we’ve been using them for years on AI workflows,” he said.
NVIDIA software also gives Dasha traction. The startup eases the job of running AI in production with TensorRT, NVIDIA code that can squeeze the super-sized models used in conversational AI so they deliver inference results faster with less memory and without losing accuracy.
Mellotron, a model for speech synthesis developed by NVIDIA, gave Dasha a head start creating its custom neural networks for fluent systems.
“We’re always looking for better model architecture to do faster inference and speech synthesis, and Mellotron is superior to other alternatives,” he said.
Now, Chernyshov is looking for a few ninja programmers in a handful of industries he wants represented in the beta program for Dasha. “We want to make sure every sector gets a voice,” he quipped.
The post Now Hear This: Startup Gives Businesses a New Voice appeared first on The Official NVIDIA Blog.
How fact checkers and Google.org are fighting misinformation
Misinformation can have dramatic consequences on people’s lives — from finding reliable information on everything from elections to vaccinations — and the pandemic has only exacerbated the problem as accurate information can save lives. To help fight the rise in minsformation, Full Fact, a nonprofit that provides tools and resources to fact checkers, turned to Google.org for help. Today, ahead of International Fact Checking Day, we’re sharing the impact of this work.
Every day, millions of claims, like where to vote and COVID-19 vaccination rates, are made across a multitude of platforms and media. It was becoming increasingly difficult for fact checkers to identify the most important claims to investigate.
We’re not just fighting an epidemic; we’re fighting an infodemic. Fake news spreads faster and more easily than this virus and is just as dangerous.Tedros Adhanom
Director General of the World Health Organization
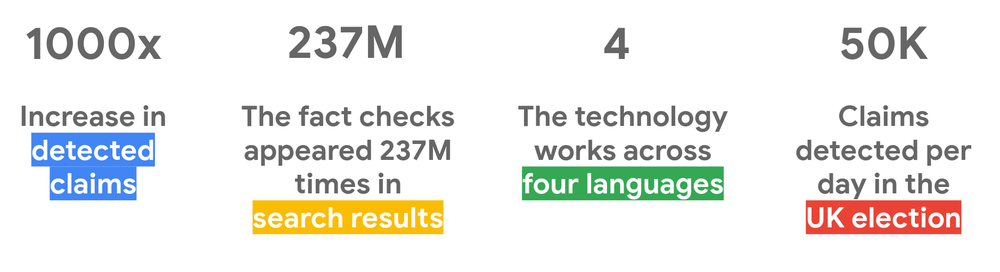
Last year, Google.org provided Full Fact with $2 million and seven Googlers from the Google.org Fellowship, a pro-bono program that matches teams of Googlers with nonprofits for up to six months to work full-time on technical projects. The Fellows helped Full Fact build AI tools to help fact checkers detect claims made by key politicians, then group them by topic and match them with similar claims from across press, social networks and even radio using speech to text technology. Over the past year, Full Fact boosted the amount of claims they could process by 1000x, detecting and clustering over 100,000 claims per day — that’s more than 36.5 million total claims per year!
The AI-powered tools empower fact checkers to be more efficient, so that they can spend more time actually checking and debunking facts rather than identifying which facts to check. Using a machine learning BERT-based model, the technology now works across four languages (English, French, Portuguese and Spanish). And Full Fact’s work has expanded to South Africa, Nigeria, Kenya with their partner Africa Check and Argentina with Chequeado. In total in 2020, Full Fact’s fact checks appeared 237 million times across the internet.
If you’re interested in learning more about how you can use Google to fact check and spot misinformation, check out some of our tips and tricks. Right now more than ever we need to empower citizens to find reliable authoritative information, and we’re excited about the impact that Full Fact and its partners have had in making the internet a safer place for everyone.
Art and Music in Light of AI
In the sea of virtual exhibitions that have popped up over the last year, the NVIDIA AI Art Gallery offers a fresh combination of incredible visual art, musical experiences and poetry, highlighting the narrative of an emerging art form based on AI technology.
The online exhibit — part of NVIDIA’s GTC event — will feature 13 standout artists from around the world who are pioneering the use of AI within their respective fields in music, visual arts and poetry.
The exhibit complements what has become the world’s premier AI conference. GTC, running April 12-16, bringing together researchers from industry and academia, startups and Fortune 500 companies.
A Uniquely Immersive Experience
Unlike other virtual galleries that only depict the artist’s final piece, the AI Art Gallery is a uniquely immersive experience. Visitors can explore each artist’s creative process, the technologies used to bring their creations to life, and the finished works that shine new light on AI’s potential.
In addition to artists from last year’s AI Art Gallery, including Daniel Ambrosi, Helena Sarin, Pindar Van Arman, Refik Anadol, Scott Eaton, and Sofia Crespo and Entangled Others, next month’s exhibition features these prominent artists:
- AIVA (music) – Pierre Barreau and Denis Shtefan, co-founders of Paris-based AI music startup AIVA, combine their computer science and musical composition training to generate personalized soundtracks using AI.
- Allison Parrish (poet) – Parrish is a computer programmer, poet and educator whose “poetry bots,” sit at the intersection of creativity, language and AI.
- Dadabots + Keyon Christ (music) – Music and hacker duo CJ Carr and Zack Zuckowski utilize deep learning algorithms based on large datasets of recorded music to generate expressions of sound that have never existed, yet imply the sounds of soul music. Artist and producer Keyon Christ, formerly known as Mitus, rings his instantly recognizable sound to the tracks generated by Dadabots’ AI.
- 64/1 + Harshit Agrawal (visual art) – Brothers Karthik Kalyanaraman and Raghava KK joined with Bangalore-based Harshit Agrawal to create artwork that combines their backgrounds in social studies, art, and emerging technologies. Their project, Strange Genders work, uses AI to understand and showcase how people of India represent gender visually.
- Holly Herndon (music) – Herdon and Matt Dryhurst used deep learning to develop a voice synthesizer, combining a large corpora of voices — an entirely new approach in composition.
- Nao Tokui + Qosmo (music) – In their project, “Neural Beatbox” Japanese artists Tokui and Qosmo use AI’s somewhat unpredictable behaviors to invite visitors to think and create outside of the box.
- Stephanie Dinkins (visual art) – Best described as a transmedia artist, Dinkins creates experiences that spark dialogue about race, gender, aging, and future histories.
Attendees of GTC, which has free registration, will have the opportunity to interact with the artists in panel discussions and workshops. Session highlights include:

Panels and Talks
- AI Representing Natural Forms – April 14, 11 a.m. PT
- Join a discussion with artists Sofia Crespo, Feilican McCormick, Anna Ridler and Daniel Ambrosi to explore how they use AI in their creative process of generating interpretations of natural forms. NVIDIA Technical Specialist Chris Hebert moderates.*
- Art in Light of AI – April 13, 8 a.m. PT
- In a discussion led by media artist Refik Anadol, a panel of artists from around the globe, including Harshit Agrawal, Scott Eaton and Helena Sarin, will compare how they combine their fine art backgrounds with their futuristic art practices.
- DADABOTS: Artisanal Machine Funk, Generative Black Metal – April 12, 10 a.m. PT
- Moderated by NVIDIA Senior Engineer Omer Shapira, this panel will feature creators and users of electronic instruments that rely on deep learning for their performance — whether to create entirely new sounds and music from existing recordings or to give the music playing a human form.
- Using AI to Shape the Language of a Generation – April 12, 12 p.m. PT
- Join a discussion of how language in the age of AI takes on new forms and tells new stories with Allison Parrish, Stephanie Dinkins and Pindar Van Arman, moderated by NVIDIA’s Heather Schoell.
Workshops
- Beatbox with Nao Tokui – April 15, 5 p.m. PT
- Nao Tokui, an artist and researcher based in Japan, will lead a beatbox-making workshop using his web-based app, Neural Beatbox.
- Music-Making with AIVA – April 14, 9 a.m. PT
- Join the team from AIVA, who’ll lead a music-making workshop using their web-based music app.
Register to join us at GTC April 12-16, and enjoy the AI Art Gallery and related sessions.
The post Art and Music in Light of AI appeared first on The Official NVIDIA Blog.
Drum Roll, Please: AI Startup Sunhouse Founder Tlacael Esparza Finds His Rhythm
Drawing on his trifecta of degrees in math, music and music technology, Tlacael Esparza, co-founder and CTO of Sunhouse, is revolutionizing electronic drumming.
Esparza has created Sensory Percussion, a combination of hardware and software that uses sensors and AI to allow a single drum to produce a complex range of sounds depending on where and how the musician hits it.
In the latest installment of the NVIDIA AI Podcast, Esparza spoke with host Noah Kravitz about the tech behind the tool, and what inspired him to create Sunhouse. Esparza has been doing drumstick tricks of his own for many years — prior to founding Sunhouse, he toured with a variety of bands and recorded drums for many albums.
Esparza’s musical skill and programming knowledge formed the basis for Sensory Percussion. Partnering with his brother, Tenoch, and with support from a New York University startup accelerator, Sunhouse was born in 2014.
Since then, it’s become successful with live performers. Esparza is especially proud of its popularity in the New York jazz community and among drumming legends like Marcus Gilmore and Wilco’s Glenn Kotche.
Esparza and Sunhouse customers will be marching to the beat of his drum far into the future — he hints at more musical tech to come.
Key Points From This Episode:
- Esparza was exposed to the idea of applying deep learning techniques to audio processing while earning his master’s at NYU. He studied under Juan Bello, who is responsible for much of the foundational work on music information retrieval techniques, and audited courses from AI pioneer Yann LeCun.
- One of Esparza’s goals with Sensory Percussion was to bridge the gap between engineers and musicians. He points out that software is often extremely powerful but complex or easy to use but limited. Sunhouse technology is designed to be an accessible intermediary.
Tweetables:
“It’s about capturing that information and allowing you to use it to translate all that stuff into this electronic realm” — Tlacael Esparza [6:20]
“[Sensory Percussion] ended up actually getting utilized by musicians as more of a full-on composition tool to write and perform entire pieces of music.” — Tlacael Esparza [24:10]
You Might Also Like:
Pierre Barreau Explains How Aiva Uses Deep Learning to Make Music
AI systems have been trained to take photos and transform them into the style of great artists, but now they’re learning about music. Pierre Barreau, head of Luxembourg-based startup Aiva Technologies, talks about the soaring music composed by an AI system and featured on this podcast.
How SoundHound Uses AI to Bring Voice and Music Recognition to Any Platform
SoundHound has leveraged its decade of experience in data analytics to create a voice recognition tool that companies can bake into any product. Mike Zagorsek, SoundHound’s vice president of product marketing, talks about how the company has grown into a major player in voice-driven AI.
Pod Squad: Descript Uses AI to Make Managing Podcasts Quicker, Easier
Serial entrepreneur Andrew Mason is making podcast editing easier and more collaborative with his company, Descript Podcast Studio, which uses AI, natural language processing and automatic speech synthesis.
Tune in to the AI Podcast
Get the AI Podcast through iTunes, Google Podcasts, Google Play, Castbox, DoggCatcher, Overcast, PlayerFM, Pocket Casts, Podbay, PodBean, PodCruncher, PodKicker, Soundcloud, Spotify, Stitcher and TuneIn. If your favorite isn’t listed here, drop us a note.


![]()
Make the AI Podcast Better
Have a few minutes to spare? Fill out this listener survey. Your answers will help us make a better podcast.
The post Drum Roll, Please: AI Startup Sunhouse Founder Tlacael Esparza Finds His Rhythm appeared first on The Official NVIDIA Blog.
How Digitata provides intelligent pricing on mobile data and voice with Amazon Lookout for Metrics
This is a guest post by Nico Kruger (CTO of Digitata) and Chris King (Sr. ML Specialist SA at AWS). In their own words, “Digitata intelligently transforms pricing and subscriber engagement for mobile operators, empowering operators to make better and more informed decisions to meet and exceed business objectives.”
As William Gibson said, “The future is here. It’s just not evenly distributed yet.” This is incredibly true in many emerging markets for connectivity. Users often pay 100 times more for data, voice, and SMS services than their counterparts in Europe or the US. Digitata aims to better democratize access to telecommunications services through dynamic pricing solutions for mobile network operators (MNOs) and to help deliver optimal returns on their large capital investments in infrastructure.
Our pricing models are classically based on supply and demand. We use machine learning (ML) algorithms to optimize two main variables: utilization (of infrastructure), and revenue (fees for telco services). For example, at 3:00 AM when a tower is idle, it’s better to charge a low rate for data than waste this fixed capacity and have no consumers. Comparatively, for a very busy tower, it’s prudent to raise the prices at certain times to reduce congestion, thereby reducing the number of dropped calls or sluggish downloads for customers.
Our models attempt to optimize utilization and revenue according to three main features, or dimensions: location, time, and user segment. Taking the traffic example further, the traffic profile over time for a tower located in a rural or suburban area is very different from a tower in a central downtown district. In general, the suburban tower is busier early in the mornings and later at night than the tower based in the central business district, which is much busier during traditional working hours.
Our customers (the MNOs) trust us to be their automated, intelligent pricing partner. As such, it’s imperative that we keep on top of any anomalous behavior patterns when it comes to their revenue or network utilization. If our model charges too little for data bundles (or even makes it free), it could lead to massive network congestion issues as well as the obvious lost revenue impact. Conversely, if we charge too much for services, it could lead to unhappy customers and loss of revenue, through the principles of supply and demand.
It’s therefore imperative that we have a robust, real-time anomaly detection system in place to alert us whenever there is anomalous behavior on revenue and utilization. It also needs to be aware of the dimensions we operate under (location, user segment, and time).
History of anomaly detection at Digitata
We have been through four phases of anomaly detection at Digitata in the last 13 years:
- Manually monitoring our KPIs in reports on a routine basis.
- Defining routine checks using static thresholds that alert if the threshold is exceeded.
- Using custom anomaly detection models to track basic KPIs over time, such as total unique customers per tower, revenue per GB, and network congestion.
- Creating complex collections of anomaly detection models to track even more KPIs over time.
Manual monitoring continued to grow to consume more of our staff hours and was the most error-prone, which led to the desire to automate in Phase 2. The automated alarms with static alert thresholds ensured that routine checks were actually and accurately performed, but not with sufficient sophistication. This led to alert fatigue, and pushed us to custom modeling.
Custom modeling can work well for a simple problem, but the approach for one particular problem doesn’t translate perfectly to the next problem. This leads to a number of models that must be operating in the field to provide relevant insights. The operational complexity of orchestrating these begins to scale beyond the means of our in-house developers and tooling. The cost of expansion also prohibits other teams from running experiments and identifying other opportunities for us to leverage ML-backed anomaly detection.
Additionally, although you can now detect anomalies via ML, you still need to do frequent deep-dive analysis to find other combinations of dimensions that may point to underlying anomalies. For example, when a competitor is strongly targeting a certain location or segment of users, it may have an adverse impact on sales that may not necessarily be reflected, depending on how deep you have set up your anomaly detection models to actively track the different dimensions.
The problem that remains to be solved
Given our earlier problem statement, it means that we have, at least, the following dimensions under which products are being sold:
- Thousands of locations (towers).
- Hundreds of products and bundles (different data bundles such as social or messaging).
- Hundreds of customer segments. Segments are based on clusters of users according to hundreds of attributes that are system calculated from MNO data feeds.
- Hourly detection for each day of the week.
We can use traditional anomaly detection methods to have anomaly detection on a measure, such as revenue or purchase count. We don’t, however, have the necessary insights on a dimension-based level to answer questions such as:
- How is product A selling compared to product B?
- What does revenue look like at location A vs. location B?
- What do sales look like for customer segment A vs. customer segment B?
- When you start combining dimensions, what does revenue look like on product A, segment A, vs. product A, segment B; product B, segment A; and product B, segment B?
The number of dimensions quickly add up. It becomes impractical to create anomaly detection models for each dimension and each combination of dimensions. And that is only with the four dimensions mentioned! What if we want to quickly add two or three additional dimensions to our anomaly detection systems? It requires time and resource investment, even to use existing off-the-shelf tools to create additional anomaly models, notwithstanding the weeks to months of investment required to build it in-house.
That is when we looked for a purpose-built tool to do exactly this, such as the dimension-aware managed anomaly detection service, Amazon Lookout for Metrics.
Amazon Lookout for Metrics
Amazon Lookout for Metrics uses ML to automatically detect and diagnose anomalies (outliers from the norm) in business and operational time series data, such as a sudden dip in sales revenue or customer acquisition rates.
In a couple of clicks, you can connect Amazon Lookout for Metrics to popular data stores like Amazon Simple Storage Service (Amazon S3), Amazon Redshift, and Amazon Relational Database Service (Amazon RDS), as well as third-party SaaS applications, such as Salesforce, ServiceNow, Zendesk, and Marketo, and start monitoring metrics that are important to your business.
Amazon Lookout for Metrics automatically inspects and prepares the data from these sources and builds a custom ML model—informed by over 20 years of experience at Amazon—to detect anomalies with greater speed and accuracy than traditional methods used for anomaly detection. You can also provide feedback on detected anomalies to tune the results and improve accuracy over time. Amazon Lookout for Metrics makes it easy to diagnose detected anomalies by grouping together anomalies that are related to the same event and sending an alert that includes a summary of the potential root cause. It also ranks anomalies in order of severity so that you can prioritize your attention to what matters the most to your business.
How we used Amazon Lookout for Metrics
Inside Amazon Lookout for Metrics, you need to describe your data in terms of measures and dimensions. Measures are variables or key performance indicators on which you want to detect anomalies, and dimensions are metadata that represent categorical information about the measures.
To detect outliers, Amazon Lookout for Metrics builds an ML model that is trained with your source data. This model, called a detector, is automatically trained with the ML algorithm that best fits your data and use case. You can either provide your historical data for training, if you have any, or get started with real-time data, and Amazon Lookout for Metrics learns as it goes.
We used Amazon Lookout for Metrics to convert our anomaly detection tracking on two of our most important datasets: bundle revenue and voice revenue.
For bundle revenue, we track the following measures:
- Total revenue from sales
- Total number of sales
- Total number of sales to distinct users
- Average price at which the product was bought
Additionally, we track the following dimensions:
- Location (tower)
- Product
- Customer segment
For voice revenue, we track the following measures:
- Total calls made
- Total revenue from calls
- Total distinct users that made a call
- The average price at which a call was made
Additionally, we track the following dimensions:
- Location (tower)
- Type of call (international, on-net, roaming, off-net)
- Whether the user received a discount or not
- Customer spend
This allows us to have coverage on these two datasets, using only two anomaly detection models with Amazon Lookout for Metrics.
Architecture overview
Apache Nifi is an open-source data flow tool that we use for ETL tasks, both on premises and in AWS. We use it as a main flow engine for parsing, processing, and updating data we receive from the mobile network. This data ranges from call records, data usage records, airtime recharges, to network tower utilization and congestion information. This data is fed into our ML models to calculate the price on a product, location, time, and segment basis.
The following diagram illustrates our architecture.
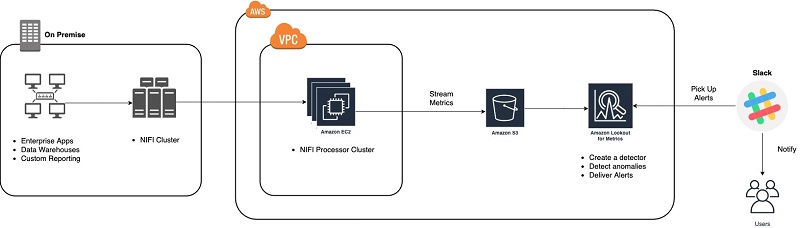
Because of the reality of the MNO industry (at the moment), it’s not always possible for us to leverage AWS for all of our deployments. Therefore, we have a mix of fully on-premises, hybrid, and fully native cloud deployments.
We use a setup where we leverage Apache Nifi, connected from AWS over VPC and VPN connections, to pull anonymized data on an event-based basis from all of our deployments (regardless of type) simultaneously. The data is then stored in Amazon S3 and in Amazon CloudWatch, from where we can use services such as Amazon Lookout for Metrics.
Results from our experiments
While getting to know Amazon Lookout for Metrics, we primarily focused the backtesting functionality within the service. This feature allows you to supply historical data, have Amazon Lookout for Metrics train on a large portion of your early historical data, and then identify anomalies in the remaining, more recent data.
We quickly discovered that this has massive potential, not only to start learning the service, but also to gather insights as to what other opportunities reside within your data, which you may have never thought of, or always expected to be there but never had the time to investigate.
For example, we quickly found the following very interesting example with one of our customers. We were tracking voice revenue as the measure, under the dimensions of call type (on-net, off-net, roaming), region (a high-level concept of an area, such as a province or big city), and timeband (after hours, business hours, weekends)
Amazon Lookout for Metrics identified an anomaly on international calls in a certain region, as shown in the following graph.
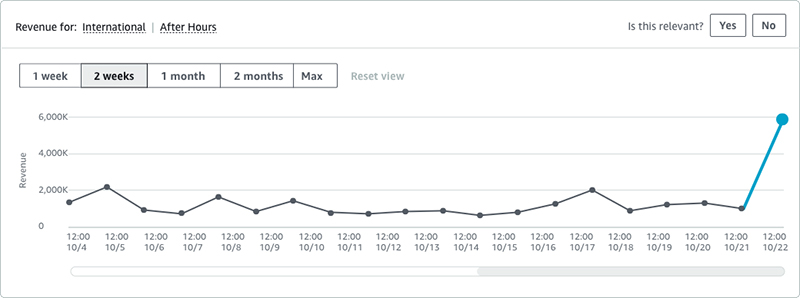
We quickly went to our source data, and saw the following visualization.
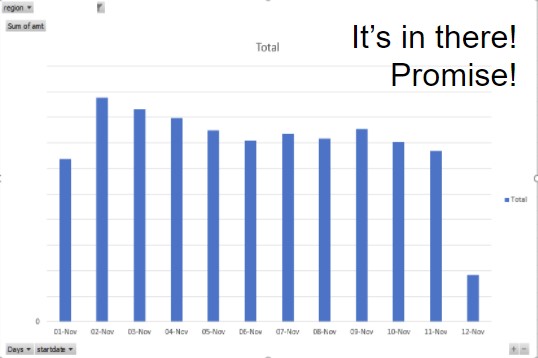
This graph looks at the total revenue for the days for international calls. As you can see, when looking at the global revenue, there is no real impact of the sort that Amazon Lookout for Metrics identified.
But when looking at the specific region that was identified, you see the following anomaly.
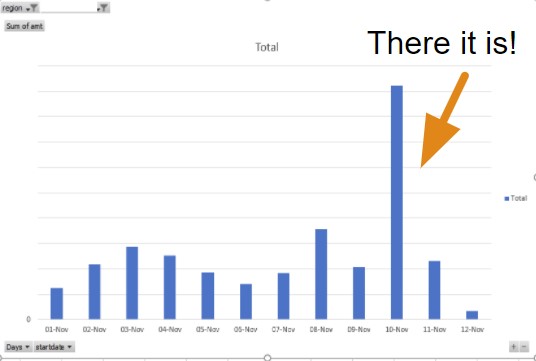
A clear spike in international calls took place on this day, in this region. We looked deeper into it and found that the specific city identified by this region is known as a tourist and conference destination. This begs the question: is there any business value to be found in an insight such as this? Can we react to anomalies like these in real time by using Amazon Lookout for Metrics and then providing specific pricing specials on international calls in the region, in order to take advantage of the influx of demand? The answer is yes, and we are! With stakeholders alerted to these notifications for future events and with exploratory efforts into our recent history, we’re prepared for future issues and are becoming more aware of operational gaps in our past.
In addition to the exploration using the back testing feature (which is still ongoing as of this writing), we also set up real-time detectors to work in parallel with our existing anomaly detection service.
Within two days, we found our first real operational issue, as shown in the following graph.
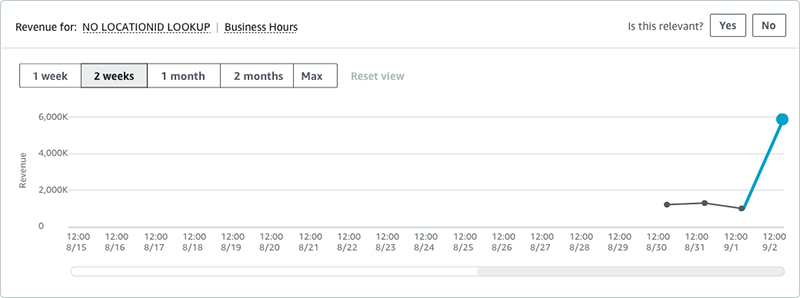
The graph shows revenue attributed to voice calls in another customer. In this case, we had a clear spike in our catchall NO LOCATION LOOKUP region. We map revenue from the towers to regions (such as city, province, or state) using a mapping table that we periodically refresh from within the MNO network, or by receiving such a mapping from the MNO themselves. When a tower isn’t mapped correctly by this table, it shows up as this catchall region in our data. In this case, there was a problem with the mapping feed from our customer.
The effect was that the number of towers that could not be classified was slowly growing. This could affect our pricing models, which could become less accurate at factoring the location aspect when generating the optimal price.
A very important operational anomaly to detect early!
Digitata in the future
We’re constantly evolving our ML and analytics capabilities, with the end goal of making connectivity more affordable for the entire globe. As we continue on this journey, we look to services such as Amazon Lookout for Metrics to help us ensure the quality of our services, find operational issues, and identify opportunities. It has made a dramatic difference in our anomaly detection capabilities, and has pointed us to some previously undiscovered opportunities. This all allows us to work on what really matters: getting everyone connected to the wonder of the internet at affordable prices!
Getting started
Amazon Lookout for Metrics is now available in preview in US East (N. Virginia), US East (Ohio), US West (Oregon), Asia Pacific (Tokyo), and Europe (Ireland). Request preview access to get started today!
You can interact with the service using the AWS Management Console, the AWS SDKs, and the AWS Command Line Interface (AWS CLI). For more information, see the Amazon Lookout for Metrics Developer Guide.
About the Authors
Nico Kruger is the CTO of Digitata and is a fan of programming computers, reading things, listening to music, and playing games. Nico has 10+ years experience in telco. In his own words: “From C++ to Javascript, AWS to on-prem, as long as the tool is fit for the job, it works and the customer is happy; it’s all good. Automate all the things, plan for failure and be adaptable and everybody wins.”
Chris King is a Senior Solutions Architect in Applied AI with AWS. He has a special interest in launching AI services and helped grow and build Amazon Personalize and Amazon Forecast before focusing on Amazon Lookout for Metrics. In his spare time, he enjoys cooking, reading, boxing, and building models to predict the outcome of combat sports.
Rust detection using machine learning on AWS
Visual inspection of industrial environments is a common requirement across heavy industries, such as transportation, construction, and shipbuilding, and typically requires qualified experts to perform the inspection. Inspection locations can often be remote or in adverse environments that put humans at risk, such as bridges, skyscrapers, and offshore oil rigs.
Many of these industries deal with huge metal surfaces and harsh environments. A common problem across these industries is metal corrosion and rust. Although corrosion and rust are used interchangeably across different industries (we also use the terms interchangeably in this post), these two phenomena are different. For more details about the differences between corrosion and rust as well as different degrees of such damages, see Difference Between Rust and Corrosion and Stages of Rust.
Different levels and grades of rust can also result in different colors for the damaged areas. If you have enough images of different classes of rust, you can use the techniques described in this post to detect different classes of rust and corrosion.
Rust is a serious risk for operational safety. The costs associated with inadequate protection against corrosion can be catastrophic. Conventionally, corrosion detection is done using visual inspection of structures and facilities by subject matter experts. Inspection can involve on-site direct interpretation or the collection of pictures and the offline interpretation of them to evaluate damages. Advances in the fields of computer vision and machine learning (ML) makes it possible to automate corrosion detection to reduce the costs and risks involved in performing such inspections.
In this post, we describe how to build a serverless pipeline to create ML models for corrosion detection using Amazon SageMaker and other AWS services. The result is a fully functioning app to help you detect metal corrosion.
We will use the following AWS services:
- Amazon API Gateway is a fully managed service that makes it easy for developers to create, publish, maintain, monitor, and secure APIs at any scale.
- AWS Lambda is a compute service that lets you run code without provisioning or managing servers. Lambda runs your code only when triggered and scales automatically, from a few requests per day to thousands per second.
- Amazon SageMaker is a fully managed service that provides developers and data scientists the tools to build, train, and deploy different types of ML models.
- AWS Step Functions allows you to coordinate several AWS services into a serverless workflow. You can design and run workflows where the output of one step acts as the input to the next step while embedding error handling into the workflow.
Solution overview
The corrosion detection solution comprises a React-based web application that lets you pick one or more images of metal corrosion to perform detection. The application lets you train the ML model and deploys the model to SageMaker hosting services to perform inference.
The following diagram shows the solution architecture.

The solution supports the following use cases:
- Performing on-demand corrosion detection
- Performing batch corrosion detection
- Training ML models using Step Functions workflows
The following are the steps for each workflow:
- On-demand corrosion detection – An image picked by the application user is uploaded to an Amazon Simple Storage Service (Amazon S3) bucket. The image S3 object key is sent to an API deployed on API Gateway. The API’s Lambda function invokes a SageMaker endpoint to detect corrosion in the image uploaded, and generates and stores a new image in an S3 bucket, which is further rendered in the front end for analysis.
- Batch corrosion detection – The user uploads a .zip file containing images to an S3 bucket. A Lambda function configured as an Amazon S3 trigger is invoked. The function performs batch corrosion detection by performing an inference using the SageMaker endpoint. Resulting new images are stored back in Amazon S3. These images can be viewed in the front end.
- Training the ML model – The web application allows you to train a new ML model using Step Functions and SageMaker. The following diagram shows the model training and endpoint hosting orchestration. The Step Functions workflow is started by invoking the
StartTrainingJobAPI supported by the Amazon States Language. After a model has been created, theCreateEndpointAPI of SageMaker is invoked, which creates a new SageMaker endpoint and hosts the new ML model. A checkpoint step ensures that the endpoint is completely provisioned before ending the workflow.

Machine learning algorithm options
Corrosion detection is conventionally done by trained professionals using visual inspection. In challenging environments such as offshore rigs, visual inspection can be very risky. Automating the inspection process using computer vision models mounted on drones is a helpful alternative. You can use different ML approaches for corrosion detection. Depending on the available data and application objectives, you could use deep learning (including object detection or semantic segmentation) or color classification, using algorithms such as Extreme Gradient Boosting (XGBoost). We discuss both approaches in this post, with an emphasis on XGBoost method, and cover advantages and limitations of both approaches. Other methods such as unsupervised clustering might also be applicable, but aren’t discussed in this post.
Deep learning approach
In recent years, deep learning has been used for automatic corrosion detection. Depending on the data availability and the type of labeling used, you can use object detection or semantic segmentation to detect corroded areas in metal structures. Although deep learning techniques are very effective for numerous use cases, the complex nature of corrosion detection (the lack of specific shapes) sometimes make deep learning methods less effective for detecting corroded areas.
We explain in more detail some of the challenges involved in using deep learning for this problem and propose an alternative way using a simpler ML method that doesn’t require the laborious labeling required for deep learning methods. If you have a dataset annotated using rectangular bounding boxes, you can use an object detection algorithm.
The most challenging aspect of this problem when using deep learning is that corroded parts of structures don’t have predictable shapes, which makes it difficult to train a comprehensive deep learning model using object detection or semantic segmentation. However, if you have enough annotated images, you can detect these random-looking patterns with reasonable accuracy. For instance, you can detect the corroded area in the following image (shown inside the red rectangle) using an object detection or semantic segmentation model with proper training and data.

The more challenging problem for performing corrosion detection using deep learning is the fact that the entire metal structure can often be corroded (as in the following image), and deep learning models confuse these corroded structures with the non-corroded ones because the edges and shapes of entirely corroded structures are similar to a regular healthy structure with no corrosion. This can be the case for any structure and not just limited to pipes.

Color classification approach (using the XGBoost algorithm)
Another way of looking at the corrosion detection problem is to treat it as a pixel-level color classification, which has shown promise over deep learning methods, even with small training datasets. We use a simple XGBoost method, but you can use any other classification algorithm (such as Random Forest).
The downside of this approach is that darker pixel colors in images can be mistakenly interpreted as corrosion. Lighting conditions and shadows might also affect the outcome of this approach. However, this method produced better-quality results compared to deep learning approaches because this method isn’t affected by the shape of structures or the extent of corrosion. Accuracy can be improved by using more comprehensive data.
If you require pixel-level interpretation of images, the other alternative is to use semantic segmentation, which requires significant labeling. Our proposed method offers a solution to avoid this tedious labeling.
The rest of this post focuses on using the color classification (using XGBoost) approach. We explain the steps required to prepare data for this approach and how to train such a model on SageMaker using the accompanying web application.
Create training and validation datasets
When using XGBoost, you have the option of creating training datasets from both annotated or manually cropped and non-annotated images. The color classification (XGBoost) algorithm requires that you extract the RGB values of each pixel in the image that has been labeled as clean or corroded.
We created Jupyter notebooks to help you create training and validation datasets depending on whether you’re using annotated or non-annotated images.
Create training and validation datasets for annotated images
When you have annotated images of corrosion, you can programmatically crop them to create smaller images so you have just the clean or corroded parts of the image. You reshape the small cropped images into a 2D array and stack them together to build your dataset. To ensure better-quality data, the following code further crops the small images to pick only the central portion of the image.
To help you get started quickly, we created a sample training dataset (5 MB) that you can use to create training and validation datasets. You can then use these datasets to train and deploy a new ML model. We created the sample training dataset from a few public images from pexels.com.
Let’s understand the process of creating a training dataset from annotated images. We created a notebook to help you with the data creation. The following are the steps involved in creating the training and validation data.
Crop annotated images
The first step is to crop the annotated images.
- We read all annotated images and the XML files containing the annotation information (such as bounding boxes and class name). See the following code:
xml_paths = get_file_path_list(xml_path)
images_names = list(set(get_filename_list(images_path)))
- Because the input images are annotated, we extract the class names and bounding boxes for each annotated image:
for idx, x in enumerate(xml_paths):
single_imgfile_path = images_path + '\'+ x.split('\')[-1].split('.')[0] +'.JPG'
image = Image.open(single_imgfile_path)
tree = ET.parse(x)
root = tree.getroot()
for idx2, rt in enumerate(root.findall('object')):
name = rt.find('name').text
if name in classes_to_use:
xmin = int(rt.find('bndbox').find('xmin').text)
ymin = int(rt.find('bndbox').find('ymin').text)
xmax = int(rt.find('bndbox').find('xmax').text)
ymax = int(rt.find('bndbox').find('ymax').text)
- For each bounding box in an image, we zoom in to the bounding box, crop the center portion, and save that in a separate file. We cut the bounding box by 1/3 of its size from each side, therefore taking 1/9 of the area inside the bounding box (its center). See the following code:
a = (xmax-xmin)/3.0 b = (ymax-ymin)/3.0 box = [int(xmin+a),int(ymin+b),int(xmax-a),int(ymax-b)] image1 = image.crop(box) - Finally, we save the cropped image:
image1.save('cropped_images_small/'+name+"-"+str(count)+".png", "PNG", quality=80, optimize=True, progressive=True)
It’s recommended to do a quick visual inspection of the cropped images to make sure they only contain either clean or corroded parts.
The following code shows the implementation for cropping the images (also available in section 2 of the notebook):
def crop_images(xml_path, images_path, classes_to_use):
# Crop objects of type given in "classes_to_use" from xml files with several
# objects in each file and several classes in each file

    if os.path.isdir("cropped_images_small"):
        shutil.rmtree('cropped_images_small')
        os.mkdir('cropped_images_small')
        print("Storing cropped images in cropped_images_small folder" )
    else:
        os.mkdir('cropped_images_small')
        print("Storing cropped images in cropped_images_small folder" )

    xml_paths = get_file_path_list(xml_path)
    images_names = list(set(get_filename_list(images_path)))
    count = 0
    for idx, x in enumerate(xml_paths):
        if '.DS_Store' not in x:
            single_imgfile_path = images_path + '\'+ x.split('\')[-1].split('.')[0] +'.JPG'
            image = Image.open(single_imgfile_path)
            tree = ET.parse(x)
            root = tree.getroot()
            for idx2, rt in enumerate(root.findall('object')):
                name = rt.find('name').text
                if name in classes_to_use:
                    xmin = int(rt.find('bndbox').find('xmin').text)
                    ymin = int(rt.find('bndbox').find('ymin').text)
                    xmax = int(rt.find('bndbox').find('xmax').text)
                    ymax = int(rt.find('bndbox').find('ymax').text)
                    a = (xmax-xmin)/3.0
                    b = (ymax-ymin)/3.0
                    box = [int(xmin+a),int(ymin+b),int(xmax-a),int(ymax-b)]
                    image1 = image.crop(box)
                    image1.save('cropped_images_small/'+name+"-"+str(count)+".png", "PNG", quality=80, optimize=True, progressive=True)
                    count+=1
Create the RGB DataFrame
After cropping and saving the annotated parts, we have many small images, and each image contains only pixels belonging to one class (Clean or Corroded). The next step in preparing the data is to turn the small images into a DataFrame.
- We first define the column names for the DataFrame that contains the class (Clean or Corroded) and the RGB values for each pixel.
- We define the classes to be used (in case we want to ignore other possible classes that might be present).
- For each cropped image, we reshape the image and extract RGB information into a new DataFrame.
- Finally, we save the final data frame into a .csv file.
See the following code:
37    crop_path = 'Path to your cropped images'
38    files = get_file_path_list(crop_path)
39
40    cols = ['class','R','G','B']
41    df = pd.DataFrame()
42
43    classes_to_use = ['Corroded','Clean']
44    dict1 = {'Clean': 0, 'Corroded': 1}
45    for file in files:
46        lbls = Image.open(file)
47        imagenp = np.asarray(lbls)
48        imagenp=imagenp.reshape(imagenp.shape[1]*imagenp.shape[0],3)
49        name = file.split('\')[-1].split('.')[0].split('-')[0]
50        classname = dict1[name]
51        dftemp = pd.DataFrame(imagenp)
52        dftemp.columns =['R','G','B']
53        dftemp['class'] = classname
54        columnsTitles=['class','R','G','B']
55        dftemp=dftemp.reindex(columns=columnsTitles)
56        df = pd.concat([df,dftemp], axis=0)
57
58    df.columns = cols
59    df.to_csv('data.csv', index=False)
In the end, we have a table containing labels and RGB values.

Create training and validation sets and upload to Amazon S3
After you prepare the data, you can use the code listed under section 4 of our notebook to generate the training and validation datasets. Before running the code in this section, make sure you enter the name of a S3 bucket in the bucket variable, for storing the training and validation data.
The following lines of code in the notebook define variables for the input data file name (FILE_DATA), the training/validation ratio (for this post, we use 20% of the data for validation, which leaves 80% for training) and the name of the generated training and validation data .csv files. You can choose to use the sample training dataset as the input data file or use the data file you generated by following the previous step and assigning it to the FILE_DATA variable.
FILE_DATA = 'data.csv'
TARGET_VAR = 'class'
FILE_TRAIN = 'train.csv'
FILE_VALIDATION = 'validation.csv'
PERCENT_VALIDATION = 20
Finally, you upload the training and validation data to the S3 bucket:
s3_train_loc = upload_to_s3(bucket = bucket, channel = 'train', filename = FILE_TRAIN)
s3_valid_loc = upload_to_s3(bucket = bucket, channel = 'validation', filename = FILE_VALIDATION)
Create a training dataset for manually cropped images
For creating the training and validation dataset when using manually cropping images, you should name your cropped images with the prefixes Corroded and Clean to be consistent with the implementation in the provided Jupyter notebook. For example, for the Corroded class, you should name your image files Corroded-1.png, Corroded-2.png, and so on.
Set the path of your images and XML files into the variables img_path and xml_path. Also set the bucket name to the bucket variable. Run the code in all the sections defined in the notebook. This creates the training and validation datasets and uploads them to the S3 bucket.
Deploy the solution
Now that we have the training and validation datasets in Amazon S3, it’s time to train an XGBoost classifier using SageMaker. To do so, you can use the corrosion detection web application’s model training functionality. To help you with the web application deployment, we created AWS CloudFormation templates. Clone the source code from the GitHub repository and follow the deployment steps outlined to complete the application deployment. After you successfully deploy the application, you can explore the features it provides, such as on-demand corrosion detection, training and deploying a model, and batch features.
Training an XGBoost classifier on SageMaker
To train an XGBoost classifier, sign in to the corrosion detection web application, and on the menu, choose Model Training. Here you can train a new SageMaker model.
You need to configure parameters before starting a new training job in SageMaker. The application provides a JSON formatted parameter payload that contains information about the SageMaker training job name, Amazon Elastic Compute Cloud (Amazon EC2) instance type, the number of EC2 instances to use, the Amazon S3 location of the training and validation datasets, and XGBoost hyperparameters.
The parameter payload also lets you configure the EC2 instance type, which you can use for hosting the trained ML model using SageMaker hosting services. You can change the values of the hyperparameters, although the default values provided work. For more information about training job parameters, see CreateTrainingJob. For more information about hyperparameters, see XGBoost Hyperparameters.
See the following JSON code:
{
   "TrainingJobName":"Corrosion-Detection-7",
   "MaxRuntimeInSeconds":20000,
   "InstanceCount":1,
   "InstanceType":"ml.c5.2xlarge",
   "S3OutputPath":"s3://bucket/csv/output",
   "InputTrainingS3Uri":"s3://bucket/csv/train/train.csv",
   "InputValidationS3Uri":"s3://bucket/csv/validation/validation.csv",
   "HyperParameters":{
      "max_depth":"3",
      "learning_rate":"0.12",
      "eta":"0.2",
      "colsample_bytree":"0.9",
      "gamma":"0.8",
      "n_estimators":"150",
      "min_child_weight":"10",
      "num_class":"2",
      "subsample":"0.8",
      "num_round":"100",
      "objective":"multi:softmax"
   },
"EndpointInstanceType":"ml.m5.xlarge",
"EndpointInitialInstanceCount":1
}
The following screenshot shows the model training page. To start the SageMaker training job, you need to submit the JSON payload by choosing Submit Training Job.

The application shows you the status of the training job. When the job is complete, a SageMaker endpoint is provisioned. This should take a few minutes, and a new SageMaker endpoint should appear on the SageMaker Endpoints tab of the app.

Promote the SageMaker endpoint
For the application to use the newly created SageMaker endpoint, you need to configure the endpoint with the web app. You do so by entering the newly created endpoint name in the New Endpoint field. The application allows you to promote newly created SageMaker endpoints for inference.

Detect corrosion
Now you’re all set to perform corrosion detection. On the Batch Analysis page, you can upload a .zip file containing your images. This processes all the images by detecting corrosion and indicating the percentage of corrosion found in each image.

Summary
In this post, we introduced you to different ML algorithms and used the color classification XGBoost algorithm to detect corrosion. We also showed you how to train and host ML models using Step Functions and SageMaker. We discussed the pros and cons of different ML and deep learning methods and why a color classification method might be more effective. Finally, we showed how you can integrate ML into a web application that allows you to train and deploy a model and perform inference on images. Learn more about Amazon SageMaker and try these solutions out yourself! If you have any comments or questions, let us know in the comments below!
About the Authors
 Aravind Kodandaramaiah is a Solution Builder with the AWS Global verticals solutions prototyping team, helping global customers realize the “art of the possibility” using AWS to solve challenging business problems. He is an avid Machine learning enthusiast and focusses on building end-to-end solutions on AWS.
 Mehdi E. Far is a Sr Machine Learning Specialist SA at Manufacturing and Industrial Global and Strategic Accounts organization. He helps customers build Machine Learning and Cloud solutions for their challenging problems.
Amazon Scholar has his eyes on the future of robot movement
Learn how Bill Smart wants to simplify the ways that robots and people work together — and why waiting on a date one night changed his career path.Read More
Redefining what a map can be with new information and AI
Sixteen years ago, many of us held a printout of directions in one hand and the steering wheel in the other to get around— without information about the traffic along your route or details about when your favorite restaurant was open. Since then, we’ve been pushing the boundaries of what a map can do, propelled by the latest machine learning. This year, we’re on track to bring over 100 AI-powered improvements to Google Maps so you can get the most accurate, up-to-date information about the world, exactly when you need it. Here’s a snapshot of how we’re using AI to make Maps work better for you with a number of updates coming this year.
Navigate indoors with Live View
We all know that awkward moment when you’re walking in the opposite direction of where you want to go — Live View uses AR cues to avoid just that. Live View is powered by a technology called global localization, which uses AI to scan tens of billions of Street View images to understand your orientation. Thanks to new advancements that help us understand the precise altitude and placement of objects inside a building, we’re now able to bring Live View to some of the trickiest-to-navigate places indoors: airports, transit stations and malls.
If you’re catching a plane or train, Live View can help you find the nearest elevator and escalators, your gate, platform, baggage claim, check-in counters, ticket office, restrooms, ATMs and more. Arrows and accompanying directions will point you the right way. And if you need to pick something up from the mall, use Live View to see what floor a store is on and how to get there so you can get in and out in a snap. Indoor Live View is live now on Android and iOS in a number of malls in Chicago, Long Island, Los Angeles, Newark, San Francisco, San Jose, and Seattle. It starts rolling out in the coming months in select airports, malls, and transit stations in Tokyo and Zurich, with more cities on the way.

Find your way inside airports, train stations, and malls with Indoor Live View
Plan ahead with more information about weather and air quality
With the new weather layer, you can quickly see current and forecasted temperature and weather conditions in an area — so you’ll never get caught in the rain without an umbrella. And the new air quality layer shows you how healthy (or unhealthy) the air is — information that’s especially helpful if you have allergies or are in a smoggy or fire-prone area. Data from partners like The Weather Company, AirNow.gov and the Central Pollution Board power these layers that start rolling out on Android and iOS in the coming months. The weather layer will be available globally and the air quality layer will launch in Australia, India, and the U.S., with more countries to come.
See helpful air quality and weather information with new layers in Google Maps
Find more eco-friendly options to get around
With insights from the U.S. Department of Energy’s National Renewable Energy Lab, we’re building a new routing model that optimizes for lower fuel consumption based on factors like road incline and traffic congestion. This is all part of the commitment we made last September to help one billion people who use our products take action to reduce their environmental footprint. Soon, Google Maps will default to the route with the lowest carbon footprint when it has approximately the same ETA as the fastest route. In cases where the eco-friendly route could significantly increase your ETA, we’ll let you compare the relative CO2 impact between routes so you can choose. Always want the fastest route? That’s OK too — simply adjust your preferences in Settings. Eco-friendly routes launch in the U.S. on Android and iOS later this year, with a global expansion on the way.

Moe eco-friendly routes let you choose the route with the lowest carbon footprint
From Amsterdam to Jakarta, cities around the world have established low emission zones — areas that restrict polluting vehicles like certain diesel cars or cars with specific emissions stickers — to help keep the air clean. To support these efforts, we’re working on alerts to help drivers better understand when they’ll be navigating through one of these zones. You can quickly know if your vehicle is allowed in the area, choose an alternative mode of transportation, or take another route. Low emission zone alerts launch this June in Germany, the Netherlands, France, Spain, and the UK on Android and iOS, with more countries coming soon.

Quickly know if your vehicle is allowed in the area, choose an alternative mode of transportation, or take another route with low emission zone alerts
But we know that getting around sustainably goes beyond driving. So we’re making it easier to choose more sustainable options when you’re on the go. Soon you’ll get a comprehensive view of all routes and transportation modes available to your destination — you can compare how long it’ll take to get there by car, transit or bike without toggling between tabs. Using advanced machine learning models, Maps will automatically prioritize your preferred modes — and even boost modes that are popular in your city. For example, if you bike a lot, we’ll automatically show you more biking routes. And if you live in a city like New York, London, Tokyo, or Buenos Aires where taking the subway is popular, we’ll rank that mode higher. This rolls out globally in the coming months on Android and iOS.

Easily compare different routes and modes of transportation with the new directions experience
Save time with curbside grocery pickup on Maps
Delivery and curbside pickup have grown in popularity during the pandemic — they’re convenient and minimize contact. To make this process easier, we’re bringing helpful shopping information to stores’ Business Profiles on Maps and Search, like delivery providers, pickup and delivery windows, fees, and order minimums. We’re rolling this out on mobile Search starting with Instacart and Albertsons Cos. stores in the U.S., with plans to expand to Maps and other partners.

Check out helpful information about grocery delivery providers, pickup and delivery windows, fees, and order minimums
This summer, we’re also teaming up with U.S. supermarket Fred Meyer, a division of The Kroger Co., on a pilot in select stores in Portland, Oregon to make grocery pickup easier. After you place an order for pickup on the store’s app, you can add it to Maps. We’ll send you a notification when it’s time to leave, and let you share your arrival time with the store. Your ETA is continuously updated, based on location and traffic. This helps the store prioritize your order so it’s ready as soon as you get there. Check in on the Google Maps app, and they’ll bring your order right out for a seamless, fast, no-contact pickup.
Track your grocery order status, share your ETA, and let the store know you’ve arrived – all from Google Maps
All of these updates are possible thanks to AI advancements that have transformed Google Maps into a map that can reflect the millions of changes made around the world every day — in the biggest cities and the smallest towns. Whether you’re getting around, exploring an area, or knocking out errands, let Google Maps help you find your way.