With advances in generative AI, there is increasing work towards creating autonomous agents that can manage daily tasks by operating user interfaces (UIs). While prior research has studied the mechanics of how AI agents might navigate UIs and understand UI structure, the effects of agents and their autonomous actions—particularly those that may be risky or irreversible—remain under-explored. In this work, we investigate the real-world impacts and consequences of mobile UI actions taken by AI agents. We began by developing a taxonomy of the impacts of mobile UI actions through a series of…Apple Machine Learning Research
AWS costs estimation using Amazon Q CLI and AWS Cost Analysis MCP
Managing and optimizing AWS infrastructure costs is a critical challenge for organizations of all sizes. Traditional cost analysis approaches often involve the following:
- Complex spreadsheets – Creating and maintaining detailed cost models, which requires significant effort
- Multiple tools – Switching between the AWS Pricing Calculator, AWS Cost Explorer, and third-party tools
- Specialized knowledge – Understanding the nuances of AWS pricing across services and AWS Regions
- Time-consuming analysis – Manually comparing different deployment options and scenarios
- Delayed optimization – Cost insights often come too late to inform architectural decisions
Amazon Q Developer CLI with the Model Context Protocol (MCP) offers a revolutionary approach to AWS cost analysis. By using generative AI through natural language prompts, teams can now generate detailed cost estimates, comparisons, and optimization recommendations in minutes rather than hours, while providing accuracy through integration with official AWS pricing data.
In this post, we explore how to use Amazon Q CLI with the AWS Cost Analysis MCP server to perform sophisticated cost analysis that follows AWS best practices. We discuss basic setup and advanced techniques, with detailed examples and step-by-step instructions.
Solution overview
Amazon Q Developer CLI is a command line interface that brings the generative AI capabilities of Amazon Q directly to your terminal. Developers can interact with Amazon Q through natural language prompts, making it an invaluable tool for various development tasks.
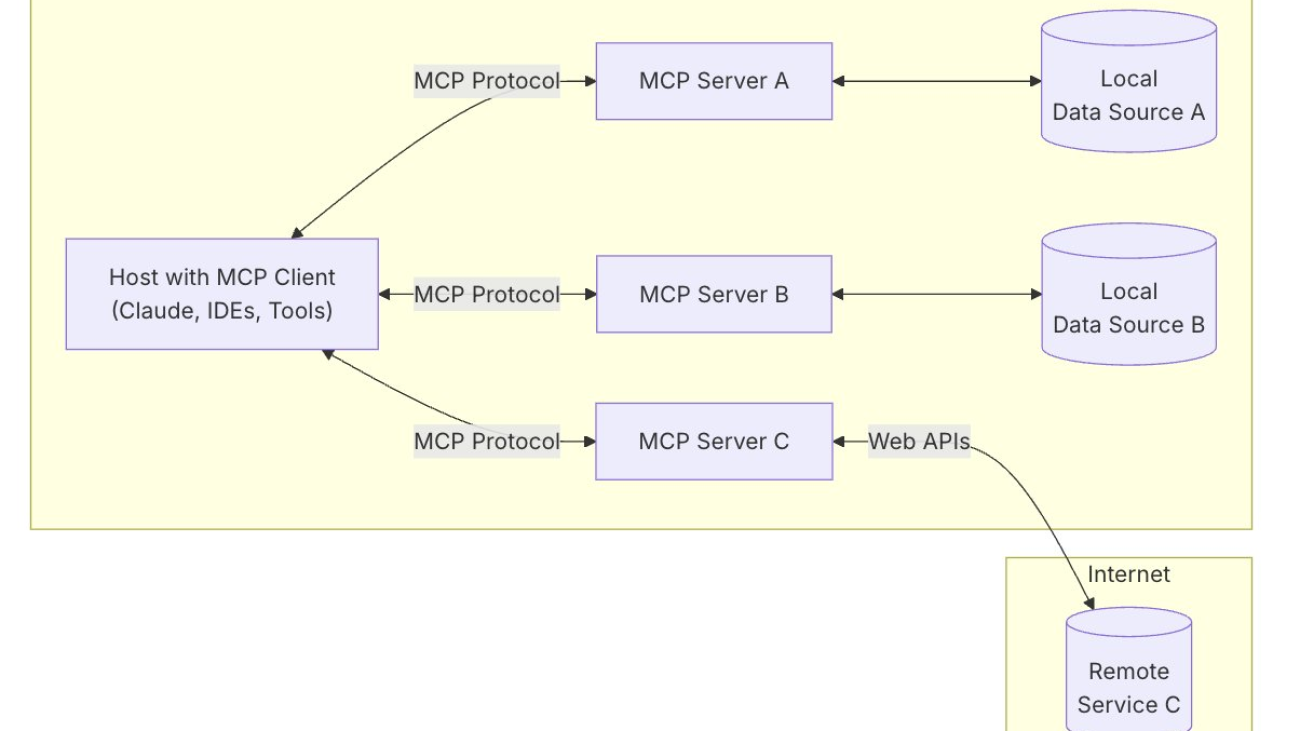
Developed by Anthropic as an open protocol, the Model Context Protocol (MCP) provides a standardized way to connect AI models to different data sources or tools. Using a client-server architecture (as illustrated in the following diagram), the MCP helps developers expose their data through lightweight MCP servers while building AI applications as MCP clients that connect to these servers.
The MCP uses a client-server architecture containing the following components:
- Host – A program or AI tool that requires access to data through the MCP protocol, such as Anthropic’s Claude Desktop, an integrated development environment (IDE), or other AI applications
- Client – Protocol clients that maintain one-to-one connections with servers
- Server – Lightweight programs that expose capabilities through standardized MCP or act as tools
- Data sources – Local data sources such as databases and file systems, or external systems available over the internet through APIs (web APIs) that MCP servers can connect with

As announced in April 2025, the MCP enables Amazon Q Developer to connect with specialized servers that extend its capabilities beyond what’s possible with the base model alone. MCP servers act as plugins for Amazon Q, providing domain-specific knowledge and functionality. The AWS Cost Analysis MCP server specifically enables Amazon Q to generate detailed cost estimates, reports, and optimization recommendations using real-time AWS pricing data.
Prerequisites
To implement this solution, you must have an AWS account with appropriate permissions and follow the steps below.
Set up your environment
Before you can start analyzing costs, you need to set up your environment with Amazon Q CLI and the AWS Cost Analysis MCP server. This section provides detailed instructions for installation and configuration.
Install Amazon Q Developer CLI
Amazon Q Developer CLI is available as a standalone installation. Complete the following steps to install it:
- Download and install Amazon Q Developer CLI. For instructions, see Using Amazon Q Developer on the command line.
- Verify the installation by running the following command:
q --version
You should see output similar to the following: Amazon Q Developer CLI version 1.x.x - Configure Amazon Q CLI with your AWS credentials:
q login - Choose the login method suitable for you:
Set up MCP servers
Before using the AWS Cost Analysis MCP server with Amazon Q CLI, you must install several tools and configure your environment. The following steps guide you through installing the necessary tools and setting up the MCP server configuration:
- Install Panoc using the following command (you can install with brew as well), converting the output to PDF:
pip install pandoc - Install uv with the following command:
pip install uv - Install Python 3.10 or newer:
uv python install 3.10 - Add the servers to your
~/.aws/amazonq/mcp.json file:{ "mcpServers": { "awslabs.cost-analysis-mcp-server": { "command": "uvx", "args": ["awslabs.cost-analysis-mcp-server"], "env": { "FASTMCP_LOG_LEVEL": "ERROR" }, "autoApprove": [], "disabled": false } } }Now, Amazon Q CLI automatically discovers MCP servers in the
~/.aws/amazonq/mcp.jsonfile.
Understanding MCP server tools
The AWS Cost Analysis MCP server provides several powerful tools:
- get_pricing_from_web – Retrieves pricing information from AWS pricing webpages
- get_pricing_from_api – Fetches pricing data from the AWS Price List API
- generate_cost_report – Creates detailed cost analysis reports with breakdowns and visualizations
- analyze_cdk_project – Analyzes AWS Cloud Development Kit (AWS CDK) projects to identify services used and estimate costs
- analyze_terraform_project – Analyzes Terraform projects to identify services used and estimate costs
- get_bedrock_patterns – Retrieves architecture patterns for Amazon Bedrock with cost considerations
These tools work together to help you create accurate cost estimates that follow AWS best practices.
Test your setup
Let’s verify that everything is working correctly by generating a simple cost analysis:
- Start the Amazon Q CLI chat interface and verify the output shows the MCP server being loaded and initialized:
q chat
- In the chat interface, enter the following prompt:
Please create a cost analysis for a simple web application with an Application Load Balancer, two t3.medium EC2 instances, and an RDS db.t3.medium MySQL database. Assume 730 hours of usage per month and moderate traffic of about 100 GB data transfer. Convert estimation to a PDF format. - Amazon Q CLI will ask for permission to trust the tool that is being used; enter
tto trust it. Amazon Q should generate and display a detailed cost analysis. Your output should look like the following screenshot.
If you see the cost analysis report, your environment is set up correctly. If you encounter issues, verify that Amazon Q CLI can access the MCP servers by making sure you installed install the necessary tools and the servers are in the~/.aws/amazonq/mcp.jsonfile.
Configuration options
The AWS Cost Analysis MCP server supports several configuration options to customize your cost analysis experience:
- Output format – Choose between markdown, CSV formats, or PDF (which we installed the package for) for cost reports
- Pricing model – Specify on-demand, reserved instances, or savings plans
- Assumptions and exclusions – Customize the assumptions and exclusions in your cost analysis
- Detailed cost data – Provide specific usage patterns for more accurate estimates
Now that our environment is set up, let’s create more cost analyses.
Create AWS Cost Analysis reports
In this section, we walk through the process of creating AWS cost analysis reports using Amazon Q CLI with the AWS Cost Analysis MCP server.
When you provide a prompt to Amazon Q CLI, the AWS Cost Analysis MCP server completes the following steps:
- Interpret your requirements.
- Retrieve pricing data from AWS pricing sources.
- Generate a detailed cost analysis report.
- Provide optimization recommendations.
This process happens seamlessly, so you can focus on describing what you want rather than how to create it.
AWS Cost Analysis reports typically include the following information:
- Service costs – Breakdown of costs by AWS service
- Unit pricing – Detailed unit pricing information
- Usage quantities – Estimated usage quantities for each service
- Calculation details – Step-by-step calculations showing how costs were derived
- Assumptions – Clearly stated assumptions used in the analysis
- Exclusions – Costs that were not included in the analysis
- Recommendations – Cost optimization suggestions
Example 1: Analyze a serverless application
Let’s create a cost analysis for a simple serverless application. Use the following prompt:
Create a cost analysis for a serverless application using API Gateway, Lambda, and DynamoDB. Assume 1 million API calls per month, average Lambda execution time of 200ms with 512MB memory, and 10GB of DynamoDB storage with 5 million read requests and 1 million write requests per month. Convert estimation to a PDF format.
Upon entering your prompt, Amazon Q CLI will retrieve pricing data using the get_pricing_from_web or get_pricing_from_api tools, and will use generate_cost_report with awslabscost_analysis_mcp_server.

You should receive an output giving a detailed cost breakdown based on the prompt along with optimization recommendations.


The generated cost analysis shows the following information:
- Amazon API Gateway costs for 1 million requests
- AWS Lambda costs for compute time and requests
- Amazon DynamoDB costs for storage, read, and write capacity
- Total monthly cost estimate
- Cost optimization recommendations
Example 2: Analyze multi-tier architectures
Multi-tier architectures separate applications into functional layers (presentation, application, and data) to improve scalability and security. This example analyzes costs for implementing such an architecture on AWS with components for each tier:
Create a cost analysis for a three-tier web application with a presentation tier (ALB and CloudFront), application tier (ECS with Fargate), and data tier (Aurora PostgreSQL). Include costs for 2 Fargate tasks with 1 vCPU and 2GB memory each, an Aurora db.r5.large instance with 100GB storage, an Application Load Balancer with 10
This time, we are formatting it into both PDF and DOCX.


The cost analysis shows the following information:
- Presentation tier costs (Application Load Balancer and AWS CloudFront)
- Application tier costs (Amazon Elastic Container Service (Amazon ECS) and AWS Fargate)
- Data tier costs (Amazon Aurora PostgreSQL-Compatible Edition)
- Detailed breakdown of each component’s pricing
- Total monthly cost estimate
- Cost optimization recommendations for each tier
Example 3: Compare deployment options
When deploying containers on AWS, choosing between Amazon ECS with Amazon Elastic Compute Cloud (Amazon EC2) or Fargate involves different cost structures and management overhead. This example compares these options to determine the most cost-effective solution for a specific workload:
Compare the costs between running a containerized application on ECS with EC2 launch type versus Fargate launch type. Assume 4 containers each needing 1 vCPU and 2GB memory, running 24/7 for a month. For EC2, use t3.medium instances. Provide a recommendation on which option is more cost-effective for this workload. Convert estimation to a HTML webpage.
This time, we are formatting it into a HTML webpage.


The cost comparison includes the following information:
- Amazon ECS with Amazon EC2 launch type costs
- Amazon ECS with Fargate launch type costs
- Detailed breakdown of each option’s pricing components
- Side-by-side comparison of total costs
- Recommendations for the most cost-effective option
- Considerations for when each option might be preferred
Real-world examples
Let’s explore some real-world architecture patterns and how to analyze their costs using Amazon Q CLI with the AWS Cost Analysis MCP server.
Ecommerce platform
Ecommerce platforms require scalable, resilient architectures with careful cost management. These systems typically use microservices to handle various functions independently while maintaining high availability. This example analyzes costs for a complete ecommerce solution with multiple components serving moderate traffic levels:
Create a cost analysis for an e-commerce platform with microservices architecture. Include components for product catalog, shopping cart, checkout, payment processing, order management, and user authentication. Assume moderate traffic of 500,000 monthly active users, 2 million page views per day, and 50,000 orders per month. Ensure the analysis follows AWS best practices for cost optimization. Convert estimation to a PDF format.

The cost analysis includes the following key components:
- Frontend delivery costs (Amazon Simple Storage Service (Amazon S3) and CloudFront)
- API Gateway and Lambda costs for serverless components
- Container costs for microservices (Amazon Elastic Kubernetes Service (Amazon EKS) and Amazon ECS)
- Database costs (Amazon Relational Database Service (Amazon RDS) and DynamoDB)
- Caching costs (Amazon ElastiCache)
- Storage and data transfer costs
- Monitoring and security costs
- Total monthly cost estimate
- Cost optimization recommendations for each component
- Reserved instance and savings plan opportunities
Data analytics platform
Modern data analytics platforms need to efficiently ingest, store, process, and visualize large volumes of data while managing costs effectively. This example examines the AWS services and costs involved in building a complete analytics pipeline handling significant daily data volumes with multiple user access requirements:
Create a cost analysis for a data analytics platform processing 500GB of new data daily. Include components for data ingestion (Kinesis), storage (S3), processing (EMR), and visualization (QuickSight). Assume 50 users accessing dashboards daily and data retention of 90 days. Ensure the analysis follows AWS best practices for cost optimization and includes recommendations for cost-effective scaling. Convert estimation to a HTML webpage.

The cost analysis includes the following key components:
- Data ingestion costs (Amazon Kinesis Data Streams and Amazon Data Firehose)
- Storage costs (Amazon S3 with lifecycle policies)
- Processing costs (Amazon EMR cluster)
- Visualization costs (Amazon QuickSight)
- Data transfer costs between services
- Total monthly cost estimate
- Cost optimization recommendations for each component
- Scaling considerations and their cost implications
Clean up
If you no longer need to use the AWS Cost Analysis MCP server with Amazon Q CLI, you can remove it from your configuration:
- Open your
~/.aws/amazonq/mcp.jsonfile. - Remove or comment out the “
awslabs.cost-analysis-mcp-server” entry. - Save the file.
This will prevent the server from being loaded when you start Amazon Q CLI in the future.
Conclusion
In this post, we explored how to use Amazon Q CLI with the AWS Cost Analysis MCP server to create detailed cost analyses that use accurate AWS pricing data. This approach offers significant advantages over traditional cost estimation methods:
- Time savings – Generate complex cost analyses in minutes instead of hours
- Accuracy – Make sure estimates use the latest AWS pricing information
- Comprehensive – Include relevant cost components and considerations
- Actionable – Receive specific optimization recommendations
- Iterative – Quickly compare different scenarios through simple prompts
- Validation – Check estimates against official AWS pricing
As you continue exploring AWS cost analysis, we encourage you to deepen your knowledge by learning more about the Model Context Protocol (MCP) to understand how it enhances the capabilities of Amazon Q. For hands-on cost estimation, the AWS Pricing Calculator offers an interactive experience to model and compare different deployment scenarios. To make sure your architectures follow financial best practices, the AWS Well-Architected Framework Cost Optimization Pillar provides comprehensive guidance on building cost-efficient systems. And to stay at the cutting edge of these tools, keep an eye on updates to the official AWS MCP servers—they’re constantly evolving with new features to make your cost analysis experience even more powerful and accurate.
About the Authors
 Joel Asante, an Austin-based Solutions Architect at Amazon Web Services (AWS), works with GovTech (Government Technology) customers. With a strong background in data science and application development, he brings deep technical expertise to creating secure and scalable cloud architectures for his customers. Joel is passionate about data analytics, machine learning, and robotics, leveraging his development experience to design innovative solutions that meet complex government requirements. He holds 13 AWS certifications and enjoys family time, fitness, and cheering for the Kansas City Chiefs and Los Angeles Lakers in his spare time.
 Dunieski Otano is a Solutions Architect at Amazon Web Services based out of Miami, Florida. He works with World Wide Public Sector MNO (Multi-International Organizations) customers. His passion is Security, Machine Learning and Artificial Intelligence, and Serverless. He works with his customers to help them build and deploy high available, scalable, and secure solutions. Dunieski holds 14 AWS certifications and is an AWS Golden Jacket recipient. In his free time, you will find him spending time with his family and dog, watching a great movie, coding, or flying his drone.
 Varun Jasti is a Solutions Architect at Amazon Web Services, working with AWS Partners to design and scale artificial intelligence solutions for public sector use cases to meet compliance standards. With a background in Computer Science, his work covers broad range of ML use cases primarily focusing on LLM training/inferencing and computer vision. In his spare time, he loves playing tennis and swimming.
STARFlow: Scaling Latent Normalizing Flows for High-resolution Image Synthesis
We present STARFlow, a scalable generative model based on normalizing flows that achieves strong performance in high-resolution image synthesis. The core of STARFlow is Transformer Autoregressive Flow (TARFlow), which combines the expressive power of normalizing flows with the structured modeling capabilities of Autoregressive Transformers. We first establish the theoretical universality of TARFlow for modeling continuous distributions. Building on this foundation, we introduce several key architectural and algorithmic innovations to significantly enhance scalability: (1) a deep-shallow…Apple Machine Learning Research
Disentangled Safety Adapters Enable Efficient Guardrails and Flexible Inference-Time Alignment
Existing paradigms for ensuring AI safety, such as guardrail models and alignment training, often compromise either inference efficiency or development flexibility. We introduce Disentangled Safety Adapters (DSA), a novel framework addressing these challenges by decoupling safety-specific computations from a task-optimized base model. DSA utilizes lightweight adapters that leverage the base model’s internal representations, enabling diverse and flexible safety functionalities with minimal impact on inference cost. Empirically, DSA-based safety guardrails substantially outperform comparably…Apple Machine Learning Research
Normalizing Flows are Capable Generative Models
Normalizing Flows (NFs) are likelihood-based models for continuous inputs. They have demonstrated promising results on both density estimation and generative modeling tasks, but have received relatively little attention in recent years. In this work, we demonstrate that NFs are more powerful than previously believed. We present TarFlow: a simple and scalable architecture that enables highly performant NF models. TarFlow can be thought of as a Transformer-based variant of Masked Autoregressive Flows (MAFs): it consists of a stack of autoregressive Transformer blocks on image patches…Apple Machine Learning Research
Revisiting Uncertainty Quantification Evaluation in Language Models: Spurious Interactions with Response Length Bias Results
Uncertainty Quantification (UQ) in Language Models (LMs) is key to improving their safety and reliability. Evaluations often use metrics like AUROC to assess how well UQ methods (e.g., negative sequence probabilities) correlate with task correctness functions (e.g., ROUGE-L). We show that mutual biases–when both UQ methods and correctness functions are biased by the same factors–systematically distort evaluation. First, we formally prove that any mutual bias non-randomly skews AUROC rankings, compromising benchmark integrity. Second, we confirm this happens empirically by testing 7 widely…Apple Machine Learning Research
Phonetically-Augmented Discriminative Rescoring for Voice Search Error Correction
End-to-end (E2E) Automatic Speech Recognition (ASR) models are trained using paired audio-text samples that are expensive to obtain, since high-quality ground-truth data requires human annotators. Voice search applications, such as digital media players, leverage ASR to allow users to search by voice as opposed to an on-screen keyboard. However, recent or infrequent movie titles may not be sufficiently represented in the E2E ASR system’s training data, and hence, may suffer poor recognition.
In this paper, we propose a phonetic correction system that consists of (a) a phonetic search based on…Apple Machine Learning Research
Variational Rectified Flow Matching
We study Variational Rectified Flow Matching, a framework that enhances classic rectified flow matching by modeling multi-modal velocity vector-fields. At inference time, classic rectified flow matching ‘moves’ samples from a source distribution to the target distribution by solving an ordinary differential equation via integration along a velocity vector-field. At training time, the velocity vector-field is learnt by linearly interpolating between coupled samples one drawn from the source and one drawn from the target distribution randomly. This leads to ”ground-truth” velocity…Apple Machine Learning Research
INRFlow: Flow Matching for INRs in Ambient Space
Flow matching models have emerged as a powerful method for generative modeling on domains like images or videos, and even on irregular or unstructured data like 3D point clouds or even protein structures. These models are commonly trained in two stages: first, a data compressor is trained, and in a subsequent training stage a flow matching generative model is trained in the latent space of the data compressor. This two-stage paradigm sets obstacles for unifying models across data domains, as hand-crafted compressors architectures are used for different data modalities. To this end, we…Apple Machine Learning Research
Aligning LLMs by Predicting Preferences from User Writing Samples
Accommodating human preferences is essential for creating aligned LLM agents that deliver personalized and effective interactions. Recent work has shown the potential for LLMs acting as writing agents to infer a description of user preferences. Agent alignment then comes from conditioning on the inferred preference description. However, existing methods often produce generic preference descriptions that fail to capture the unique and individualized nature of human preferences. This paper introduces PROSE, a method designed to enhance the precision of preference descriptions inferred from user…Apple Machine Learning Research