Large Language Models (LLMs) are increasingly used in applications requiring long context
lengths, but the key-value (KV) cache often becomes a memory bottleneck on GPUs as con-
text lengths grow. To address this, we propose Commutative Vector Quantization (CommVQ)
to significantly reduce memory usage for long context LLM inference. First, we leverage additive quantization by introducing a lightweight encoder and codebook to compress the KV cache,
which can then be decoded with a simple matrix multiplication. Second, to tackle the high
computational costs during decoding, we design the…Apple Machine Learning Research
A Variational Framework for Improving Naturalness in Generative Spoken Language Models
The success of large language models in text processing has inspired their adaptation to speech modeling. However, since speech is continuous and complex, it is often discretized for autoregressive modeling. Speech tokens derived from self-supervised models (known as semantic tokens) typically focus on the linguistic aspects of speech but neglect prosodic information. As a result, models trained on these tokens can generate speech with reduced naturalness. Existing approaches try to fix this by adding pitch features to the semantic tokens. However, pitch alone cannot fully represent the range…Apple Machine Learning Research
Shielded Diffusion: Generating Novel and Diverse Images using Sparse Repellency
Diffusion models are generating ever more realistic images. Yet, when gener-
ating images repeatedly with the same prompt, practitioners often obtain slight
variations of the same, highly-likely mode. As a result, most models fail to re-
flect the inherent diversity seen in data, which hinders their relevance to creative
tasks or ability to power world models. This work proposes a highly effective and
general method to repel generated images away from a reference set of images.
This is achieved by introducing data-driven repellence terms within diffusions dy-
namically, throughout their…Apple Machine Learning Research
Target Concrete Score Matching: A Holistic Framework for Discrete Diffusion
Discrete diffusion is a promising framework for modeling and generating discrete data. In this work, we present Target Concrete Score Matching (TCSM), a novel and versatile objective for training and fine-tuning discrete diffusion models. TCSM provides a general framework with broad applicability. It supports pre-training discrete diffusion models directly from data samples, and many existing discrete diffusion approaches naturally emerge as special cases of our more general TCSM framework. Furthermore, the same TCSM objective extends to post-training of discrete diffusion models, including…Apple Machine Learning Research
Addressing Misspecification in Simulation-based Inference through Data-driven Calibration
Driven by steady progress in deep generative modeling, simulation-based inference (SBI) has emerged as the workhorse for inferring the parameters of stochastic simulators. However, recent work has demonstrated that model misspecification can compromise the reliability of SBI, preventing its adoption in important applications where only misspecified simulators are available. This work introduces robust posterior estimation~(RoPE), a framework that overcomes model misspecification with a small real-world calibration set of ground-truth parameter measurements. We formalize the misspecification…Apple Machine Learning Research
Beyond Sensor Data: Foundation Models of Behavioral Data from Wearables Improve Health Predictions
Wearable devices record physiological and behavioral signals that can improve health predictions. While foundation models are increasingly used for such predictions, they have been primarily applied to low-level sensor data, despite behavioral data often being more informative due to their alignment with physiologically relevant timescales and quantities. We develop foundation models of such behavioral signals using over 2.5B hours of wearable data from 162K individuals, systematically optimizing architectures and tokenization strategies for this unique dataset. Evaluated on 57 health-related…Apple Machine Learning Research
Faster Rates for Private Adversarial Bandits
We design new differentially private algorithms for the problems of adversarial bandits and bandits with expert advice. For adversarial bandits, we give a simple and efficient conversion of any non-private bandit algorithms to private bandit algorithms. Instantiating our conversion with existing non-private bandit algorithms gives a regret upper bound of O(KTε)Oleft(frac{sqrt{KT}}{sqrt{varepsilon}}right)O(εKT), improving upon the existing upper bound O(KTlog(KT)ε)Oleft(frac{sqrt{KT log(KT)}}{varepsilon}right)O(εKTlog(KT)) in all privacy regimes. In particular, our algorithms…Apple Machine Learning Research
New capabilities in Amazon SageMaker AI continue to transform how organizations develop AI models
As AI models become increasingly sophisticated and specialized, the ability to quickly train and customize models can mean the difference between industry leadership and falling behind. That is why hundreds of thousands of customers use the fully managed infrastructure, tools, and workflows of Amazon SageMaker AI to scale and advance AI model development. Since launching in 2017, SageMaker AI has transformed how organizations approach AI model development by reducing complexity while maximizing performance. Since then, we’ve continued to relentlessly innovate, adding more than 420 new capabilities since launch to give customers the best tools to build, train, and deploy AI models quickly and efficiently. Today, we’re pleased to announce new innovations that build on the rich features of SageMaker AI to accelerate how customers build and train AI models.
Amazon SageMaker HyperPod: The infrastructure of choice for developing AI models
AWS launched Amazon SageMaker HyperPod in 2023 to reduce complexity and maximize performance and efficiency when building AI models. With SageMaker HyperPod, you can quickly scale generative AI model development across thousands of AI accelerators and reduce foundation model (FM) training and fine-tuning development costs by up to 40%. Many of today’s top models are trained on SageMaker HyperPod, including models from Hugging Face, Luma AI, Perplexity AI, Salesforce, Thomson Reuters, Writer, and Amazon. By training Amazon Nova FMs on SageMaker HyperPod, Amazon saved months of work and increased utilization of compute resources to more than 90%.
To further streamline workflows and make it faster to develop and deploy models, a new command line interface (CLI) and software development kit (SDK) provides a single, consistent interface that simplifies infrastructure management, unifies job submission across training and inference, and supports both recipe-based and custom workflows with integrated monitoring and control. Today, we are also adding two capabilities to SageMaker HyperPod that can help you reduce training costs and accelerate AI model development.
Reduce the time to troubleshoot performance issues from days to minutes with SageMaker HyperPod observability
To bring new AI innovations to market as quickly as possible, organizations need visibility across AI model development tasks and compute resources to optimize training efficiency and detect and resolve interruptions or performance bottlenecks as soon as possible. For example, to investigate if a training or fine-tuning job failure was the result of a hardware issue, data scientists and machine learning (ML) engineers want to quickly filter to review the monitoring data of the specific GPUs that performed the job rather than manually browsing through the hardware resources of an entire cluster to establish the correlation between the job failure and a hardware issue.
The new observability capability in SageMaker HyperPod transforms how you can monitor and optimize your model development workloads. Through a unified dashboard preconfigured in Amazon Managed Grafana, with the monitoring data automatically published to an Amazon Managed Service for Prometheus workspace, you can now see generative AI task performance metrics, resource utilization, and cluster health in a single view. Teams can now quickly spot bottlenecks, prevent costly delays, and optimize compute resources. You can define automated alerts, specify use case-specific task metrics and events, and publish them to the unified dashboard with just a few clicks.
By reducing troubleshooting time from days to minutes, this capability can help you accelerate your path to production and maximize the return on your AI investments.
![]()
DatologyAI builds tools to automatically select the best data on which to train deep learning models.
“We are excited to use Amazon SageMaker HyperPod’s one-click observability solution. Our senior staff members needed insights into how we’re utilizing GPU resources. The pre-built Grafana dashboards will give us exactly what we needed, with immediate visibility into critical metrics—from task-specific GPU utilization to file system (FSx for Lustre) performance—without requiring us to maintain any monitoring infrastructure. As someone who appreciates the power of the Prometheus Query Language, I like the fact that I can write my own queries and analyze custom metrics without worrying about infrastructure problems.”
–Josh Wills, Member of Technical Staff at DatologyAI
–
![]()
Articul8 helps companies build sophisticated enterprise generative AI applications.
“With SageMaker HyperPod observability, we can now deploy our metric collection and visualization systems in a single click, saving our teams days of otherwise manual setup and enhancing our cluster observability workflows and insights. Our data scientists can quickly monitor task performance metrics, such as latency, and identify hardware issues without manual configuration. SageMaker HyperPod observability will help streamline our foundation model development processes, allowing us to focus on advancing our mission of delivering accessible and reliable AI-powered innovation to our customers.”
–Renato Nascimento, head of technology at Articul8
–
Deploy Amazon SageMaker JumpStart models on SageMaker HyperPod for fast, scalable inference
After developing generative AI models on SageMaker HyperPod, many customers import these models to Amazon Bedrock, a fully managed service for building and scaling generative AI applications. However, some customers want to use their SageMaker HyperPod compute resources to speed up their evaluation and move models into production faster.
Now, you can deploy open-weights models from Amazon SageMaker JumpStart, as well as fine-tuned custom models, on SageMaker HyperPod within minutes with no manual infrastructure setup. Data scientists can run inference on SageMaker JumpStart models with a single click, simplifying and accelerating model evaluation. This straightforward, one-time provisioning reduces manual infrastructure setup, providing a reliable and scalable inference environment with minimal effort. Large model downloads are reduced from hours to minutes, accelerating model deployments and shortening the time to market.
–

H.AI exists to push the boundaries of superintelligence with agentic AI.
“With Amazon SageMaker HyperPod, we used the same high-performance compute to build and deploy the foundation models behind our agentic AI platform. This seamless transition from training to inference streamlined our workflow, reduced time to production, and delivered consistent performance in live environments. SageMaker HyperPod helped us go from experimentation to real-world impact with greater speed and efficiency.”
–Laurent Sifre, Co-founder & CTO at H.AI
–
Seamlessly access the powerful compute resources of SageMaker AI from local development environments
Today, many customers choose from the broad set of fully managed integrated development environments (IDEs) available in SageMaker AI for model development, including JupyterLab, Code Editor based on Code-OSS, and RStudio. Although these IDEs enable secure and efficient setups, some developers prefer to use local IDEs on their personal computers for their debugging capabilities and extensive customization options. However, customers using a local IDE, such as Visual Studio Code, couldn’t easily run their model development tasks on SageMaker AI until now.
With new remote connections to SageMaker AI, developers and data scientists can quickly and seamlessly connect to SageMaker AI from their local VS Code, maintaining access to the custom tools and familiar workflows that help them work most efficiently. Developers can build and train AI models using their local IDE while SageMaker AI manages remote execution, so you can work in your preferred environment while still benefiting from the performance, scalability, and security of SageMaker AI. You can now choose your preferred IDE—whether that is a fully managed cloud IDE or VS Code—to accelerate AI model development using the powerful infrastructure and seamless scalability of SageMaker AI.
–

CyberArk is a leader in Identity Security, which provides a comprehensive approach centered on privileged controls to protect against advanced cyber threats.
“With remote connections to SageMaker AI, our data scientists have the flexibility to choose the IDE that makes them most productive. Our teams can leverage their customized local setup while accessing the infrastructure and security controls of SageMaker AI. As a security first company, this is extremely important to us as it ensures sensitive data stays protected, while allowing our teams to securely collaborate and boost productivity.”
–Nir Feldman, Senior Vice President of Engineering at CyberArk
–
Build generative AI models and applications faster with fully managed MLflow 3.0
As customers across industries accelerate their generative AI development, they require capabilities to track experiments, observe behavior, and evaluate performance of models and AI applications. Customers such as Cisco, SonRai, and Xometry are already using managed MLflow on SageMaker AI to efficiently manage ML model experiments at scale. The introduction of fully managed MLflow 3.0 on SageMaker AI makes it straightforward to track experiments, monitor training progress, and gain deeper insights into the behavior of models and AI applications using a single tool, helping you accelerate generative AI development.
Conclusion
In this post, we shared some of the new innovations in SageMaker AI to accelerate how you can build and train AI models.
To learn more about these new features, SageMaker AI, and how companies are using this service, refer to the following resources:
- Accelerate foundation model development with one click observability in Amazon SageMaker HyperPod
- Supercharge your AI workflows by connecting to SageMaker Studio from Visual Studio Code
- Accelerating generative AI development with fully managed MLflow 3.0 on Amazon SageMaker AI
- Amazon SageMaker HyperPod launches model deployments to accelerate the generative AI model development lifecycle
- Amazon SageMaker AI
- Amazon SageMaker AI customers
About the author
 Ankur Mehrotra joined Amazon back in 2008 and is currently the General Manager of Amazon SageMaker AI. Before Amazon SageMaker AI, he worked on building Amazon.com’s advertising systems and automated pricing technology.
Accelerate foundation model development with one-click observability in Amazon SageMaker HyperPod
Amazon SageMaker HyperPod now provides a comprehensive, out-of-the-box dashboard that delivers insights into foundation model (FM) development tasks and cluster resources. This unified observability solution automatically publishes key metrics to Amazon Managed Service for Prometheus and visualizes them in Amazon Managed Grafana dashboards, optimized specifically for FM development with deep coverage of hardware health, resource utilization, and task-level performance.
With a one-click installation of the Amazon Elastic Kubernetes Service (Amazon EKS) add-on for SageMaker HyperPod observability, you can consolidate health and performance data from NVIDIA DCGM, instance-level Kubernetes node exporters, Elastic Fabric Adapter (EFA), integrated file systems, Kubernetes APIs, Kueue, and SageMaker HyperPod task operators. With this unified view, you can trace model development task performance to cluster resources with aggregation of resource metrics at the task level. The solution also abstracts management of collector agents and scrapers across clusters, offering automatic scalability of collectors across nodes as the cluster grows. The dashboards feature intuitive navigation across metrics and visualizations to help users diagnose problems and take action faster. They are also fully customizable, supporting additional PromQL metric imports and custom Grafana layouts.
These capabilities save teams valuable time and resources during FM development, helping accelerate time-to-market and reduce the cost of generative AI innovations. Instead of spending hours or days configuring, collecting, and analyzing cluster telemetry systems, data scientists and machine learning (ML) engineers can now quickly identify training, tuning, and inference disruptions, underutilization of valuable GPU resources, and hardware performance issues. The pre-built, actionable insights of SageMaker HyperPod observability can be used in several common scenarios when operating FM workloads, such as:
- Data scientists can monitor resource utilization of submitted training and inference tasks at the per-GPU level, with insights into GPU memory and FLOPs
- AI researchers can troubleshoot sub-optimal time-to-first-token (TTFT) for their inferencing workloads by correlating the deployment metrics with the corresponding resource bottlenecks
- Cluster administrators can configure customizable alerts to send notifications to multiple destinations such as Amazon Simple Notification Service (Amazon SNS), PagerDuty, and Slack when hardware falls outside of recommended health thresholds
- Cluster administrators can quickly identify inefficient resource queuing patterns across teams or namespaces to reconfigure allocation and prioritization policies
In this post, we walk you through installing and using the unified dashboards of the out-of-the-box observability feature in SageMaker HyperPod. We cover the one-click installation from the Amazon SageMaker AI console, navigating the dashboard and metrics it consolidates, and advanced topics such as setting up custom alerts. If you have a running SageMaker HyperPod EKS cluster, then this post will help you understand how to quickly visualize key health and performance telemetry data to derive actionable insights.
Prerequisites
To get started with SageMaker HyperPod observability, you first need to enable AWS IAM Identity Center to use Amazon Managed Grafana. If IAM Identity Center isn’t already enabled in your account, refer to Getting started with IAM Identity Center. Additionally, create at least one user in the IAM Identity Center.
SageMaker HyperPod observability is available for SageMaker HyperPod clusters with an Amazon EKS orchestrator. If you don’t already have a SageMaker HyperPod cluster with an Amazon EKS orchestrator, refer to Amazon SageMaker HyperPod quickstart workshops for instructions to create one.
Enable SageMaker HyperPod observability
To enable SageMaker HyperPod observability, follow these steps:
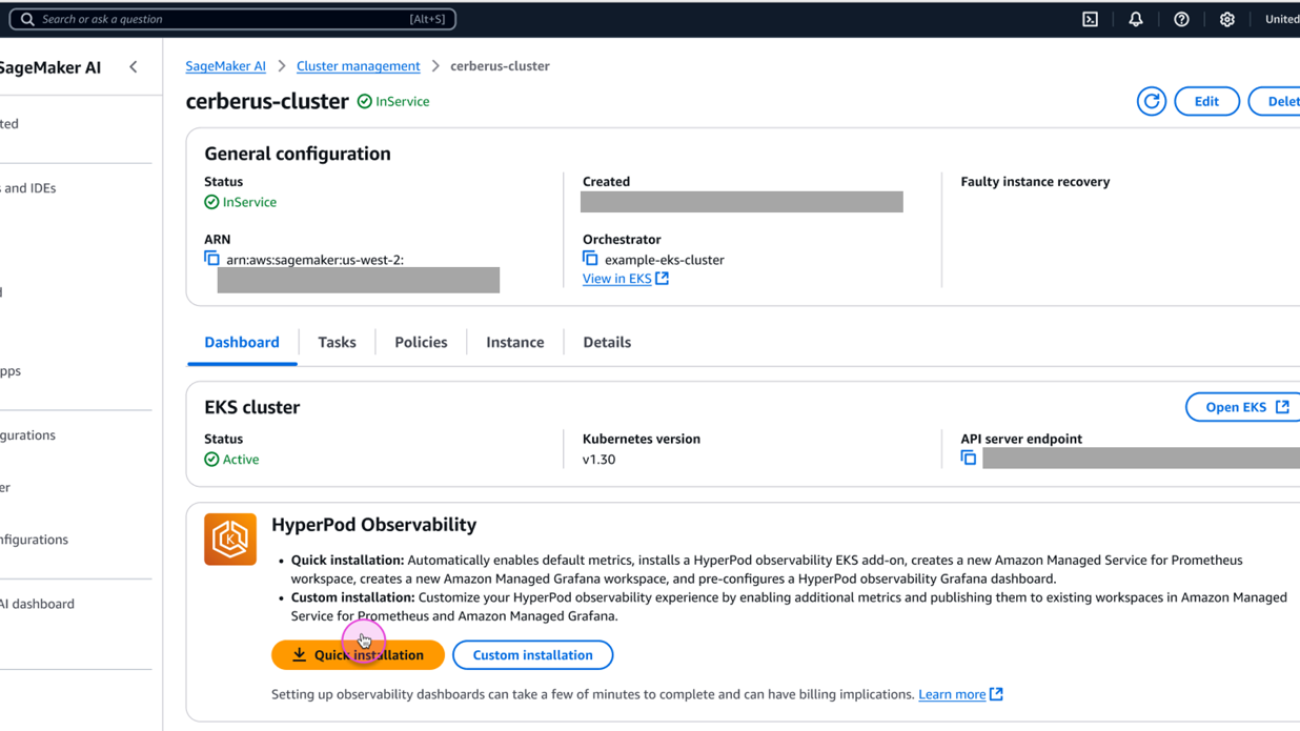
- On the SageMaker AI console, choose Cluster management in the navigation pane.
- Open the cluster detail page from the SageMaker HyperPod clusters list.
- On the Dashboard tab, in the HyperPod Observability section, choose Quick installation.
SageMaker AI will create a new Prometheus workspace, a new Grafana workspace, and install the SageMaker HyperPod observability add-on to the EKS cluster. The installation typically completes within a few minutes.

When the installation process is complete, you can view the add-on details and metrics available.
- Choose Manage users to assign a user to a Grafana workspace.
- Choose Open dashboard in Grafana to open the Grafana dashboard.

- When prompted, sign in with IAM Identity Center with the user you configured as a prerequisite.

After signing in successfully, you will see the SageMaker HyperPod observability dashboard on Grafana.
SageMaker HyperPod observability dashboards
You can choose from multiple dashboards, including Cluster, Tasks, Inference, Training, and File system.
The Cluster dashboard shows cluster-level metrics such as Total Nodes and Total GPUs, and cluster node-level metrics such as GPU Utilization and Filesystem space available. By default, the dashboard shows metrics about entire cluster, but you can apply filters to show metrics only about a specific hostname or specific GPU ID.

The Tasks dashboard is helpful if you want to see resource allocation and utilization metrics at the task level (PyTorchJob, ReplicaSet, and so on). For example, you can compare GPU utilization by multiple tasks running on your cluster and identify which task should be improved.
You can also choose an aggregation level from multiple options (Namespace, Task Name, Task Pod), and apply filters (Namespace, Task Type, Task Name, Pod, GPU ID). You can use these aggregation and filtering capabilities to view metrics at the appropriate granularity and drill down into the specific issue you are investigating.

The Inference dashboard shows inference application specific metrics such as Incoming Requests, Latency, and Time to First Byte (TTFB). The Inference dashboard is particularly useful when you use SageMaker HyperPod clusters for inference and need to monitor the traffic of the requests and performance of models.

Advanced installation
The Quick installation option will create a new workspace for Prometheus and Grafana and select default metrics. If you want to reuse an existing workspace, select additional metrics, or enable Pod logging to Amazon CloudWatch Logs, use the Custom installation option. For more information, see Amazon SageMaker HyperPod.
Set up alerts
Amazon Managed Grafana includes access to an updated alerting system that centralizes alerting information in a single, searchable view (in the navigation pane, choose Alerts to create an alert). Alerting is useful when you want to receive timely notifications, such as when GPU utilization drops unexpectedly, when a disk usage of your shared file system exceeds 90%, when multiple instances become unavailable at the same time, and so on. The HyperPod observability dashboard in Amazon Managed Grafana has pre-configured alerts for few of these key metrics. You can create additional alert rules based on metrics or queries and set up multiple notification channels, such as emails and Slack messages. For instructions on setting up alerts with Slack messages, see the Setting Up Slack Alerts for Amazon Managed Grafana GitHub page.
The number of alerts is limited to 100 per Grafana workspace. If you need a more scalable solution, check out the alerting options in Amazon Managed Service for Prometheus.
High-level overview
The following diagram illustrates the architecture of the new HyperPod observability capability.

Clean up
If you want to uninstall the SageMaker HyperPod observability feature (for example, to reconfigure it), clean up the resources in the following order:
- Remove the SageMaker HyperPod observability add-on, either using the SageMaker AI console or Amazon EKS console.
- Delete the Grafana workspace on the Amazon Managed Grafana console.
- Delete the Prometheus workspace on the Amazon Managed Service for Prometheus console.
Conclusion
This post provided an overview and usage instructions for SageMaker HyperPod observability, a newly released observability feature for SageMaker HyperPod. This feature reduces the heavy lifting involved in setting up cluster observability and provides centralized visibility into cluster health status and performance metrics.
For more information about SageMaker HyperPod observability, see Amazon SageMaker HyperPod. Please leave your feedback on this post in the comments section.
About the authors
 Tomonori Shimomura is a Principal Solutions Architect on the Amazon SageMaker AI team, where he provides in-depth technical consultation to SageMaker AI customers and suggests product improvements to the product team. Before joining Amazon, he worked on the design and development of embedded software for video game consoles, and now he leverages his in-depth skills in Cloud side technology. In his free time, he enjoys playing video games, reading books, and writing software.
 Matt Nightingale is a Solutions Architect Manager on the AWS WWSO Frameworks team focusing on Generative AI Training and Inference. Matt specializes in distributed training architectures with a focus on hardware performance and reliability. Matt holds a bachelors degree from University of Virginia and is based in Boston, Massachusetts.
 Eric Saleh is a Senior GenAI Specialist at AWS, focusing on foundation model training and inference. He is partnering with top foundation model builders and AWS service teams to enable distributed training and inference at scale on AWS and lead joint GTM motions with strategic customers. Before joining AWS, Eric led product teams building enterprise AI/ML solutions, which included frontier GenAI services for fine-tuning, RAG, and managed inference. He holds a master’s degree in Business Analytics from UCLA Anderson.
 Piyush Kadam is a Senior Product Manager on the Amazon SageMaker AI team, where he specializes in LLMOps products that empower both startups and enterprise customers to rapidly experiment with and efficiently govern foundation models. With a Master’s degree in Computer Science from the University of California, Irvine, specializing in distributed systems and artificial intelligence, Piyush brings deep technical expertise to his role in shaping the future of cloud AI products.
 Aman Shanbhag is a Specialist Solutions Architect on the ML Frameworks team at Amazon Web Services (AWS), where he helps customers and partners with deploying ML training and inference solutions at scale. Before joining AWS, Aman graduated from Rice University with degrees in computer science, mathematics, and entrepreneurship.
 Bhaskar Pratap is a Senior Software Engineer with the Amazon SageMaker AI team. He is passionate about designing and building elegant systems that bring machine learning to people’s fingertips. Additionally, he has extensive experience with building scalable cloud storage services.
 Gopi Sekar is an Engineering Leader for the Amazon SageMaker AI team. He is dedicated to assisting customers and developing products that simplify the adaptation of machine learning to address real-world customer challenges.
Accelerating generative AI development with fully managed MLflow 3.0 on Amazon SageMaker AI
Amazon SageMaker now offers fully managed support for MLflow 3.0 that streamlines AI experimentation and accelerates your generative AI journey from idea to production. This release transforms managed MLflow from experiment tracking to providing end-to-end observability, reducing time-to-market for generative AI development.
As customers across industries accelerate their generative AI development, they require capabilities to track experiments, observe behavior, and evaluate performance of models and AI applications. Data scientists and developers struggle to effectively analyze the performance of their models and AI applications from experimentation to production, making it hard to find root causes and resolve issues. Teams spend more time integrating tools than improving the quality of their models or generative AI applications.
With the launch of fully managed MLflow 3.0 on Amazon SageMaker AI, you can accelerate generative AI development by making it easier to track experiments and observe behavior of models and AI applications using a single tool. Tracing capabilities in fully managed MLflow 3.0 provide customers the ability to record the inputs, outputs, and metadata at every step of a generative AI application, so developers can quickly identify the source of bugs or unexpected behaviors. By maintaining records of each model and application version, fully managed MLflow 3.0 offers traceability to connect AI responses to their source components, which means developers can quickly trace an issue directly to the specific code, data, or parameters that generated it. With these capabilities, customers using Amazon SageMaker HyperPod to train and deploy foundation models (FMs) can now use managed MLflow to track experiments, monitor training progress, gain deeper insights into the behavior of models and AI applications, and manage their machine learning (ML) lifecycle at scale. This reduces troubleshooting time and enables teams to focus more on innovation.
This post walks you through the core concepts of fully managed MLflow 3.0 on SageMaker and provides technical guidance on how to use the new features to help accelerate your next generative AI application development.
Getting started
You can get started with fully managed MLflow 3.0 on Amazon SageMaker to track experiments, manage models, and streamline your generative AI/ML lifecycle through the AWS Management Console, AWS Command Line Interface (AWS CLI), or API.
Prerequisites
To get started, you need:
- An AWS account with billing enabled
- An Amazon SageMaker Studio AI domain. To create a domain, refer to Guide to getting set up with Amazon SageMaker AI.
Configure your environment to use SageMaker managed MLflow Tracking Server
To perform the configuration, follow these steps:
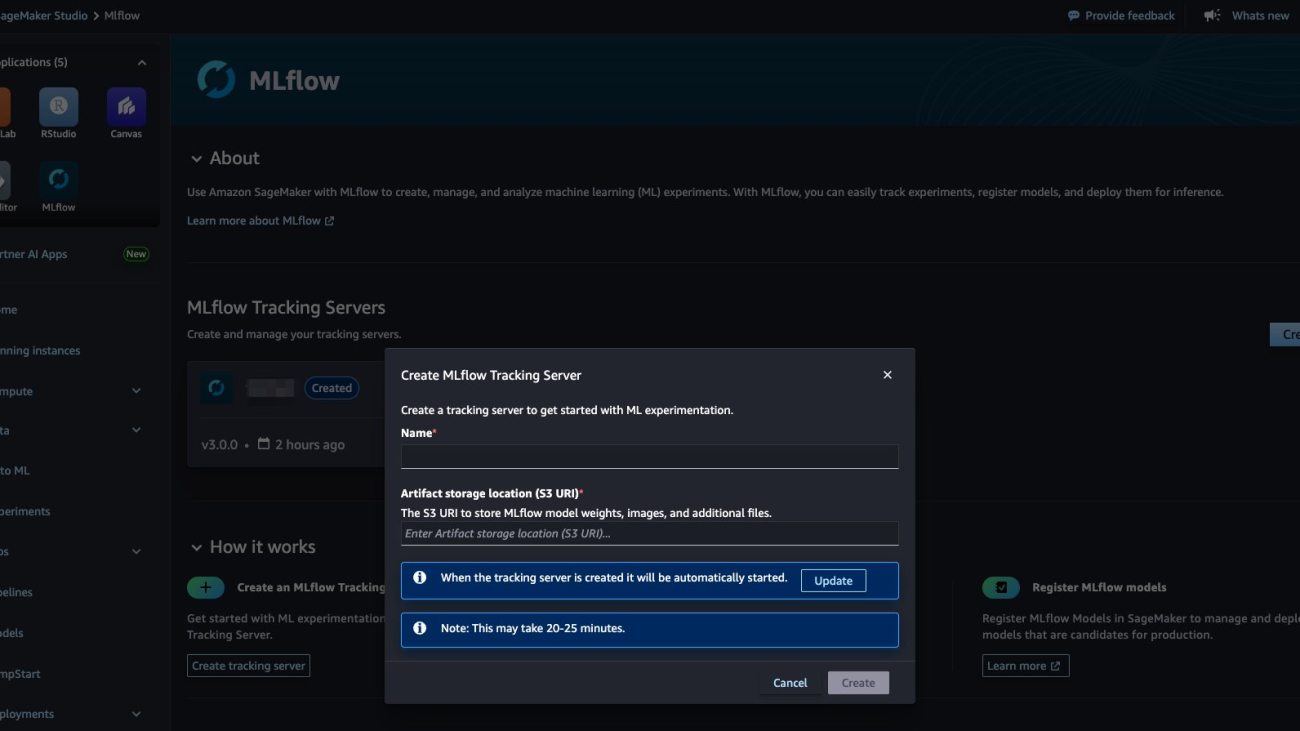
- In the SageMaker Studio UI, in the Applications pane, choose MLflow and choose Create.

- Enter a unique name for your tracking server and specify the Amazon Simple Storage Service (Amazon S3) URI where your experiment artifacts will be stored. When you’re ready, choose Create. By default, SageMaker will select version
3.0to create the MLflow tracking server. - Optionally, you can choose Update to adjust settings such as server size, tags, or AWS Identity and Access Management (IAM) role.
The server will now be provisioned and started automatically, typically within 25 minutes. After setup, you can launch the MLflow UI from SageMaker Studio to start tracking your ML and generative AI experiments. For more details on tracking server configurations, refer to Machine learning experiments using Amazon SageMaker AI with MLflow in the SageMaker Developer Guide.
To begin tracking your experiments with your newly created SageMaker managed MLflow tracking server, you need to install both MLflow and the AWS SageMaker MLflow Python packages in your environment. You can use SageMaker Studio managed Jupyter Lab, SageMaker Studio Code Editor, a local integrated development environment (IDE), or other supported environment where your AI workloads operate to track with SageMaker managed MLFlow tracking server.
To install both Python packages using pip:pip install mlflow==3.0 sagemaker-mlflow==0.1.0
To connect and start logging your AI experiments, parameters, and models directly to the managed MLflow on SageMaker, replace the Amazon Resource Name (ARN) of your SageMaker MLflow tracking server:
Now your environment is configured and ready to track your experiments with your SageMaker Managed MLflow tracking server.
Implement generative AI application tracing and version tracking
Generative AI applications have multiple components, including code, configurations, and data, which can be challenging to manage without systematic versioning. A LoggedModel entity in managed MLflow 3.0 represents your AI model, agent, or generative AI application within an experiment. It provides unified tracking of model artifacts, execution traces, evaluation metrics, and metadata throughout the development lifecycle. A trace is a log of inputs, outputs, and intermediate steps from a single application execution. Traces provide insights into application performance, execution flow, and response quality, enabling debugging and evaluation. With LoggedModel, you can track and compare different versions of your application, making it easier to identify issues, deploy the best version, and maintain a clear record of what was deployed and when.
To implement version tracking and tracing with managed MLflow 3.0 on SageMaker, you can establish a versioned model identity using a Git commit hash, set this as the active model context so all subsequent traces will be automatically linked to this specific version, enable automatic logging for Amazon Bedrock interactions, and then make an API call to Anthropic’s Claude 3.5 Sonnet that will be fully traced with inputs, outputs, and metadata automatically captured within the established model context. Managed MLflow 3.0 tracing is already integrated with various generative AI libraries and provides one-line automatic tracing experience for all the support libraries. For information about supported libraries, refer to Supported Integrations in the MLflow documentation.
After logging this information, you can track these generative AI experiments and the logged model for the agent in the managed MLflow 3.0 tracking server UI, as shown in the following screenshot.

In addition to the one-line auto tracing functionality, MLflow offers Python SDK for manually instrumenting your code and manipulating traces. Refer to the code sample notebook sagemaker_mlflow_strands.ipynb in the aws-samples GitHub repository, where we use MLflow manual instrumentation to trace Strands Agents. With tracing capabilities in fully managed MLflow 3.0, you can record the inputs, outputs, and metadata associated with each intermediate step of a request, so you can pinpoint the source of bugs and unexpected behaviors.
These capabilities provide observability in your AI workload by capturing detailed information about the execution of the workload services, nodes, and tools that you can see under the Traces tab.

You can inspect each trace, as shown in the following image, by choosing the request ID in the traces tab for the desired trace.

Fully managed MLflow 3.0 on Amazon SageMaker also introduces the capability to tag traces. Tags are mutable key-value pairs you can attach to traces to add valuable metadata and context. Trace tags make it straightforward to organize, search, and filter traces based on criteria such as user session, environment, model version, or performance characteristics. You can add, update, or remove tags at any stage—during trace execution using mlflow.update_current_trace() or after a trace is logged using the MLflow APIs or UI. Managed MLflow 3.0 makes it seamless to search and analyze traces, helping teams quickly pinpoint issues, compare agent behaviors, and optimize performance. The tracing UI and Python API both support powerful filtering, so you can drill down into traces based on attributes such as status, tags, user, environment, or execution time as shown in the screenshot below. For example, you can instantly find all traces with errors, filter by production environment, or search for traces from a specific request. This capability is essential for debugging, cost analysis, and continuous improvement of generative AI applications.
The following screenshot displays the traces returned when searching for the tag ‘Production’.

The following code snippet shows how you can use search for all traces in production with a successful status:
Generative AI use case walkthrough with MLflow tracing
Building and deploying generative AI agents such as chat-based assistants, code generators, or customer support assistants requires deep visibility into how these agents interact with large language models (LLMs) and external tools. In a typical agentic workflow, the agent loops through reasoning steps, calling LLMs and using tools or subsystems such as search APIs or Model Context Protocol (MCP) servers until it completes the user’s task. These complex, multistep interactions make debugging, optimization, and cost tracking especially challenging.
Traditional observability tools fall short in generative AI because agent decisions, tool calls, and LLM responses are dynamic and context-dependent. Managed MLflow 3.0 tracing provides comprehensive observability by capturing every LLM call, tool invocation, and decision point in your agent’s workflow. You can use this end-to-end trace data to:
- Debug agent behavior – Pinpoint where an agent’s reasoning deviates or why it produces unexpected outputs.
- Monitor tool usage – Discover how and when external tools are called and analyze their impact on quality and cost.
- Track performance and cost – Measure latency, token usage, and API costs at each step of the agentic loop.
- Audit and govern – Maintain detailed logs for compliance and analysis.
Imagine a real-world scenario using the managed MLflow 3.0 tracing UI for a sample finance customer support agent equipped with a tool to retrieve financial data from a datastore. While you’re developing a generative AI customer support agent or analyzing the agent behavior in production, you can observe how agent responses and the execution optionally call a product database tool for more accurate recommendations. For illustration, the first trace, shown in the following screenshot, shows the agent handling a user query without invoking any tools. The trace captures the prompt, agent response, and agent decision points. The agent’s response lacks product-specific details. The trace makes it clear that no external tool was called, and you quickly identify the behavior in the agent’s reasoning chain.

The second trace, shown in the following screenshot, captures the same agent, but this time it decides to call the product database tool. The trace logs the tool invocation, the returned product data, and how the agent incorporates this information into its final response. Here, you can observe improved answer quality, a slight increase in latency, and additional API cost with higher token usage.

By comparing these traces side by side, you can debug why the agent sometimes skips using the tool, optimize when and how tools are called, and balance quality against latency and cost. MLflow’s tracing UI makes these agentic loops transparent, actionable, and seamless to analyze at scale. This post’s sample agent and all necessary code is available on the aws-samples GitHub repository, where you can replicate and adapt it for your own applications.
Cleanup
After it’s created, a SageMaker managed MLflow tracking server will incur costs until you delete or stop it. Billing for tracking servers is based on the duration the servers have been running, the size selected, and the amount of data logged to the tracking servers. You can stop tracking servers when they’re not in use to save costs, or you can delete them using API or the SageMaker Studio UI. For more details on pricing, refer to Amazon SageMaker pricing.
Conclusion
Fully managed MLflow 3.0 on Amazon SageMaker AI is now available. Get started with sample code in the aws-samples GitHub repository. We invite you to explore this new capability and experience the enhanced efficiency and control it brings to your ML projects. To learn more, visit Machine Learning Experiments using Amazon SageMaker with MLflow.
For more information, visit the SageMaker Developer Guide and send feedback to AWS re:Post for SageMaker or through your usual AWS Support contacts.
About the authors
 Ram Vittal is a Principal ML Solutions Architect at AWS. He has over 3 decades of experience architecting and building distributed, hybrid, and cloud applications. He is passionate about building secure, scalable, reliable AI/ML and big data solutions to help enterprise customers with their cloud adoption and optimization journey to improve their business outcomes. In his spare time, he rides motorcycle and walks with his three-year old sheep-a-doodle!
 Sandeep Raveesh is a GenAI Specialist Solutions Architect at AWS. He works with customer through their AIOps journey across model training, Retrieval-Augmented-Generation (RAG), GenAI Agents, and scaling GenAI use-cases. He also focuses on Go-To-Market strategies helping AWS build and align products to solve industry challenges in the GenerativeAI space. You can find Sandeep on LinkedIn.
 Amit Modi is the product leader for SageMaker AIOps and Governance, and Responsible AI at AWS. With over a decade of B2B experience, he builds scalable products and teams that drive innovation and deliver value to customers globally.
 Rahul Easwar is a Senior Product Manager at AWS, leading managed MLflow and Partner AI Apps within the SageMaker AIOps team. With over 15 years of experience spanning startups to enterprise technology, he leverages his entrepreneurial background and MBA from Chicago Booth to build scalable ML platforms that simplify AI adoption for organizations worldwide. Connect with Rahul on LinkedIn to learn more about his work in ML platforms and enterprise AI solutions.