Permutation-Invariant Neural Networks for Reinforcement Learning

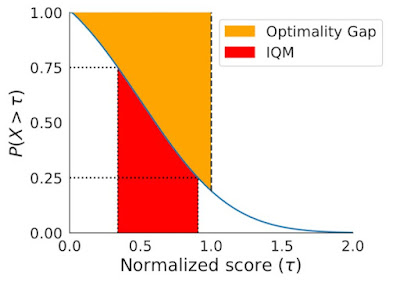
Posted by David Ha, Staff Research Scientist and Yujin Tang, Research Software Engineer, Google Research, Tokyo

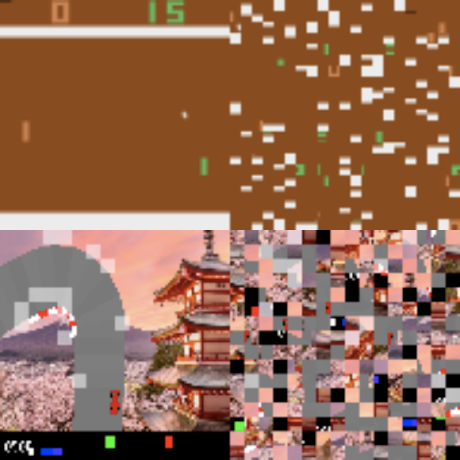
“The brain is able to use information coming from the skin as if it were coming from the eyes. We don’t see with the eyes or hear with the ears, these are just the receptors, seeing and hearing in fact goes on in the brain.”
Paul Bach-y-Rita, quoted in Livewired

People have the amazing ability to use one sensory modality (e.g., touch) to supply environmental information normally gathered by another sense (e.g., vision). This adaptive ability, called sensory substitution, is a phenomenon well-known to neuroscience. While difficult adaptations — such as adjusting to seeing things upside-down, learning to ride a “backwards” bicycle, or learning to “see” by interpreting visual information emitted from a grid of electrodes placed on one’s tongue — require anywhere from weeks, months or even years to attain mastery, people are able to eventually adjust to sensory substitutions.

Examples of Sensory Substitution. Left: Tongue Display Unit (Maris and Bach-y-Rita, 2001; Image: Kaczmarek, 2011). Right: “Upside down goggles” initially conceived by Erismann and Kohler in 1931. (Image Wikipedia).

In contrast, most neural networks are not able to adapt to sensory substitutions at all. For instance, most reinforcement learning (RL) agents require their inputs to be in a pre-specified format, or else they will fail. They expect fixed-size inputs and assume that each element of the input carries a precise meaning, such as the pixel intensity at a specified location, or state information, like position or velocity. In popular RL benchmark tasks (e.g., Ant or Cart-pole), an agent trained using current RL algorithms will fail if its sensory inputs are changed or if the agent is fed additional noisy inputs that are unrelated to the task at hand.

In “The Sensory Neuron as a Transformer: Permutation-Invariant Neural Networks for Reinforcement Learning”, a spotlight paper at NeurIPS 2021, we explore permutation invariant neural network agents, which require each of their sensory neurons (receptors that receive sensory inputs from the environment) to figure out the meaning and context of its input signal, rather than explicitly assuming a fixed meaning. Our experiments show that such agents are robust to observations that contain additional redundant or noisy information, and to observations that are corrupt and incomplete.

Permutation invariant reinforcement learning agents adapting to sensory substitutions. Left: The ordering of the ant’s 28 observations are randomly shuffled every 200 time-steps. Unlike the standard policy, our policy is not affected by the suddenly permuted inputs. Right: Cart-pole agent given many redundant noisy inputs (Interactive web-demo).

In addition to adapting to sensory substitutions in state-observation environments (like the ant and cart-pole examples), we show that these agents can also adapt to sensory substitutions in complex visual-observation environments (such as a CarRacing game that uses only pixel observations) and can perform when the stream of input images is constantly being reshuffled:

We partition the visual input from CarRacing into a 2D grid of small patches, and shuffled their ordering. Without any additional training, our agent still performs even when the original training background (left) is replaced with new images (right).

Method
Our approach takes observations from the environment at each time-step and feeds each element of the observation into distinct, but identical neural networks (called “sensory neurons”), each with no fixed relationship with one another. Each sensory neuron integrates over time information from only their particular sensory input channel. Because each sensory neuron receives only a small part of the full picture, they need to self-organize through communication in order for a global coherent behavior to emerge.

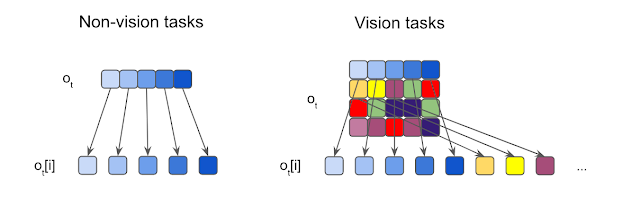
Illustration of observation segmentation.We segment each input into elements, which are then fed to independent sensory neurons. For non-vision tasks where the inputs are usually 1D vectors, each element is a scalar. For vision tasks, we crop each input image into non-overlapping patches.

We encourage neurons to communicate with each other by training them to broadcast messages. While receiving information locally, each individual sensory neuron also continually broadcasts an output message at each time-step. These messages are consolidated and combined into an output vector, called the global latent code, using an attention mechanism similar to that applied in the Transformer architecture. A policy network then uses the global latent code to produce the action that the agent will use to interact with the environment. This action is also fed back into each sensory neuron in the next time-step, closing the communication loop.

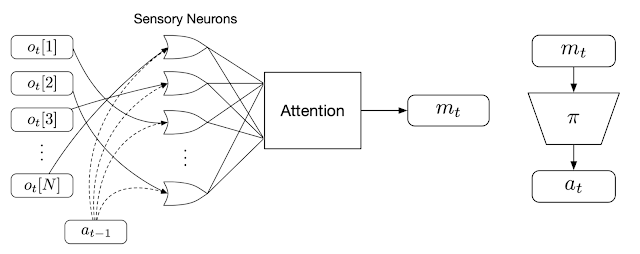
Overview of the permutation-invariant RL method. We first feed each individual observation (ot) into a particular sensory neuron (along with the agent’s previous action, at-1). Each neuron then produces and broadcasts a message independently, and an attention mechanism summarizes them into a global latent code (mt) that is given to the agent’s downstream policy network (𝜋) to produce the agent’s action at.

Why is this system permutation invariant? Each sensory neuron is an identical neural network that is not confined to only process information from one particular sensory input. In fact, in our setup, the inputs to each sensory neuron are not defined. Instead, each neuron must figure out the meaning of its input signal by paying attention to the inputs received by the other sensory neurons, rather than explicitly assuming a fixed meaning. This encourages the agent to process the entire input as an unordered set, making the system to be permutation invariant to its input. Furthermore, in principle, the agent can use as many sensory neurons as required, thus enabling it to process observations of arbitrary length. Both of these properties will help the agent adapt to sensory substitutions.

Results
We demonstrate the robustness and flexibility of this approach in simpler, state-observation environments, where the observations the agent receives as inputs are low-dimensional vectors holding information about the agent’s states, such as the position or velocity of its components. The agent in the popular Ant locomotion task has a total of 28 inputs with information that includes positions and velocities. We shuffle the order of the input vector several times during a trial and show that the agent is rapidly able to adapt and is still able to walk forward.

In cart-pole, the agent’s goal is to swing up a cart-pole mounted at the center of the cart and balance it upright. Normally the agent sees only five inputs, but we modify the cartpole environment to provide 15 shuffled input signals, 10 of which are pure noise, and the remainder of which are the actual observations from the environment. The agent is still able to perform the task, demonstrating the system’s capacity to work with a large number of inputs and attend only to channels it deems useful. Such flexibility may find useful applications for processing a large unspecified number of signals, most of which are noise, from ill-defined systems.

We also apply this approach to high-dimensional vision-based environments where the observation is a stream of pixel images. Here, we investigate screen-shuffled versions of vision-based RL environments, where each observation frame is divided into a grid of patches, and like a puzzle, the agent must process the patches in a shuffled order to determine a course of action to take. To demonstrate our approach on vision-based tasks, we created a shuffled version of Atari Pong.

Shuffled Pong results. Left: Pong agent trained to play using only 30% of the patches matches performance of Atari opponent. Right: Without extra training, when we give the agent more puzzle pieces, its performance increases.

Here the agent’s input is a variable-length list of patches, so unlike typical RL agents, the agent only gets to “see” a subset of patches from the screen. In the puzzle pong experiment, we pass to the agent a random sample of patches across the screen, which are then fixed through the remainder of the game. We find that we can discard 70% of the patches (at these fixed-random locations) and still train the agent to perform well against the built-in Atari opponent. Interestingly, if we then reveal additional information to the agent (e.g., allowing it access to more image patches), its performance increases, even without additional training. When the agent receives all the patches, in shuffled order, it wins 100% of the time, achieving the same result with agents that are trained while seeing the entire screen.

We find that imposing additional difficulty during training by using unordered observations has additional benefits, such as improving generalization to unseen variations of the task, like when the background of the CarRacing training environment is replaced with a novel image.

Shuffled CarRacing results. The agent has learned to focus its attention (indicated by the highlighted patches) on the road boundaries. Left: Training environment. Right: Test environment with new background.

Conclusion
The permutation invariant neural network agents presented here can handle ill-defined, varying observation spaces. Our agents are robust to observations that contain redundant or noisy information, or observations that are corrupt and incomplete. We believe that permutation invariant systems open up numerous possibilities in reinforcement learning.

If you’re interested to learn more about this work, we invite readers to read our interactive article (pdf version) or watch our video. We also released code to reproduce our experiments.

Read More

A decade in deep learning, and what’s next

Twenty years ago, Google started using machine learning, and 10 years ago, it helped spur rapid progress in AI using deep learning. Jeff Dean and Marian Croak of Google Research take a look at how we’ve innovated on these techniques and applied them in helpful ways, and look ahead to a responsible and inclusive path forward.

Jeff Dean

From research demos to AI that really works

I was first introduced to neural networks — computer systems that roughly imitate how biological brains accomplish tasks — as an undergrad in 1990. I did my senior thesis on using parallel computation to train neural networks. In those early days, I thought if we could 32X more compute power (using 32 processors at the time!), we could get neural networks to do impressive things. I was way off. It turns out we would need about 1 million times as much computational power before neural networks could scale to real-world problems.

A decade later, as an early employee at Google, I became reacquainted with machine learning when the company was still just a startup. In 2001 we used a simpler version of machine learning, statistical ML, to detect spam and suggest better spellings for people’s web searches. But it would be another decade before we had enough computing power to revive a more computationally-intensive machine learning approach called deep learning. Deep learning uses neural networks with multiple layers (thus the “deep”), so it can learn not just simple statistical patterns, but can learn subtler patterns of patterns — such as what’s in an image or what word was spoken in some audio. One of our first publications in 2012 was on a system that could find patterns among millions of frames from YouTube videos. That meant, of course, that it learned to recognize cats.

To get to the helpful features you use every day — searchable photo albums, suggestions on email replies, language translation, flood alerts, and so on — we needed to make years of breakthroughs on top of breakthroughs, tapping into the best of Google Research in collaboration with the broader research community. Let me give you just a couple examples of how we’ve done this.

A big moment for image recognition

In 2012, a paper wowed the research world for making a huge jump in accuracy on image recognition using deep neural networks, leading to a series of rapid advances by researchers outside and within Google. Further advances led to applications like Google Photos in 2015, letting you search photos by what’s in them. We then developed other deep learning models to help you find addresses in Google Maps, make sense of videos on YouTube, and explore the world around you using Google Lens. Beyond our products, we applied these approaches to health-related problems, such as detecting diabetic retinopathy in 2016, and then cancerous cells in 2017, and breast cancer in 2020. Better understanding of aerial imagery through deep learning let us launch flood forecasting in 2018, now expanded to cover more than 360 million people in 2021. It’s been encouraging to see how helpful these advances in image recognition have been.

Similarly, we’ve used deep learning to accelerate language understanding. With sequence-to-sequence learning in 2014, we began looking at how to understand strings of text using deep learning. This led to neural machine translation in Google Translate in 2016, which was a massive leap in quality, particularly for less prevalent languages. We developed neural language models further for Smart Reply in Gmail in 2017, which made it easier and faster for you to knock through your email, especially on mobile. That same year, Google invented Transformers, leading to BERT in 2018, then T5, and in 2021 MUM, which lets you ask Google much more nuanced questions. And with “sparse” models like GShard, we can dramatically improve on tasks like translation while using less energy.

We’ve driven a similar arc in understanding speech. In 2012, Google used deep neural networks to make major improvements to speech recognition on Android. We kept advancing the state of the art with higher-quality, faster, more efficient speech recognition systems. By 2019, we were able to put the entire neural network on-device so you could get accurate speech recognition even without a connection. And in 2021, we launched Live Translate on the Pixel 6 phone, letting you speak and be translated in 48 languages — all on-device, while you’re traveling with no Internet.

  • image of speech-to-text on phone

    Project Relate: A communication tool for people with speech impairments.

  • image of flood forecasting map on phone

    ML-based flood forecasting helps equip those in harm’s way with accurate and detailed alerts.

  • image of mammogram

    Google Health’s AI system helps radiologistsidentify cancer in mammograms with greater accuracy.

More invention ahead

As our research goes forward, we’re balancing more immediately applied research with more exploratory fundamental research. So we’re looking at how, for example, AI can aid scientific discovery, with a project like mapping the brain of a fly, which could one day help better understand and treat mental illness in people. We’re also pursuing quantum computing, which will likely take a decade or longer to reach wide-scale applications. This is why we publish nearly1000 papers a year, including around 200 related to responsible AI, and we’ve given over 6500 grants to external researchers over the past decade and a half.

Looking ahead from 2021 to 2031, I’m excited about the next-generation AI systems we can build, and how much more helpful they’ll be. We’re planting the seeds today with new architectures like Pathways, with more to come.

Marian Croak

Minding the gap(s)

As we develop these lines of research and turn them into useful technologies, we’re mindful of the broader societal impact of AI, and especially that technology has not always had an equitable impact. This is personal for me — I care deeply about ensuring that people from all different backgrounds and circumstances have a good experience.

So we’re increasing the depth and rigor of how we review and evaluate our research to ensure we’re developing it responsibly. We’re also scaling up what we learn by inventing new tools to understand and calibrate critical AI systems across Google’s products. We’re growing our organization to 200 experts in Responsible AI and Human Centered Technology, and working with hundreds of partners in product, privacy, security, and other teams across Google.

As one example of our work on responsible AI, Google Research began exploring the nascent field of ML fairness in 2016. The teams realized that on top of publishing papers, they could have a greater impact by teaching ML practitioners how to build with fairness in mind, as with the course we launched in 2018. We also started building interactive tools that coders and researchers could use, from the What-If Tool in 2018 to the 2019 launch of our Fairness Indicators tool, all the way to Know Your Data in 2021. All of these are concrete ways that AI developers can test their datasets and models to see what kind of biases and gaps there are, and start to work on mitigations to prevent unfair outcomes.

A principled approach

In fact, fairness is one of the key tenets of our AI Principles. We developed these principles in 2017 and published them in 2018, announcing not only the Principles themselves but a set of responsible AI practices with practical organizational and technical advice from what we’ve learned along the way. I was proud to be involved in the AI Principles review process from early on — I’ve seen firsthand how rigorous the teams at Google are on evaluating the technology we’re developing and deciding how best to deploy it in the real world.

Indeed, there are paths we’ve chosen not to go down — the AI Principles describe a number of areas we avoid. In line with our principles, we’ve taken a very cautious approach on face recognition. We recognize how fraught this area is not only in terms of privacy and surveillance concerns, but also its potential for unfair bias and impacts on historically marginalized groups. I’m glad that we’re taking this so thoughtfully and carefully.

We’re also developing technologies that help engineers apply the AI Principles directly — for example, incorporating privacy design principles. We invented Federated Learning in 2017 as a way to train ML models without your personal data leaving your phone. In 2018 we showed how well this works on Gboard, the free keyboard you can download for your phone — it learns to provide you more useful suggestions, while keeping what you type private on your device.

If you’re curious, you can learn more about all these veins of research, product impact, processes, and external engagement in our 2021 AI Principles Progress Update.

AI by everyone, for everyone

As we look to the decade ahead, it’s incredibly important that AI be built in a way that works well for everyone. That means building as inclusive a team as we can ourselves at Google. It also means ensuring the field as a whole increasingly represents the people whose lives it aims to improve.

I’m proud to lead the Black Leadership Advisory Group (BLAG) at Google. We helped craft and drive programs included in Google’s recent update on racial equity work. For example, we paired up new director-level hires with BLAG members, and the feedback has been really positive, with 80% of respondents saying they’d recommend the program. We’re looking at extending this to other groups, including for Latinx+ and Asian+ Googlers. We’re holding ourselves accountable as leaders too — we now evaluate all VPs and above at Google on progress on diversity, equity, and inclusion. This is crucial if we’re going to have a more representative set of researchers and engineers building future technologies.

For the broader research and computer science communities, we’re providing a wide variety of grants, programs, and collaborations that we hope will welcome a more representative range of researchers. Our Research Scholar Program, begun in 2021, gave grants to more than 50 universities in 15+ countries — and 43% of the principal investigators identify as part of a group that’s been historically marginalized in tech. Similarly, our exploreCSR and CS Research Mentorship programs support thousands of undergrads from marginalized groups. And we’re partnering with groups like the National Science Foundation on their new Institute for Human-AI Collaborations.

We’re doing everything we can to make AI work well for all people. We’ll not only help ensure products across Google are using the latest practices in responsible AI — we’ll also encourage new products and features that serve those who’ve historically missed out on helpful new technologies. One example is Project Relate, which uses machine learning to help people with speech impairments communicate and use technology more easily. Another is Real Tone, which helps our imaging products like our Pixel phone camera and Google Photos more accurately and beautifully represent a diverse range of skin tones. These are just the start.

We’re excited for what’s ahead in AI, for everyone.

Read More

Introducing TensorFlow Graph Neural Networks

Posted by Sibon Li, Jan Pfeifer and Bryan Perozzi and Douglas Yarrington

Today, we are excited to release TensorFlow Graph Neural Networks (GNNs), a library designed to make it easy to work with graph structured data using TensorFlow. We have used an earlier version of this library in production at Google in a variety of contexts (for example, spam and anomaly detection, traffic estimation, YouTube content labeling) and as a component in our scalable graph mining pipelines. In particular, given the myriad types of data at Google, our library was designed with heterogeneous graphs in mind. We are releasing this library with the intention to encourage collaborations with researchers in industry.

Why use GNNs?

Graphs are all around us, in the real world and in our engineered systems. A set of objects, places, or people and the connections between them is generally describable as a graph. More often than not, the data we see in machine learning problems is structured or relational, and thus can also be described with a graph. And while fundamental research on GNNs is perhaps decades old, recent advances in the capabilities of modern GNNs have led to advances in domains as varied as traffic prediction, rumor and fake news detection, modeling disease spread, physics simulations, and understanding why molecules smell.

Graphs can model the relationships between many different types of data, including web pages (left), social connections (center), or molecules (right).

A graph represents the relations (edges) between a collection of entities (nodes or vertices). We can characterize each node, edge, or the entire graph, and thereby store information in each of these pieces of the graph. Additionally, we can ascribe directionality to edges to describe information or traffic flow, for example.

GNNs can be used to answer questions about multiple characteristics of these graphs. By working at the graph level, we try to predict characteristics of the entire graph. We can identify the presence of certain “shapes,” like circles in a graph that might represent sub-molecules or perhaps close social relationships. GNNs can be used on node-level tasks, to classify the nodes of a graph, and predict partitions and affinity in a graph similar to image classification or segmentation. Finally, we can use GNNs at the edge level to discover connections between entities, perhaps using GNNs to “prune” edges to identify the state of objects in a scene.

Structure

TF-GNN provides building blocks for implementing GNN models in TensorFlow. Beyond the modeling APIs, our library also provides extensive tooling around the difficult task of working with graph data: a Tensor-based graph data structure, a data handling pipeline, and some example models for users to quickly onboard.

The various components of TF-GNN that make up the workflow.

The initial release of the TF-GNN library contains a number of utilities and features for use by beginners and experienced users alike, including:

  • A high-level Keras-style API to create GNN models that can easily be composed with other types of models. GNNs are often used in combination with ranking, deep-retrieval (dual-encoders) or mixed with other types of models (image, text, etc.)
    • GNN API for heterogeneous graphs. Many of the graph problems we approach at Google and in the real world contain different types of nodes and edges. Hence we chose to provide an easy way to model this.
  • A well-defined schema to declare the topology of a graph, and tools to validate it. This schema describes the shape of its training data and serves to guide other tools.
  • A GraphTensor composite tensor type which holds graph data, can be batched, and has graph manipulation routines available.
  • A library of operations on the GraphTensor structure:
    • Various efficient broadcast and pooling operations on nodes and edges, and related tools.
    • A library of standard baked convolutions, that can be easily extended by ML engineers/researchers.
    • A high-level API for product engineers to quickly build GNN models without necessarily worrying about its details.
  • An encoding of graph-shaped training data on disk, as well as a library used to parse this data into a data structure from which your model can extract the various features.

Example usage

In the example below, we build a model using the TF-GNN Keras API to recommend movies to a user based on what they watched and genres that they liked.

We use the ConvGNNBuilder method to specify the type of edge and node configuration, namely to use WeightedSumConvolution (defined below) for edges. And for each pass through the GNN, we will update the node values through a Dense interconnected layer:

    import tensorflow as tf
import tensorflow_gnn as tfgnn

# Model hyper-parameters:
h_dims = {'user': 256, 'movie': 64, 'genre': 128}

# Model builder initialization:
gnn = tfgnn.keras.ConvGNNBuilder(
lambda edge_set_name: WeightedSumConvolution(),
lambda node_set_name: tfgnn.keras.layers.NextStateFromConcat(
tf.keras.layers.Dense(h_dims[node_set_name]))
)

# Two rounds of message passing to target node sets:
model = tf.keras.models.Sequential([
gnn.Convolve({'genre'}), # sends messages from movie to genre
gnn.Convolve({'user'}), # sends messages from movie and genre to users
tfgnn.keras.layers.Readout(node_set_name="user"),
tf.keras.layers.Dense(1)
])

The code above works great, but sometimes we may want to use a more powerful custom model architecture for our GNNs. For example, in our previous use case, we might want to specify that certain movies or genres hold more weight when we give our recommendation. In the following snippet, we define a more advanced GNN with custom graph convolutions, in this case with weighted edges. We define the WeightedSumConvolution class to pool edge values as a sum of weights across all edges:

class WeightedSumConvolution(tf.keras.layers.Layer):
"""Weighted sum of source nodes states."""

def call(self, graph: tfgnn.GraphTensor,
edge_set_name: tfgnn.EdgeSetName) -> tfgnn.Field:
messages = tfgnn.broadcast_node_to_edges(
graph,
edge_set_name,
tfgnn.SOURCE,
feature_name=tfgnn.DEFAULT_STATE_NAME)
weights = graph.edge_sets[edge_set_name]['weight']
weighted_messages = tf.expand_dims(weights, -1) * messages
pooled_messages = tfgnn.pool_edges_to_node(
graph,
edge_set_name,
tfgnn.TARGET,
reduce_type='sum',
feature_value=weighted_messages)
return pooled_messages

Note that even though the convolution was written with only the source and target nodes in mind, TF-GNN makes sure it’s applicable and works on heterogeneous graphs (with various types of nodes and edges) seamlessly.

Next steps

You can check out the TF-GNN GitHub repo for more information. To stay up to date, you can read the TensorFlow blog, join the TensorFlow Forum at discuss.tensorflow.org, follow twitter.com/tensorflow, or subscribe to youtube.com/tensorflow. If you’ve built something you’d like to share, please submit it for our Community Spotlight at goo.gle/TFCS. For feedback, please file an issue on GitHub. Thank you!

Acknowledgments

The work described here was a research collaboration between Oleksandr Ferludin‎, Martin Blais, Jan Pfeifer‎, Arno Eigenwillig, Dustin Zelle, Bryan Perozzi and Da-Cheng Juan of Google, and Sibon Li, Alvaro Sanchez-Gonzalez, Peter Battaglia, Kevin Villela, Jennifer She and David Wong of DeepMind.

Read More

Predicting Text Readability from Scrolling Interactions

Posted by Sian Gooding, Intern, Google Research

Illiteracy affects at least 773 million people globally, both young and old. For these individuals, reading information from unfamiliar sources or on unfamiliar topics can be extremely difficult. Unfortunately, these inequalities have been further magnified by the global pandemic as a result of unequal access to education in reading and writing. In fact, UNESCO reports that over 100 million children are falling behind the minimum proficiency level in reading due to COVID-related school closures.

With increasing world-wide access to technology, reading on a device, such as a tablet or phone, has largely taken the place of traditional formats. This provides a unique opportunity to observe reading interactions, e.g., how a reader scrolls through a text, which can inform our understanding of what can make text difficult to read. This understanding is crucial when designing educational applications for low-proficiency readers and language learners, because it can be used to match learners with appropriately leveled texts as well as to support readers in understanding texts beyond their reading level.

In “Predicting Text Readability from Scrolling Interactions”, presented at CoNLL 2021, we show that data from on-device reading interactions can be used to predict how readable a text is. This novel approach provides insights into subjective readability — whether an individual reader has found a text accessible — and demonstrates that existing readability models can be improved by including feedback from scroll-based reading interactions. In order to encourage research in this area and to help enable more personalized tools for language learning and text simplification, we are releasing the dataset of reading interactions generated from our scrolling behavior–based readability assessment of English-language texts.

Understanding Text Difficulty
There are multiple aspects of a text that impact how difficult it is to read, including the vocabulary level, the syntactic structure, and overall coherence. Traditional machine learning approaches to measure readability have exclusively relied on such linguistic features. However, using these features alone does not work well for online content, because such content often contains abbreviations, emojis, broken text, and short passages, which detrimentally impact the performance of readability models.

To address this, we investigated whether aggregate data about the reading interactions of a group can be used to predict how difficult a text is, as well as how reading interactions may differ based on a readers’ understanding. When reading on a device, readers typically interact with text by scrolling in a vertical fashion, which we hypothesize can be used as a coarse proxy for reading comprehension. With this in mind, we recruited 518 paid participants and asked them to read English-language texts of different difficulty levels. We recorded the reading interactions by measuring different features of the participants’ scrolling behavior, such as the speed, acceleration and number of times areas of text were revisited. We then used this information to produce a set of features for a readability classifier.

Predicting Text Difficulty from Scrolling Behavior
We investigated which types of scrolling behaviors were most impacted by text difficulty and tested the significance using linear mixed effect models. In our set up, we have repeated measures, as multiple participants read the same texts and each participant reads more than one text. Using linear mixed-effect models gives us a higher confidence that the differences in interactions we are observing are because of the text difficulty, and not other random effects.

Our results showed that multiple reading behaviors differed significantly based on the text level, for example, the average, maximum and minimum acceleration of scrolling. We found the most significant features to be the total read time and the maximum reading speeds.

We then used these features as inputs to a machine learning algorithm. We designed and trained a support vector machine (i.e., a binary classifier) to predict whether a text is either advanced or elementary based only on scrolling behaviors as individuals interacted with it. The dataset on which the model was trained contains 60 articles, each of which were read by an average of 17 participants. From these interactions we produced aggregate features by taking the mean of the significant measures across participants.


We measured the accuracy of the approach using a metric called f-score, which measures how accurate the model is at classifying a text as either “easy” or “difficult” (where 1.0 reflects perfect classification accuracy). We are able to achieve an f-score of 0.77 on this task, using interaction features alone. This is the first work to show that it is possible to predict the readability of a text using only interaction features.

Improving Readability Models
In order to demonstrate the value of applying readability measures from scrolling behaviors to existing readability models, we integrated scroll-based features into the state-of-the-art automated readability assessment tool, which was released as part of the OneStopEnglish corpus. We found that the addition of interaction features improves the f-score of this model from 0.84 to 0.88. In addition, we were able to significantly outperform this system by using interaction information with simple vocabulary features, such as the number of words in the text, achieving an impressive f-score of 0.96.

In our study, we recorded comprehension scores to evaluate the understanding and readability of text for individuals. Participants were asked three questions per article to assess the reader’s understanding of what they had read. The interaction features of an individual’s scrolling behavior was represented as a high dimensional vector. To explore this data, we visualized the reading interaction features for each participant using t-distributed stochastic neighbor embeddings, which is a statistical method for visualizing high-dimensional data. The results revealed clusters in the comprehension score based on how well individuals understood the text. This shows that there is implicit information in reading interactions about the likelihood that an individual has understood a given text. We refer to this phenomenon as subjective readability. This information can be very useful for educational applications or for simplifying online content.

Plot showing t-SNE projection of scroll interactions in 2-dimensions. The color of each data point corresponds to the comprehension score. Clusters of comprehension scores indicate that there are correlations between reading behaviors and comprehension.

Finally, we investigated the extent to which reading interactions vary across audiences. We compared the average scrolling speed across different reader groups, covering reading proficiency and the reader’s first language. We found that the speed distribution varies depending on the proficiency and first language of the audience. This supports the case that first language and proficiency alter the reading behaviors of audiences, which allows us to contextualize the reading behavior of groups and better understand which areas of text may be harder for them to read.

Histogram showing the average speeds of scrolling (in vertical pixels per millisecond) across readers of different proficiency levels (beginner, intermediate and advanced), with lines showing the smoothed trend for each group. A higher average scroll speed indicates faster reading times. For example, a more challenging text that corresponds to slower scroll speeds by advanced readers is associated with higher scroll speeds by beginners because they engage with the text only superficially.

Histogram showing the average speeds of scrolling (in vertical pixels per millisecond) across audiences by first language of the readers, Tamil or English, with lines showing the smoothed trend for each group. A higher average scroll speed indicates faster reading times. Dark blue bars are where the histograms overlap.

Conclusion
This work is the first to show that reading interactions, such as scrolling behavior, can be used to predict the readability of text, which can yield numerous benefits. Such measures are language agnostic, unobtrusive, and robust to noisy text. Implicit user feedback allows insight into readability at an individual level, thereby allowing for a more inclusive and personalisable assessment of text difficulty. Furthermore, being able to judge the subjective readability of text benefits language learning and educational apps. We conducted a 518 participant study to investigate the impact of text readability on reading interactions and are releasing a novel dataset of the associated reading interactions. We confirm that there are statistically significant differences in the way that readers interact with advanced and elementary texts, and that the comprehension scores of individuals correlate with specific measures of scrolling interaction. For more information our conference presentation is available to view.

Acknowledgements
We thank our collaborators Yevgeni Berzak, Tony Mak and Matt Sharifi, as well as Dmitry Lagun and Blaise Aguera y Arcas for their helpful feedback on the paper.

Read More

RLiable: Towards Reliable Evaluation & Reporting in Reinforcement Learning

Posted by Rishabh Agarwal, Research Scientist and Pablo Samuel Castro, Staff Software Engineer, Google Research, Brain Team

Reinforcement learning (RL) is an area of machine learning that focuses on learning from experiences to solve decision making tasks. While the field of RL has made great progress, resulting in impressive empirical results on complex tasks, such as playing video games, flying stratospheric balloons and designing hardware chips, it is becoming increasingly apparent that the current standards for empirical evaluation might give a false sense of fast scientific progress while slowing it down.

To that end, in “Deep RL at the Edge of the Statistical Precipice”, accepted as an oral presentation at NeurIPS 2021, we discuss how statistical uncertainty of results needs to be considered, especially when using only a few training runs, in order for evaluation in deep RL to be reliable. Specifically, the predominant practice of reporting point estimates ignores this uncertainty and hinders reproducibility of results. Related to this, tables with per-task scores, as are commonly reported, can be overwhelming beyond a few tasks and often omit standard deviations. Furthermore, simple performance metrics like the mean can be dominated by a few outlier tasks, while the median score would remain unaffected even if up to half of the tasks had performance scores of zero. Thus, to increase the field’s confidence in reported results with a handful of runs, we propose various statistical tools, including stratified bootstrap confidence intervals, performance profiles, and better metrics, such as interquartile mean and probability of improvement. To help researchers incorporate these tools, we also release an easy-to-use Python library RLiable with a quickstart colab.

Statistical Uncertainty in RL Evaluation
Empirical research in RL relies on evaluating performance on a diverse suite of tasks, such as Atari 2600 video games, to assess progress. Published results on deep RL benchmarks typically compare point estimates of the mean and median scores aggregated across tasks. These scores are typically relative to some defined baseline and optimal performance (e.g., random agent and “average” human performance on Atari games, respectively) so as to make scores comparable across different tasks.

In most RL experiments, there is randomness in the scores obtained from different training runs, so reporting only point estimates does not reveal whether similar results would be obtained with new independent runs. A small number of training runs, coupled with the high variability in performance of deep RL algorithms, often leads to large statistical uncertainty in such point estimates.

The distribution of median human normalized scores on the Atari 100k benchmark, which contains 26 games, for five recently published algorithms, DER, OTR, CURL, two variants of DrQ, and SPR. The reported point estimates of median scores based on a few runs in publications, as shown by dashed lines, do not provide information about the variability in median scores and typically overestimate (e.g., CURL, SPR, DrQ) or underestimate (e.g., DER) the expected median, which can result in erroneous conclusions.

As benchmarks become increasingly more complex, evaluating more than a few runs will be increasingly demanding due to the increased compute and data needed to solve such tasks. For example, five runs on 50 Atari games for 200 million frames takes 1000+ GPU days. Thus, evaluating more runs is not a feasible solution for reducing statistical uncertainty on computationally demanding benchmarks. While prior work has recommended statistical significance tests as a solution, such tests are dichotomous in nature (either “significant” or “not significant”), so they often lack the granularity needed to yield meaningful insights and are widely misinterpreted.

Number of runs in RL papers over the years. Beginning with the Arcade Learning Environment (ALE), the shift toward computationally-demanding benchmarks has led to the practice of evaluating only a handful of runs per task, increasing the statistical uncertainty in point estimates.

Tools for Reliable Evaluation
Any aggregate metric based on a finite number of runs is a random variable, so to take this into account, we advocate for reporting stratified bootstrap confidence intervals (CIs), which predict the likely values of aggregate metrics if the same experiment were repeated with different runs. These CIs allow us to understand the statistical uncertainty and reproducibility of results. Such CIs use the scores on combined runs across tasks. For example, evaluating 3 runs each on Atari 100k, which contains 26 tasks, results in 78 sample scores for uncertainty estimation.

In each task, colored balls denote scores on different runs. To compute statified bootstrap CIs using the percentile method, bootstrap samples are created by randomly sampling scores with replacement proportionately from each task. Then, the distribution of aggregate scores on these samples is the bootstrapping distribution, whose spread around the center gives us the confidence interval.

Most deep RL algorithms often perform better on some tasks and training runs, but aggregate performance metrics can conceal this variability, as shown below.

Data with varied appearance but identical aggregate statistics. Source: Same Stats, Different Graphs.

Instead, we recommend performance profiles, which are typically used for comparing solve times of optimization software. These profiles plot the score distribution across all runs and tasks with uncertainty estimates using stratified bootstrap confidence bands. These plots show the total runs across all tasks that obtain a score above a threshold (𝝉) as a function of the threshold.

Performance profiles correspond to the empirical tail distribution of scores on runs combined across all tasks. Shaded regions show 95% stratified bootstrap confidence bands.

Such profiles allow for qualitative comparisons at a glance. For example, the curve for one algorithm above another means that one algorithm is better than the other. We can also read any score percentile, e.g., the profiles intersect y = 0.5 (dotted line above) at the median score. Furthermore, the area under the profile corresponds to the mean score.

While performance profiles are useful for qualitative comparisons, algorithms rarely outperform other algorithms on all tasks and thus their profiles often intersect, so finer quantitative comparisons require aggregate performance metrics. However, existing metrics have limitations: (1) a single high performing task may dominate the task mean score, while (2) the task median is unaffected by zero scores on nearly half of the tasks and requires a large number of training runs for small statistical uncertainty. To address the above limitations, we recommend two alternatives based on robust statistics: the interquartile mean (IQM) and the optimality gap, both of which can be read as areas under the performance profile, below.

IQM (red) corresponds to the area under the performance profile, shown in blue, between the 25 and 75 percentile scores on the x-axis. Optimality gap (yellow) corresponds to the area between the profile and horizontal line at y = 1 (human performance), for scores less than 1.

As an alternative to median and mean, IQM corresponds to the mean score of the middle 50% of the runs combined across all tasks. It is more robust to outliers than mean, a better indicator of overall performance than median, and results in smaller CIs, and so, requires fewer runs to claim improvements. Another alternative to mean, optimality gap measures how far an algorithm is from optimal performance.

IQM discards the lowest 25% and highest 25% of the combined scores (colored balls) and computes the mean of the remaining 50% scores.

For directly comparing two algorithms, another metric to consider is the average probability of improvement, which describes how likely an improvement over baseline is, regardless of its size. This metric is computed using the Mann-Whitney U-statistic, averaged across tasks.

Re-evaluating Evaluation
Using the above tools for evaluation, we revisit performance evaluations of existing algorithms on widely used RL benchmarks, revealing inconsistencies in prior evaluation. For example, in the Arcade Learning Environment (ALE), a widely recognized RL benchmark, the performance ranking of algorithms changes depending on the choice of aggregate metric. Since performance profiles capture the full picture, they often illustrate why such inconsistencies exist.

Median (left) and IQM (right) human normalized scores on the ALE as a function of the number of environment frames seen during training. IQM results in significantly smaller CIs than median scores.

On DM Control, a popular continuous control benchmark, there are large overlaps in 95% CIs of mean normalized scores for most algorithms.

DM Control Suite results, averaged across six tasks, on the 100k and 500k step benchmark. Since scores are normalized using maximum performance, mean scores correspond to one minus the optimality gap. The ordering of the algorithms is based on their claimed relative performance — all algorithms except Dreamer claimed improvement over at least one algorithm placed below them. Shaded regions show 95% CIs.

Finally, on Procgen, a benchmark for evaluating generalization in RL, the average probability of improvement shows that some claimed improvements are only 50-70% likely, suggesting that some reported improvements could be spurious.

Each row shows the probability that the algorithm X on the left outperforms algorithm Y on the right, given that X was claimed to be better than Y. Shaded region denotes 95% stratified bootstrap CIs.

Conclusion
Our findings on widely-used deep RL benchmarks show that statistical issues can have a large influence on previously reported results. In this work, we take a fresh look at evaluation to improve the interpretation of reported results and standardize experimental reporting. We’d like to emphasize the importance of published papers providing results for all runs to allow for future statistical analyses. To build confidence in your results, please check out our open-source library RLiable and the quickstart colab.

Acknowledgments
This work was done in collaboration with Max Schwarzer, Aaron Courville and Marc G. Bellemare. We’d like to thank Tom Small for an animated figure used in this post. We are also grateful for feedback by several members of the Google Research, Brain Team and DeepMind.

Read More

MIT Lincoln Laboratory wins nine R&D 100 Awards for 2021

Nine technologies developed at MIT Lincoln Laboratory have been selected as R&D 100 Award winners for 2021. Since 1963, this awards program has recognized the 100 most significant technologies transitioned to use or introduced into the marketplace over the past year. The winners are selected by an independent panel of expert judges. R&D World, an online publication that serves research scientists and engineers worldwide, announces the awards.

The winning technologies are diverse in their applications. One technology empowers medics to initiate life-saving interventions at the site of an emergency; another could help first responders find survivors buried under rubble. Others present new approaches to building motors at the microscale, combining arrays of optical fibers, and reducing electromagnetic interference in circuit boards. A handful of the awardees leverage machine learning to enable novel capabilities.

Field-programmable imaging array

Advanced imagers, such as lidars and high-resolution wide-field-of-view sensors, need the ability to process huge amounts of data directly in the system, or “on chip.” However, developing this capability for novel or niche applications is prohibitively expensive. To help designers overcome this barrier, Lincoln Laboratory developed a field-programmable imaging array to make high-performance on-chip digital processing available to a broad spectrum of new imaging applications.

The technology serves as a universal digital back end, adaptable to any type of optical detector. Once a front end for a specific detector type is integrated, the design cycle for new applications of that detector type can be greatly shortened.

Free-space Quantum Network Link Architecture

The Free-space Quantum Network Link Architecture enables the generation, distribution, and interaction of entangled photons across free-space links. These capabilities are crucial for the development of emerging quantum network applications, such as networked computing and distributed sensing.

Three primary technologies make up this system: a gigahertz clock-rate, three-stage pump laser system; a source of spectrally pure and long-duration entangled photons; and a pump-forwarding architecture that synchronizes quantum systems across free-space links with high precision. This architecture was successfully demonstrated over a 3.2-kilometer free-space atmospheric link between two buildings on Hanscom Air Force Base.

Global Synthetic Weather Radar

The Global Synthetic Weather Radar (GSWR) provides radar-like weather imagery and radar-forward forecasts for regions where actual weather radars are not deployed or are limited in range. The technology generates these synthetic images by using advanced machine learning techniques that combine satellite, lightning, numerical weather model, and radar truth data to produce its predictions.

The laboratory collaborated with the U.S. Air Force on this technology, which will help mission planners schedule operations in remote regions of the world. GSWR’s reliable imagery and forecasts can also provide decision-making guidance for emergency responders and for the transportation, agriculture, and tourism industries.

Guided Ultrasound Intervention Device

The Guided Ultrasound Intervention Device (GUIDE) is the first technology to enable a medic or emergency medical technician to catheterize a major blood vessel in a pre-hospital environment. This procedure can save lives from hemorrhage after traumatic injury.

To use GUIDE, a medic scans a target area of a patient with an ultrasound probe integrated with the device. The device then uses artificial intelligence software to locate a femoral vessel in real time and direct the medic to it via a gamified display. Once in position, the device inserts a needle and guide wire into the vessel, after which the medic can easily complete the process of catheterization. Similar to the impact of automated external defibrillators, GUIDE can empower non-experts to take life-saving measures at the scene of an emergency.

Microhydraulic motors

Microhydraulic motors provide a new way of making things move on a microscale. These tiny actuators are constructed by layering thin, disc-shaped polymer sheets on top of microfabricated electrodes and inserting droplets of water and oil in between the layers. A voltage applied to the electrodes distorts the surface tension of the droplets, causing them to move and rotate the entire disk with them.

These precise, powerful, and efficient motors could enable shape-changing materials, self-folding displays, or microrobots for medical procedures.

Monolithic fiber array launcher

A fiber array launcher is a subsystem that holds an array of optical fibers in place and shapes the laser beams emanating from the fibers. Traditional launchers are composed of many small components, which can become misaligned with vibration and are made of inefficient materials that absorb light. To address these problems, the laboratory developed a monolithic fiber array launcher.

Built out of a single piece of glass, this launcher is one-tenth the volume of traditional arrays and less susceptible to thermo-optic effects to allow for scaling to much higher laser powers and channel counts.

Motion Under Rubble Measured Using Radar

The Motion Under Rubble Measured Using Radar (MURMUR) technology was created to help rescue teams save lives in complex disaster environments. This remote-controlled system is mounted on a robotic ground vehicle for rapid deployment and uses radar to transmit low-frequency signals that penetrate walls, rubble, and debris. 

Signals that reflect back to the radar are digitized and then processed using both classical signal processing techniques and novel machine learning algorithms to determine the range in depth at which there is life-indicating motion, such as breathing, from someone buried under the rubble. Search-and-rescue personnel monitor these detections in real time on a mobile device, reducing time-consuming search efforts and enabling timely recovery of survivors.

Spectrally Efficient Digital Logic

Spectrally Efficient Digital Logic (SEDL) is a set of digital logic building blocks that operate with intrinsically low electromagnetic interference (EMI) emissions.

EMI emissions cause interference between electrical components and present security risks. These emission levels are often discovered late in the electronics development process, once all the pieces are put together, and are thus costly to fix. SEDL is designed to reduce EMI problems while being compatible with traditional logic, giving designers the freedom to construct systems composed of SEDL components entirely or a hybrid of traditional logic and SEDL. It also comes at comparable size, cost, and clock speed with respect to traditional logic.

Traffic Flow Impact Tool

Developed in collaboration with the Federal Aviation Administration, the Traffic Flow Impact Tool helps air traffic control managers handle disruptions to air traffic caused by dangerous weather, such as thunderstorms.

The tool uses a novel machine learning technique to fuse multiple convective weather forecast models and compute a metric called permeability, a measure of the amount of usable airspace in a given area. These permeability predictions are displayed on a user interface and allow managers to plan ahead for weather impacts to air traffic.

Since 2010, Lincoln Laboratory has received 75 R&D 100 Awards. The awards are a recognition of the laboratory’s transfer of unclassified technologies to industry and government. Each year, many technology transitions also occur for classified projects. This transfer of technology is central to the laboratory’s role as a federally funded research and development center.

“Our R&D 100 Awards recognize the significant, ongoing technology development and transition success at the laboratory. We have had much success with our classified work as well,” says Eric Evans, the director of Lincoln Laboratory. “We are very proud of everyone involved in these programs.”

Editors of R&D World announced the 2021 R&D 100 Award winners at virtual ceremonies broadcast on October 19, 20, and 21.

Read More