Putting artificial intelligence at the heart of health care — with help from MIT

Artificial intelligence is transforming industries around the world — and health care is no exception. A recent Mayo Clinic study found that AI-enhanced electrocardiograms (ECGs) have the potential to save lives by speeding diagnosis and treatment in patients with heart failure who are seen in the emergency room.

The lead author of the study is Demilade “Demi” Adedinsewo, a noninvasive cardiologist at the Mayo Clinic who is actively integrating the latest AI advancements into cardiac care and drawing largely on her learning experience with MIT Professional Education.

Identifying AI opportunities in health care

A dedicated practitioner, Adedinsewo is a Mayo Clinic Florida Women’s Health Scholar and director of research for the Cardiovascular Disease Fellowship program. Her clinical research interests include cardiovascular disease prevention, women’s heart health, cardiovascular health disparities, and the use of digital tools in cardiovascular disease management.

Adedinsewo’s interest in AI emerged toward the end of her cardiology fellowship, when she began learning about its potential to transform the field of health care. “I started to wonder how we could leverage AI tools in my field to enhance health equity and alleviate cardiovascular care disparities,” she says.

During her fellowship at the Mayo Clinic, Adedinsewo began looking at how AI could be used with ECGs to improve clinical care. To determine the effectiveness of the approach, the team retroactively used deep learning to analyze ECG results from patients with shortness of breath. They then compared the results with the current standard of care — a blood test analysis — to determine if the AI enhancement improved the diagnosis of cardiomyopathy, a condition where the heart is unable to adequately pump blood to the rest of the body. While she understood the clinical implications of the research, she found the AI components challenging.

“Even though I have a medical degree and a master’s degree in public health, those credentials aren’t really sufficient to work in this space,” Adedinsewo says. “I began looking for an opportunity to learn more about AI so that I could speak the language, bridge the gap, and bring those game-changing tools to my field.”

Bridging the gap at MIT

Adedinsewo’s desire to bring together advanced data science and clinical care led her to MIT Professional Education, where she recently completed the Professional Certificate Program in Machine Learning & AI. To date, she has completed nine courses, including AI Strategies and Roadmap.

“All of the courses were great,” Adedinsewo says. “I especially appreciated how the faculty, like professors Regina Barzilay, Tommi Jaakkola, and Stefanie Jegelka, provided practical examples from health care and non–health care fields to illustrate what we were learning.”

Adedinsewo’s goals align closely with those of Barzilay, the AI lead for the MIT Jameel Clinic for Machine Learning in Health. “There are so many areas of health care that can benefit from AI,” Barzilay says. “It’s exciting to see practitioners like Demi join the conversation and help identify new ideas for high-impact AI solutions.”

Adedinsewo also valued the opportunity to work and learn within the greater MIT community alongside accomplished peers from around the world, explaining that she learned different things from each person. “It was great to get different perspectives from course participants who deploy AI in other industries,” she says.

Putting knowledge into action

Armed with her updated AI toolkit, Adedinsewo was able to make meaningful contributions to Mayo Clinic’s research. The team successfully completed and published their ECG project in August 2020, with promising results. In analyzing the ECGs of about 1,600 patients, the AI-enhanced method was both faster and more effective — outperforming the standard blood tests with a performance measure (AUC) of 0.89 versus 0.80. This improvement could enhance health outcomes by improving diagnostic accuracy and increasing the speed with which patients receive appropriate care.

But the benefits of Adedinsewo’s MIT experience go beyond a single project. Adedinsewo says that the tools and strategies she acquired have helped her communicate the complexities of her work more effectively, extending its reach and impact. “I feel more equipped to explain the research — and AI strategies in general — to my clinical colleagues. Now, people reach out to me to ask, ‘I want to work on this project. Can I use AI to answer this question?’’ she said.

Looking to the AI-powered future

What’s next for Adedinsewo’s research? Taking AI mainstream within the field of cardiology. While AI tools are not currently widely used in evaluating Mayo Clinic patients, she believes they hold the potential to have a significant positive impact on clinical care.

“These tools are still in the research phase,” Adedinsewo says. “But I’m hoping that within the next several months or years we can start to do more implementation research to see how well they improve care and outcomes for cardiac patients over time.”

Bhaskar Pant, executive director of MIT Professional Education, says “We at MIT Professional Education feel particularly gratified that we are able to provide practitioner-oriented insights and tools in machine learning and AI from expert MIT faculty to frontline health researchers such as Dr. Demi Adedinsewo, who are working on ways to enhance markedly clinical care and health outcomes in cardiac and other patient populations. This is also very much in keeping with MIT’s mission of ‘working with others for the betterment of humankind!’”

Read More

SimVLM: Simple Visual Language Model Pre-training with Weak Supervision

Posted by Zirui Wang, Student Researcher and Yuan Cao, Research Scientist, Google Research, Brain Team

Vision-language modeling grounds language understanding in corresponding visual inputs, which can be useful for the development of important products and tools. For example, an image captioning model generates natural language descriptions based on its understanding of a given image. While there are various challenges to such cross-modal work, significant progress has been made in the past few years on vision-language modeling thanks to the adoption of effective vision-language pre-training (VLP). This approach aims to learn a single feature space from both visual and language inputs, rather than learning two separate feature spaces, one each for visual inputs and another for language inputs. For this purpose, existing VLP often leverages an object detector, like Faster R-CNN, trained on labeled object detection datasets to isolate regions-of-interest (ROI), and relies on task-specific approaches (i.e., task-specific loss functions) to learn representations of images and texts jointly. Such approaches require annotated datasets or time to design task-specific approaches, and so, are less scalable.

To address this challenge, in “SimVLM: Simple Visual Language Model Pre-training with Weak Supervision”, we propose a minimalist and effective VLP, named SimVLM, which stands for “Simple Visual Language Model”. SimVLM is trained end-to-end with a unified objective, similar to language modeling, on a vast amount of weakly aligned image-text pairs (i.e., the text paired with an image is not necessarily a precise description of the image). The simplicity of SimVLM enables efficient training on such a scaled dataset, which helps the model to achieve state-of-the-art performance across six vision-language benchmarks. Moreover, SimVLM learns a unified multimodal representation that enables strong zero-shot cross-modality transfer without fine-tuning or with fine-tuning only on text data, including for tasks such as open-ended visual question answering, image captioning and multimodal translation.

Model and Pre-training Procedure
Unlike existing VLP methods that adopt pre-training procedures similar to masked language modeling (like in BERT), SimVLM adopts the sequence-to-sequence framework and is trained with a one prefix language model (PrefixLM) objective, which receives the leading part of a sequence (the prefix) as inputs, then predicts its continuation. For example, given the sequence “A dog is chasing after a yellow ball”, the sequence is randomly truncated to “A dog is chasing” as the prefix, and the model will predict its continuation. The concept of a prefix similarly applies to images, where an image is divided into a number of “patches”, then a subset of those patches are sequentially fed to the model as inputs—this is called an “image patch sequence”. In SimVLM, for multimodal inputs (e.g., images and their captions), the prefix is a concatenation of both the image patch sequence and prefix text sequence, received by the encoder. The decoder then predicts the continuation of the textual sequence. Compared to prior VLP models combining several pre-training losses, the PrefixLM loss is the only training objective and significantly simplifies the training process. This approach for SimVLM maximizes its flexibility and universality in accommodating different task setups.

Finally, due to its success for both language and vision tasks, like BERT and ViT, we adopt the Transformer architecture as the backbone of our model, which, unlike prior ROI-based VLP approaches, enables the model to directly take in raw images as inputs. Moreover, inspired by CoAtNet, we adopt a convolution stage consisting of the first three blocks of ResNet in order to extract contextualized patches, which we find more advantageous than the naïve linear projection in the original ViT model. The overall model architecture is illustrated below.

Overview of the SimVLM model architecture.

The model is pre-trained on large-scale web datasets for both image-text and text-only inputs. For joint vision and language data, we use the training set of ALIGN which contains about 1.8B noisy image-text pairs. For text-only data, we use the Colossal Clean Crawled Corpus (C4) dataset introduced by T5, totaling 800G web-crawled documents.

Benchmark Results
After pre-training, we fine-tune our model on the following multimodal tasks: VQA, NLVR2, SNLI-VE, COCO Caption, NoCaps and Multi30K En-De. For example, for VQA the model takes an image and corresponding questions about the input image, and generates the answer as output. We evaluate SimVLM models of three different sizes (base: 86M parameters, large: 307M and huge: 632M) following the same setup as in ViT. We compare our results with strong existing baselines, including LXMERT, VL-T5, UNITER, OSCAR, Villa, SOHO, UNIMO, VinVL, and find that SimVLM achieves state-of-the-art performance across all these tasks despite being much simpler.

VQA       NLVR2       SNLI-VE       CoCo Caption
Model test-dev test-std   dev   test-P dev test B@4 M C S
LXMERT 72.4 72.5 74.9 74.5
VL-T5 70.3 74.6 73.6 116.5
UNITER 73.8 74 79.1 80 79.4 79.4
OSCAR 73.6 73.8 79.1 80.4 41.7 30.6 140 24.5
Villa 74.7 74.9 79.8 81.5 80.2 80
SOHO 73.3 73.5 76.4 77.3 85 85
UNIMO 75.1 75.3 81.1 80.6 39.6 127.7
VinVL 76.6 76.6 82.7 84 41 31.1 140.9 25.2
SimVLM base 77.9 78.1 81.7 81.8 84.2 84.2 39 32.9 134.8 24
SimVLM large 79.3 79.6 84.1 84.8 85.7 85.6 40.3 33.4 142.6 24.7
SimVLM huge    80 80.3 84.5 85.2  86.2   86.3   40.6   33.7   143.3   25.4 
Evaluation results on a subset of 6 vision-language benchmarks in comparison with existing baseline models. Metrics used above (higher is better): BLEU-4 (B@4), METEOR (M), CIDEr (C), SPICE (S). Similarly, evaluation on NoCaps and Multi30k En-De also show state-of-the-art performance.

Zero-Shot Generalization
Since SimVLM has been trained on large amounts of data from both visual and textual modalities, it is interesting to ask whether it is capable of performing zero-shot cross-modality transfer. We examine the model on multiple tasks for this purpose, including image captioning, multilingual captioning, open-ended VQA and visual text completion. We take the pre-trained SimVLM and directly decode it for multimodal inputs with fine-tuning only on text data or without fine-tuning entirely. Some examples are given in the figure below. It can be seen that the model is able to generate not only high-quality image captions, but also German descriptions, achieving cross-lingual and cross-modality transfer at the same time.

Examples of SimVLM zero-shot generalization. (a) Zero-shot image captioning: Given an image together with text prompts, the pre-trained model predicts the content of the image without fine-tuning. (b) zero-shot cross-modality transfer on German image captioning: The model generates captions in German even though it has never been fine-tuned on image captioning data in German. (c) Generative VQA: The model is capable of generating answers outside the candidates of the original VQA dataset. (d) Zero-shot visual text completion: The pre-trained model completes a textual description grounded on the image contents; (e) Zero-shot open-ended VQA: The model provides factual answers to the questions about images, after continued pre-training on the WIT dataset. Images are from NoCaps, which come from the Open Images dataset under the CC BY 2.0 license.

To quantify SimVLM’s zero-shot performance, we take the pre-trained, frozen model and decode it on the COCO Caption and NoCaps benchmarks, then compare with supervised baselines. Even without supervised fine-tuning (in the middle-rows), SimVLM can reach zero-shot captioning quality close to the quality of supervised methods.

Zero shot image captioning results. Here “Pre.” indicates the model is pre-trained and “Sup.” means the model is finetuned on task-specific supervision. For NoCaps, [In, Near, Out] refer to in-domain, near-domain and out-of-domain respectively. We compare results from BUTD, AoANet, M2 Transformer, OSCAR and VinVL. Metrics used above (higher is better): BLEU-4 (B@4), METEOR (M), CIDEr (C), SPICE (S). For NoCaps, CIDEr numbers are reported.

Conclusion
We propose a simple yet effective framework for VLP. Unlike prior work using object detection models and task-specific auxiliary losses, our model is trained end-to-end with a single prefix language model objective. On various vision-language benchmarks, this approach not only obtains state-of-the-art performance, but also exhibits intriguing zero-shot behaviors in multimodal understanding tasks.

Acknowledgements
We would like to thank Jiahui Yu, Adams Yu, Zihang Dai, Yulia Tsvetkov for preparation of the SimVLM paper, Hieu Pham, Chao Jia, Andrew Dai, Bowen Zhang, Zhifeng Chen, Ruoming Pang, Douglas Eck, Claire Cui and Yonghui Wu for helpful discussions, Krishna Srinivasan, Samira Daruki, Nan Du and Aashi Jain for help with data preparation, Jonathan Shen, Colin Raffel and Sharan Narang for assistance on experimental settings, and others on the Brain team for support throughout this project.

Read More

Qubit the dog on the big questions in quantum computing

This week we sat down for an interview with Qubit the dog, whose human Julian Kelly is one of our lead Research Scientists with Google Quantum AI. Qubit was born in 2012, right when Julian and team were first designing the qubits that now underlie Google’s quantum computers. He nearly received the honor of pressing the submit button for the team’s beyond-classical result published in Nature, but he was narrowly edged out by a human.

Qubit has never been interviewed before on such a range of technical and philosophical topics, so it was a privilege to have the opportunity — a transcript of the discussion follows.

Thank you for taking the time to sit down for this, Qubit. Given the complexity and depth of the topic, I was hoping we could jump right in. I first wanted to ask — where do you think we are in the “hype cycle” of quantum computing? Is this analogous to earlier hype cycles around ecommerce, AI, mobile technology or other major shifts where the hype may have led to “winters” for some time before the technology caught up and eventually surpassed the initial expectations about the significance of its impact on users and society, especially in terms on unexpected applications and feedback dynamics?

Ruff!

Okay, that makes sense, there does seem to be a certain unavoidable nature to that cycle that resolves itself naturally. But how should we consider investment in alternate veins of quantum computing research and development — for example, while there appears to be a viable roadmap for superconducting qubits, with evidence that error suppression can scale and enable a fully fault-tolerant large-scale quantum computer within the decade, does it make sense to also explore more speculative approaches such as photonics or spin qubits?

[Licks rear left foot]

Granted, that may all shake out in time as these technical milestones prove out. What, if I may ask, has led to Google being able to publish the series of verified empirical demonstrations that it has? We’ve seen a number of exciting firsts — the first demonstration of a beyond-classical computation of any kind on a quantum computer in 2019, the most impressive chemistry simulation on a quantum computer earlier in 2021, and most recently the first demonstration that errors can be exponentially suppressed with the number qubits. What about Google’s team or particular approach allows for this pace of breakthroughs?

[Smiles, pants amicably]
A small dog with light brown fur looks up at a quantum computer

Qubit inspecting a dilution refrigerator for proper signal routing

Maybe that confidence is warranted. Of course, even if the technical path is reasonable, there are a lot of open questions about the eventual applications of quantum computing. Google’s group includes “AI” in its name — Google Quantum AI — so I assume you think quantum computing could eventually lead to more effective forms of machine learning? Or are you more excited about applications such as simulating chemical reactions and exotic materials, so we might develop better batteries and solar panels, or achieve efficient nitrogen fixation for farming fertilizer and save 2% of the world’s carbon emissions?

Yap, yap!

And do you subscribe to the “many worlds” hypothesis, and the notion that quantum computers’ power will come from essentially processing information in other parallel universes, or is this perhaps too far-fetched and unnecessary for understanding where the double exponential speedup, that is, “Neven’s Law,” comes from? Is a more conventional understanding all we need to grasp the implications of this new regime of compute space?

Rup [burps].

Thank you so much. One last question, and then I’ll let you go — what’s the deal with time crystals?

[Blinks twice, then trots off to get a treat.]

Read More

Baselines for Uncertainty and Robustness in Deep Learning

Posted by Zachary Nado, Research Engineer and Dustin Tran, Research Scientist, Google Research, Brain Team

Machine learning (ML) is increasingly being used in real-world applications, so understanding the uncertainty and robustness of a model is necessary to ensure performance in practice. For example, how do models behave when deployed on data that differs from the data on which they were trained? How do models signal when they are likely to make a mistake?

To get a handle on an ML model’s behavior, its performance is often measured against a baseline for the task of interest. With each baseline, researchers must try to reproduce results only using descriptions from the corresponding papers , which results in serious challenges for replication. Having access to the code for experiments may be more useful, assuming it is well-documented and maintained. But even this is not enough, because the baselines must be rigorously validated. For example, in retrospective analyses over a collection of works [1, 2, 3], authors often find that a simple well-tuned baseline outperforms more sophisticated methods. In order to truly understand how models perform relative to each other, and enable researchers to measure whether new ideas in fact yield meaningful progress, models of interest must be compared to a common baseline.

In “Uncertainty Baselines: Benchmarks for Uncertainty & Robustness in Deep Learning”, we introduce Uncertainty Baselines, a collection of high-quality implementations of standard and state-of-the-art deep learning methods for a variety of tasks, with the goal of making research on uncertainty and robustness more reproducible. The collection spans 19 methods across nine tasks, each with at least five metrics. Each baseline is a self-contained experiment pipeline with easily reusable and extendable components and with minimal dependencies outside of the framework in which it is written. The included pipelines are implemented in TensorFlow, PyTorch, and Jax. Additionally, the hyperparameters for each baseline have been extensively tuned over numerous iterations so as to provide even stronger results.

Uncertainty Baselines
As of this writing, Uncertainty Baselines provides a total of 83 baselines, comprising 19 methods encompassing standard and more recent strategies over nine datasets. Example methods include BatchEnsemble, Deep Ensembles, Rank-1 Bayesian Neural Nets, Monte Carlo Dropout, and Spectral-normalized Neural Gaussian Processes. It acts as a successor in merging several popular benchmarks in the community: Can You Trust Your Model’s Uncertainty?, BDL benchmarks, and Edward2’s baselines.

Dataset Inputs Output Train Examples Test Datasets
CIFAR RGB images 10-class distribution 50,000 3
ImageNet RGB images 1000-class distribution 1,281,167 6
CLINC Intent Detection Dialog system query text 150-class distribution (in 10 domains) 15,000 2
Kaggle’s Diabetic Retinopathy Detection RGB images Probability of Diabetic Retinopathy 35,126 1
Wikipedia Toxicity Wikipedia comment text Probability of toxicity 159,571 3

A subset of 5 out of 9 available datasets for which baselines are provided. The datasets span tabular, text, and image modalities.

Uncertainty Baselines sets up each baseline under a choice of base model, training dataset, and a suite of evaluation metrics. Each is then tuned over its hyperparameters to maximize performance on such metrics. The available baselines vary among these three axes:

Modularity and Reusability
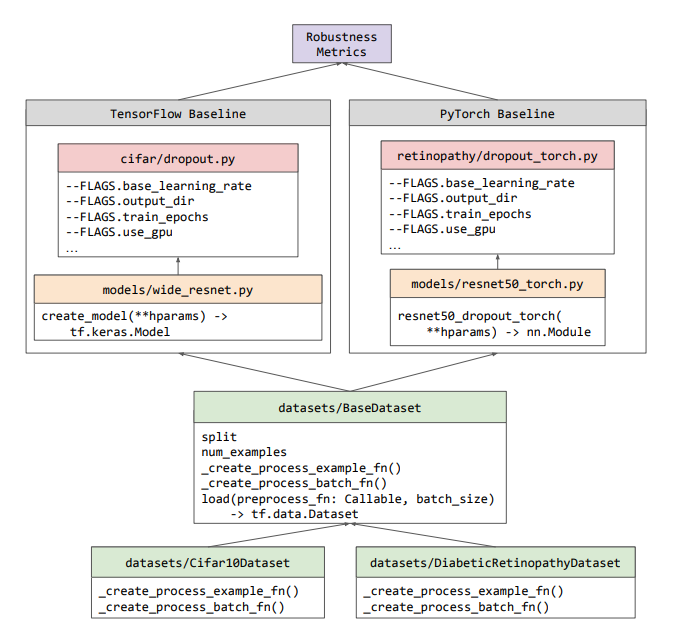
In order for researchers to use and build on the baselines, we deliberately optimized them to be as modular and minimal as possible. As seen in the workflow figure below, Uncertainty Baselines introduces no new class abstractions, instead reusing classes that pre-exist in the ecosystem (e.g., TensorFlow’s tf.data.Dataset). The train/evaluation pipeline for each of the baselines is contained in a standalone Python file for that experiment, which can run on CPU, GPU, or Google Cloud TPUs. Because of this independence between baselines, we are able to develop baselines in any of TensorFlow, PyTorch or JAX.

Workflow diagram for how the different components of Uncertainty Baselines are structured. All datasets are subclasses of the BaseDataset class, which provides a simple API for use in baselines written with any of the supported frameworks. The outputs from any of the baselines can then be analyzed with the Robustness Metrics library.

One area of debate among research engineers is how to manage hyperparameters and other experiment configuration values, which can easily number in the dozens. Instead of using one of the many frameworks built for this, and risk users having to learn yet another library, we opted to simply use Python flags, i.e., flags defined using Abseil that follow Python conventions. This should be a familiar technique to most researchers, and is easy to extend and plug into other pipelines.

Reproducibility
In addition to being able to run each of our baselines using the documented commands and get the same reported results, we also aim to release hyperparameter tuning results and final model checkpoints for further reproducibility. Right now we only have these fully open-sourced for the Diabetic Retinopathy baselines, but we will continue to upload more results as we run them. Additionally, we have examples of baselines that are exactly reproducible up to hardware determinism.

Practical Impact
Each of the baselines included in our repository has gone through extensive hyperparameter tuning, and we hope that researchers can readily reuse this effort without the need for expensive retraining or retuning. Additionally, we hope to avoid minor differences in the pipeline implementations affecting baseline comparisons.

Uncertainty Baselines has already been used in numerous research projects. If you are a researcher with other methods or datasets you would like to contribute, please open a GitHub issue to start a discussion!

Acknowledgements
We would like to thank a number of folks who are codevelopers, provided guidance, and/or helped review this post: Neil Band, Mark Collier, Josip Djolonga, Michael W. Dusenberry, Sebastian Farquhar, Angelos Filos, Marton Havasi, Rodolphe Jenatton, Ghassen Jerfel, Jeremiah Liu, Zelda Mariet, Jeremy Nixon, Shreyas Padhy, Jie Ren, Tim G. J. Rudner, Yeming Wen, Florian Wenzel, Kevin Murphy, D. Sculley, Balaji Lakshminarayanan, Jasper Snoek, Yarin Gal.

Read More

An ML-Based Framework for COVID-19 Epidemiology

Posted by Joel Shor, Software Engineer, Google Research and Sercan Arik, Research Scientist, Google Research, Cloud AI Team

Over the past 20 months, the COVID-19 pandemic has had a profound impact on daily life, presented logistical challenges for businesses planning for supply and demand, and created difficulties for governments and organizations working to support communities with timely public health responses. While there have been well-studied epidemiology models that can help predict COVID-19 cases and deaths to help with these challenges, this pandemic has generated an unprecedented amount of real-time publicly-available data, which makes it possible to use more advanced machine learning techniques in order to improve results.

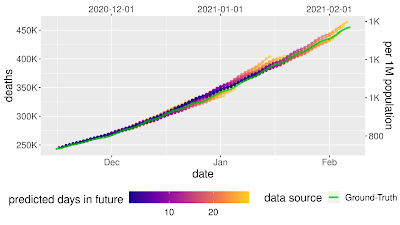
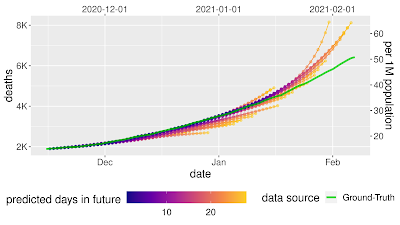
In “A prospective evaluation of AI-augmented epidemiology to forecast COVID-19 in the USA and Japan“, accepted to npj Digital Medicine, we continued our previous work [1, 2, 3, 4] and proposed a framework designed to simulate the effect of certain policy changes on COVID-19 deaths and cases, such as school closings or a state-of-emergency at a US-state, US-county, and Japan-prefecture level, using only publicly-available data. We conducted a 2-month prospective assessment of our public forecasts, during which our US model tied or outperformed all other 33 models on COVID19 Forecast Hub. We also released a fairness analysis of the performance on protected sub-groups in the US and Japan. Like other Google initiatives to help with COVID-19 [1, 2, 3], we are releasing daily forecasts based on this work to the public for free, on the web [us, ja] and through BigQuery.

Prospective forecasts for the USA and Japan models. Ground truth cumulative deaths counts (green lines) are shown alongside the forecasts for each day. Each daily forecast contains a predicted increase in deaths for each day during the prediction window of 4 weeks (shown as colored dots, where shading shifting to yellow indicates days further from the date of prediction in the forecasting horizon, up to 4 weeks). Predictions of deaths are shown for the USA (above) and Japan (below).

The Model
Models for infectious diseases have been studied by epidemiologists for decades. Compartmental models are the most common, as they are simple, interpretable, and can fit different disease phases effectively. In compartmental models, individuals are separated into mutually exclusive groups, or compartments, based on their disease status (such as susceptible, exposed, or recovered), and the rates of change between these compartments are modeled to fit the past data. A population is assigned to compartments representing disease states, with people flowing between states as their disease status changes.

In this work, we propose a few extensions to the Susceptible-Exposed-Infectious-Removed (SEIR) type compartmental model. For example, susceptible people becoming exposed causes the susceptible compartment to decrease and the exposed compartment to increase, with a rate that depends on disease spreading characteristics. Observed data for COVID-19 associated outcomes, such as confirmed cases, hospitalizations and deaths, are used for training of compartmental models.

Visual explanation of “compartmental” models in epidemiology. People “flow” between compartments. Real-world events, like policy changes and more ICU beds, change the rate of flow between compartments.

Our framework proposes a number of novel technical innovations:

  1. Learned transition rates: Instead of using static rates for transitions between compartments across all locations and times, we use machine-learned rates to map them. This allows us to take advantage of the vast amount of available data with informative signals, such as Google’s COVID-19 Community Mobility Reports, healthcare supply, demographics, and econometrics features.
  2. Explainability: Our framework provides explainability for decision makers, offering insights on disease propagation trends via its compartmental structure, and suggesting which factors may be most important for driving compartmental transitions.
  3. Expanded compartments: We add hospitalization, ICU, ventilator, and vaccine compartments and demonstrate efficient training despite data sparsity.
  4. Information sharing across locations: As opposed to fitting to an individual location, we have a single model for all locations in a country (e.g., >3000 US counties) with distinct dynamics and characteristics, and we show the benefit of transferring information across locations.
  5. Seq2seq modeling: We use a sequence-to-sequence model with a novel partial teacher forcing approach that minimizes amplified growth of errors into the future.

Forecast Accuracy
Each day, we train models to predict COVID-19 associated outcomes (primarily deaths and cases) 28 days into the future. We report the mean absolute percentage error (MAPE) for both a country-wide score and a location-level score, with both cumulative values and weekly incremental values for COVID-19 associated outcomes.

We compare our framework with alternatives for the US from the COVID19 Forecast Hub. In MAPE, our models outperform all other 33 models except one — the ensemble forecast that also includes our model’s predictions, where the difference is not statistically significant.

We also used prediction uncertainty to estimate whether a forecast is likely to be accurate. If we reject forecasts that the model considers uncertain, we can improve the accuracy of the forecasts that we do release. This is possible because our model has well-calibrated uncertainty.

Mean average percentage error (MAPE, the lower the better) decreases as we remove uncertain forecasts, increasing accuracy.

What-If Tool to Simulate Pandemic Management Policies and Strategies
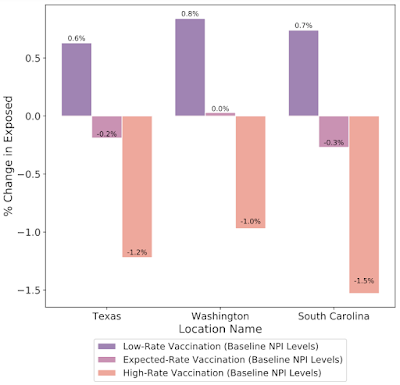
In addition to understanding the most probable scenario given past data, decision makers are interested in how different decisions could affect future outcomes, for example, understanding the impact of school closures, mobility restrictions and different vaccination strategies. Our framework allows counterfactual analysis by replacing the forecasted values for selected variables with their counterfactual counterparts. The results of our simulations reinforce the risk of prematurely relaxing non-pharmaceutical interventions (NPIs) until the rapid disease spreading is reduced. Similarly, the Japan simulations show that maintaining the State of Emergency while having a high vaccination rate greatly reduces infection rates.

What-if simulations on the percent change of predicted exposed individuals assuming different non-pharmaceutical interventions (NPIs) for the prediction date of March 1, 2021 in Texas, Washington and South Carolina. Increased NPI restrictions are associated with a larger % reduction in the number of exposed people.
What-if simulations on the percent change of predicted exposed individuals assuming different vaccination rates for the prediction date of March 1, 2021 in Texas, Washington and South Carolina. Increased vaccination rate also plays a key role to reduce exposed count in these cases.

Fairness Analysis
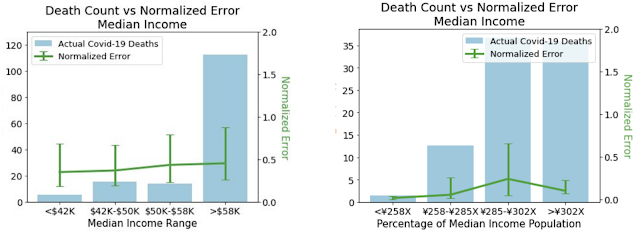
To ensure that our models do not create or reinforce unfairly biased decision making, in alignment with our AI Principles, we performed a fairness analysis separately for forecasts in the US and Japan by quantifying whether the model’s accuracy was worse on protected sub-groups. These categories include age, gender, income, and ethnicity in the US, and age, gender, income, and country of origin in Japan. In all cases, we demonstrated no consistent pattern of errors among these groups once we controlled for the number of COVID-19 deaths and cases that occur in each subgroup.

Normalized errors by median income. The comparison between the two shows that patterns of errors don’t persist once errors are normalized by cases. Left: Normalized errors by median income for the US. Right: Normalized errors by median income for Japan.

Real-World Use Cases
In addition to quantitative analyses to measure the performance of our models, we conducted a structured survey in the US and Japan to understand how organisations were using our model forecasts. In total, seven organisations responded with the following results on the applicability of the model.

  • Organization type: Academia (3), Government (2), Private industry (2)
  • Main user job role: Analyst/Scientist (3), Healthcare professional (1), Statistician (2), Managerial (1)
  • Location: USA (4), Japan (3)
  • Predictions used: Confirmed cases (7), Death (4), Hospitalizations (4), ICU (3), Ventilator (2), Infected (2)
  • Model use case: Resource allocation (2), Business planning (2), scenario planning (1), General understanding of COVID spread (1), Confirm existing forecasts (1)
  • Frequency of use: Daily (1), Weekly (1), Monthly (1)
  • Was the model helpful?: Yes (7)

To share a few examples, in the US, the Harvard Global Health Institute and Brown School of Public Health used the forecasts to help create COVID-19 testing targets that were used by the media to help inform the public. The US Department of Defense used the forecasts to help determine where to allocate resources, and to help take specific events into account. In Japan, the model was used to make business decisions. One large, multi-prefecture company with stores in more than 20 prefectures used the forecasts to better plan their sales forecasting, and to adjust store hours.

Limitations and next steps
Our approach has a few limitations. First, it is limited by available data, and we are only able to release daily forecasts as long as there is reliable, high-quality public data. For instance, public transportation usage could be very useful but that information is not publicly available. Second, there are limitations due to the model capacity of compartmental models as they cannot model very complex dynamics of Covid-19 disease propagation. Third, the distribution of case counts and deaths are very different between the US and Japan. For example, most of Japan’s COVID-19 cases and deaths have been concentrated in a few of its 47 prefectures, with the others experiencing low values. This means that our per-prefecture models, which are trained to perform well across all Japanese prefectures, often have to strike a delicate balance between avoiding overfitting to noise while getting supervision from these relatively COVID-19-free prefectures.

We have updated our models to take into account large changes in disease dynamics, such as the increasing number of vaccinations. We are also expanding to new engagements with city governments, hospitals, and private organizations. We hope that our public releases continue to help public and policy-makers address the challenges of the ongoing pandemic, and we hope that our method will be useful to epidemiologists and public health officials in this and future health crises.

Acknowledgements
This paper was the result of hard work from a variety of teams within Google and collaborators around the globe. We’d especially like to thank our paper co-authors from the School of Medicine at Keio University, Graduate School of Public Health at St Luke’s International University, and Graduate School of Medicine at The University of Tokyo.

Read More

ML Community Day: Save the date

Posted by the TensorFlow team

Please join us for ML Community Day, a virtual developer event on November 9th. You’ll hear from the TensorFlow, JAX, and Deepmind teams and the community, covering new products, updates, and more.

This event takes place on TensorFlow’s sixth birthday (time flies!), and celebrates many years of open-source work by the developer community. We’ll have talks on on-device Machine Learning, JAX, Responsible AI, Cloud TPUs, Machine Learning in production, and sessions from the community.

You’ll also learn how you can get involved with the machine learning community by connecting with Google Developer Experts, joining Special Interest Groups, TensorFlow User Groups, and more.

Later in the day we’ll host the TensorFlow Contributor Summit, in which Google Developer Experts, Special Interest Groups, TensorFlow User Group organizers, and other community leaders gather to connect in a small group to discuss topics such as documentation and how to contribute to the TensorFlow ecosystem. During this event, we will also host the first TensorFlow Awards Ceremony to recognize outstanding community contributions.

You can find more details at the event website. We’ll see you soon!

Read More