Attendee matchmaking at virtual events with Amazon Personalize

Amazon Personalize enables developers to build applications with the same machine learning (ML) technology used by Amazon.com for real-time personalized recommendations—no ML expertise required. Amazon Personalize makes it easy for developers to build applications capable of delivering a wide array of personalization experiences, including specific product recommendations, personalized product re-ranking, and customized direct marketing. Besides applications in retail and ecommerce, other common use cases for Amazon Personalize include recommending videos, blog posts, or newsfeeds based on users’ activity history.

What if you wanted to recommend users of common interest to connect with each other? As the pandemic pushes many of our normal activities virtual, connecting with people is a greater challenge than ever before. This post discusses how 6Connex turned this challenge into an opportunity by harnessing Amazon Personalize to elevate their “user matchmaking” feature.

6Connex and event AI

6Connex is an enterprise virtual venue and hybrid events system. Their cloud-based product portfolio includes virtual environments, learning management, and webinars. Attendee experience is one of the most important metrics for their success.

Attendees have better experiences when they are engaged not only with the event’s content, organizers, and sponsors, but also when making connections with other attendees. Engagement metrics are measured and reported for each attendee activity on the platform, as well as feedback from post-event surveys. The goal is to make the events system more attendee-centric by not only providing personalized content and activity recommendations, but also making matchmaking suggestions for attendees based on similar interests and activity history. By adding event AI features to their platform, 6Connex fosters more meaningful connections between attendees, and keeps their attendees more engaged with a personalized event journey.

Implementation and solution architecture

6Connex built their matchmaking solution using the related items recipe (SIMS) of Amazon Personalize. The SIMS algorithm uses collaborative filtering to recommend items that are similar to a given item. The novelty of 6Connex’s approach lies in the reverse mapping of users and items. In this solution, event attendees are items in Amazon Personalize terms, and content, meeting rooms, and so on are users’ in Amazon Personalize terms.

When a platform user joins a meeting room or views a piece of content, an interaction is created. To increase the accuracy of interaction types, also known as event_type, you can add logic to only count as an interaction when a user stays in a meeting room for at least a certain amount of time. This eliminates accidental clicks and cases when users join but quickly leave a room due to lack of interest.

As many users interact with the platform during a live event, interactions are streamed in real time from the platform via Amazon Kinesis Data Streams. AWS Lambda functions are used for data transformation before streaming data directly to Amazon Personalize through an event tracker. This mechanism also enables Amazon Personalize to adjust to changing user interest over time, allowing recommendations to adapt in real time.

After a model is trained in Amazon Personalize, a fully managed inference endpoint (campaign) is created to serve real-time recommendations for 6Connex’s platform. To answer the question “for each attendee, who are similar attendees?”, 6Connex’s client-side application queries the GetRecommendations API with a current user (represented as an itemId). The API response provides recommended connections because they have been identified as similar by the Amazon Personalize.

Due to its deep learning capabilities, Amazon Personalize requires at least 1,000 interaction data points before training the model. At the start of a live event, there aren’t enough interactions, therefore a rules engine is used at the beginning of an event to provide the initial recommendations prior to gathering 1000 data points. The following table shows the three main phases of an event where connection recommendations are generated.

Rule-based recommendations
  • Event tracker interaction events < 1,000
  • Use rule engine
  • Cache results for 10 minutes
Amazon Personalize real-time recommendations during live sessions
  • Initial data is loaded and model is trained
  • Data is ingested in real-time via Kinesis Data Streams
  • Regular training occurs across the day
  • Recommendation results are cached
Amazon Personalize batch recommendations for on-demand users
  • Main event live sessions are over but the event is still open for a period of time
  • Daily batch recommendations are retrieved and loaded into DynamoDB.

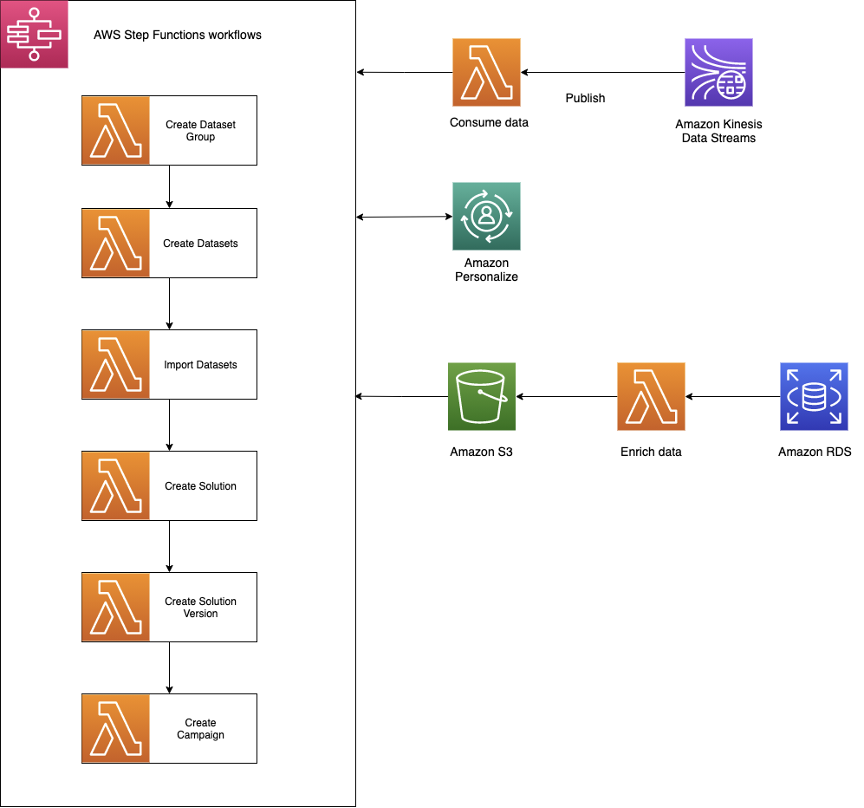
For a high-level example architecture, see the following diagram.

The following are the steps involved in the solution architecture:

  1. 6Connex web application calls the GetRecommendations API to retrieve recommended connections.
  2. A matchmaking Lambda function retrieves recommendations.
  3. Until the training threshold of 1,000 interaction data points is reached, the matchmaking function uses a simple rules engine to provide recommendations.
  4. Recommendations are generated from Amazon Personalize and stored in Amazon ElastiCache. The reason for caching recommendations is to improve response performance while reducing the number of queries on the Amazon Personalize API. When new recommendations are requested, or when the cache expires (expiration is set to every 15 minutes), recommendations are pulled from Amazon Personalize.
  5. New user interactions are ingested in real time via Kinesis Data Streams.
  6. A Lambda function consumes data from the data stream, performs data transformation, persists the transformed data to Amazon Simple Storage Service (Amazon S3) and related metadata to Amazon DynamoDB, and sends the records to Amazon Personalize via the PutEvents API.
  7. AWS Step Functions orchestrates the process for creating solutions, training, retraining, and several other workflows. More details on the Step Functions workflow are in the next section.
  8. Amazon EventBridge schedules regular retraining events during the virtual events. We also use EventBridge to trigger batch recommendations after the virtual events are over and when the contents are served to end users on demand.
  9. Recommendations are stored in DynamoDB for use during the on-demand period and also for future analysis.

Adoption of MLOps

It was crucial for 6Connex to quickly shift from a rules-based recommender engine to personalized recommendations using Amazon Personalize. To accelerate this shift and hydrate the interactions dataset, 6Connex infers interactions not only from content engagement, but also from other sources such as pre-events questionnaires. This is an important development that increased the speed to when users start receiving ML-based recommendations.

More importantly, the adoption of Amazon Personalize MLOps enabled 6Connex to automate and accelerate the transition from rule-based recommendations to personalized recommendations using Amazon Personalize. After the minimum threshold for data is met, Step Functions loads data into Amazon Personalize and manages the training process.

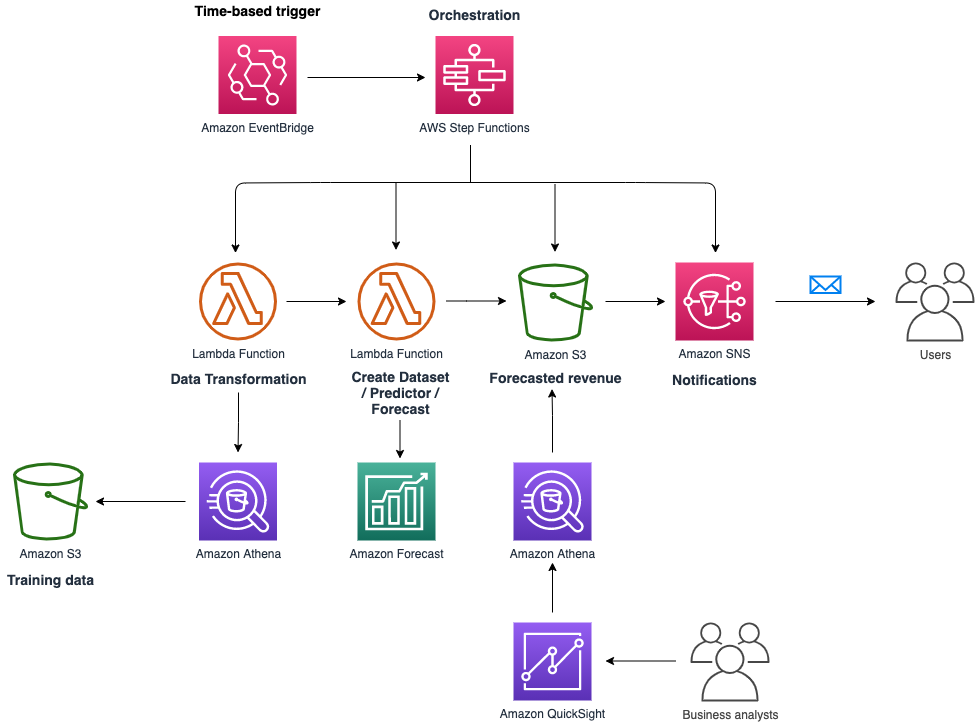
The following diagram shows the MLOps pipeline for the initial loading of data, training solutions, and deploying campaigns.

6Connex created their MLOps solution based on the Amazon Personalize MLOps reference solution to automate this process. There are several Step Functions workflows that offload long-running processes such loading batch recommendations in DynamoDB, retraining Amazon Personalize solutions, and cleaning up after an event is complete.

With Amazon Personalize and MLOps pipelines, 6Connex brought an AI solution to market in less than half the time it would have taken to develop and deploy their own ML infrastructure. Moreover, these solutions reduced the cost of acquiring data science and ML expertise. As a result, 6Connex realized a competitive advantage through AI-based personalized recommendations for each individual user.

Based on the success of this engagement, 6Connex plans to expand its usage of Amazon Personalize to provide content-based recommendations in the near future. 6Connex is looking forward to expanding the partnership not only in ML, but also in data analytics and business intelligence to serve the fast-growing hybrid event market.

Conclusion

With a well-designed MLOps pipeline and some creativity, 6Connex built a robust recommendation engine using Amazon Personalize in a short amount of time.

Do you have a use case for a recommendation engine but are short on time or ML expertise? You can get started with Amazon Personalize using the Developer Guide, as well as a myriad of hands-on resources such as the Amazon Personalize Samples GitHub repo.

If you have any questions on this matchmaking solution, please leave a comment!


About the Author

Shu Jackson is a Senior Solutions Architect with AWS. Shu works with startup customers helping them design and build solutions in the cloud, with a focus on AI/ML.


Luis Lopez Soria is a Sr AI/ML specialist solutions architect working with the Amazon Machine Learning team. He works with AWS customers to help them adopt machine learning on a large scale. He enjoys playing sports, traveling around the world, and exploring new foods and cultures.

Read More

Accurately predicting future sales at Clearly using Amazon Forecast

This post was cowritten by Ziv Pollak, Machine Learning Team Lead, and Alex Thoreux, Web Analyst at Clearly.

A pioneer in online shopping, Clearly launched their first site in 2000. Since then, they’ve grown to become one of the biggest online eyewear retailers in the world, providing customers across Canada, the US, Australia and New Zealand with glasses, sunglasses, contact lenses, and other eye health products. Through their Mission to eliminate poor vision, Clearly strives to make eyewear affordable and accessible for everyone. Creating an optimized platform is a key part of this wider vision.

Predicting future sales is one of the biggest challenges every retail organization has – but it’s also one of the most important pieces of insight. Having a clear and reliable picture of predicted sales for the next day or week allows your company to adjust its strategy and increase the chances of meeting its sales and revenue goals.

We’ll talk about how Clearly built an automated and orchestrated forecasting pipeline using AWS Step Functions, and used Amazon Forecast APIs to train a machine learning (ML) model and predict sales on a daily basis for the upcoming weeks and months.

With a solution that also collects metrics and logs, provides auditing, and is invoked automatically, Clearly was able to create a serverless, well-architected solution in just a few weeks.

The challenge: Detailed sales forecasting

With a reliable sales forecast, we can improve our marketing strategy, decision-making process, and spend, to ensure successful operations of the business.

In addition, when a diversion between the predicted sales numbers and the actual sales number occurs, it’s a clear indicator that something is wrong, such as an issue with the website or promotions that may not be working properly. From there, we can problem solve the issues and address them in a timely manner.

For forecasting sales, our existing solution was based on senior members of the marketing team building manual predictions. Historical data was loaded into an Excel sheet and predictions were made using basic forecasting functionality and macros. These manual predictions were nearly 90% accurate and took 4–8 hours to complete, which was a good starting point, but still not accurate enough to confidently guide the marketing team’s next steps.

In addition, testing “what-if” future scenarios was difficult to implement because we could only perform the predictions for the following months, without further granularity such as weeks and days.

Having a detailed sales forecast allows us to identify situations where money is being lost due to outages or other technical or business issues. With a reliable and accurate forecast, when we see that actual sales aren’t meeting expected sales, we know there is an issue.

Another major challenge we faced was the lack of a tenured ML team – all members had been with the company less than a year when the project kicked off.

Overview of solution: Forecast

Amazon Forecast is a fully managed service that uses ML to deliver highly accurate forecasts. After we provided the data, Forecast automatically examined it, identified what was meaningful, and produced a forecasting model capable of making predictions on our different lines of products and geographical locations to deliver the most accurate daily forecasts. The following diagram illustrates our forecasting pipeline.

To operationalize the flow, we applied the following workflow:

  1. Amazon EventBridge calls the orchestration pipeline daily to retrieve the predictions.
  2. Step Functions help manage the orchestration pipeline.
  3. An AWS Lambda function calls Amazon Athena APIs to retrieve and prepare the training data, stored on Amazon Simple Storage Service (Amazon S3).
  4. An orchestrated pipeline of Lambda functions uses Forecast to create the datasets, train the predictors, and generate the forecasted revenue. The forecasted data is saved in an S3 bucket.
  5. Amazon Simple Notification Service (Amazon SNS) notifies users when a problem occurs during the forecasting process or when the process completes successfully.
  6. Business analysts build dashboards on Amazon QuickSight, which queries the forecast data from Amazon S3 using Athena.

We chose to work with Forecast for a few reasons:

  • Forecast is based on the same technology used at Amazon.com, so we have a lot of confidence in the tool’s capabilities.
  • The ease of use and implementation allowed us to quickly confirm we have the needed dataset to produce accurate results.
  • Because the Clearly ML team was less than 1 year old, a fully managed service allowed us to deliver this project without needing deep technical ML skills and knowledge.

Data sources

Finding the data to use for this forecast, while making sure it was clear and reliable, was the most important element in our ability to generate accurate predictions. We ended up using the following datasets, training the model on 3 years of daily data:

  • Web traffic.
  • Number of orders.
  • Average order value.
  • Conversion rate.
  • New customer revenue.
  • Marketing spend.
  • Marketing return on advertisement spend.
  • Promotions.

To create the dataset, we went through many iterations, changing the number of data sources until the predictions reach our benchmark of at least 95% accuracy.

Dashboard and results

Writing the prediction results into our existing data lake allows us to use QuickSight to build metrics and dashboards for the senior-level managers. This enables them to understand and use these results when making decisions on the next steps needed to meet our monthly marketing targets.

We were able to present the forecast results on two levels, starting with overall business performance and then going deeper into performance per each line of business (contacts and glasses). For those three cases (overall, contacts, glasses) we presented the following information:

  • Predicted revenue vs. target – This allows the marketing team to understand how we’re expected to perform this month, compared to our target, if they take no additional actions. For example, if we see that the projected sales don’t meet our marketing goals, we need to launch a new marketing campaign. The following screenshot shows an example analysis with a value of -17.47%, representing the expected total monthly revenue vs. the target.
  • Revenue performance compared to predictions over the last month – This graph shows that the predicted revenue is within the forecasted range, which means that the predictions are accurate. The following example graph shows high bound, revenue, and low bound values.
  • Month to date revenue compared to weekly and monthly forecasts – The following example screenshot shows text automatically generated by QuickSight that indicates revenue-related KPIs.

Thanks to Forecast, Clearly now has an automated pipeline that generates forecasts for daily and weekly scenarios, reaching or surpassing our benchmarks of 97%, which is an increase of 7.78% from a process that was done manually and was limited to longer periods.

Now, daily forecasts for weekly and monthly revenue take only 15 minutes in data gathering and preparation, with the forecasting process taking close to 15 minutes to complete on a daily basis. This is a huge improvement from 4-8 hours with the manual process, which could only perform predictions for the whole month.

With more granularity and better accuracy, our marketing team has better tools to act faster on discrepancies and create prediction scenarios on campaigns could achieve better revenue results.

Conclusion

Effective and accurate prediction of customer future behavior is one of the biggest challenges in ML in retail today, and having a good understanding of our customers and their behavior is vital for business success. Forecast provided a fully managed ML solution to easily create an accurate and reliable prediction with minimal overhead. The biggest benefit we get with these predictions is that we have accurate visibility of what the future will look like and can change it if it doesn’t meet our targets.

In addition, Forecast allows us to predict what-if scenarios and their impact on revenue. For example, we can project the overall revenue until the end of the month, and with some data manipulation we can also predict what will happen if we launch a BOGO (buy one, get one free) campaign next Tuesday.

“With leading ecommerce tools like Virtual Try On, combined with our unparalleled customer service, we strive to help everyone see clearly in an affordable and effortless manner—which means constantly looking for ways to innovate, improve, and streamline processes. Effective and accurate prediction of customer future behavior is one of the biggest challenges in machine learning in retail today. In just a few weeks, Amazon Forecast helped us accurately and reliably forecast sales for the upcoming week with over 97% accuracy, and with over 90% accuracy when predicting sales for the following month.”

– Dr. Ziv Pollak, Machine Learning Team Leader.

For more information about how to get started building your own MLOps pipelines with Forecast, see Building AI-powered forecasting automation with Amazon Forecast by applying MLOps, and for other use cases, visit the AWS Machine Leaning Blog.

The content and opinions in this post are those of the third-party author and AWS is not responsible for the content or accuracy of this post.


About the Author

Dr Ziv Pollak Dr Ziv Pollak is an experienced technical leader who transforms the way organizations use machine learning to increase revenue, reduce costs, improve customer service, and ensure business success. He is currently leading the Machine Learning team at Clearly.


Alex Thoreux Alex Thoreux is a Jr Web Analyst at Clearly who built the forecasting pipeline, as well as other ML applications for Clearly.


Fernando Rocha

Fernando Rocha is a Specialist SA. As Clearly’s Solutions Architect, he helps them build analytics and machine learning solutions on AWS.

Read More

Announcing model improvements and lower annotation limits for Amazon Comprehend custom entity recognition

Amazon Comprehend is a natural language processing (NLP) service that provides APIs to extract key phrases, contextual entities, events, sentiment from unstructured text, and more. Entities refer to things in your document such as people, places, organizations, credit card numbers, and so on. But what if you want to add entity types unique to your business, like proprietary part codes or industry-specific terms? Custom entity recognition (CER) in Amazon Comprehend enables you to train models with entities that are unique to your business in just a few easy steps. You can identify almost any kind of entity, simply by providing a sufficient number of details to train your model effectively.

Training an entity recognizer from the ground up requires extensive knowledge of machine learning (ML) and a complex process for model optimization. Amazon Comprehend makes this easy for you using a technique called transfer learning to help build your custom model. Internally, Amazon Comprehend uses base models that have been trained on data collected by Amazon Comprehend and optimized for the purposes of entity recognition. With this in place, all you need to supply is the data. ML model accuracy is typically dependent on both the volume and quality of data. Getting good quality annotation data is a laborious process.

Until today, you could train an Amazon Comprehend custom entity recognizer with only 1,000 documents and 200 annotations per entity. Today, we’re announcing that we have improved underlying models for the Amazon Comprehend custom entity API by reducing the minimum requirements to train the model. Now, with as few as 250 documents and 100 annotations per entity (also referred to as shots), you can train Amazon Comprehend CER models to predict entities with greater accuracy. To take advantage of the updated performance offered by the new CER model framework, you can simply retrain and deploy improved models.

To illustrate the model improvements, we compare the result of previous models with that of the new release. We selected a diverse set of entity recognition datasets across different domains and languages from the open-source domain to showcase the model improvements. In this post, we walk you through the results from our training and inference process between the previous CER model version and the new CER model.

Datasets

When you train an Amazon Comprehend CER model, you provide the entities that you want the custom model to recognize, and the documents with text containing these entities. You can train Amazon Comprehend CER models using entity lists or annotations. Entity lists are CSV files that contain the text (a word or words) of an entity example from the training document along with a label, which is the entity type that the text is categorized as. With annotations, you can provide the positional offset of entities in a sentence along with the entity type being represented. When you use the entire sentence, you’re providing the contextual reference for the entities, which increases the accuracy of the model you’re training.

We selected the annotations option for labeling our entities because the datasets we selected already contained the annotations for each of the entity types represented. In this section, we discuss the datasets we selected and what they describe.

CoNLL

The Conference on Computational Natural Language Learning (CoNLL) provides datasets for language-independent (doesn’t use language-specific resources for performing the task) named entity recognition with entities provided in English, Spanish, and German. Four types of named entities are provided in the dataset: persons, locations, organizations, and names of miscellaneous entities that don’t belong to the previous three types.

We used the CoNLL-2003 dataset for English, and the CoNLL-2002 dataset for Spanish languages for our entity recognition training. We ran some basic transformations to convert the annotations data to a format that is required by Amazon Comprehend CER. We converted the entity types from their semantic notation to actual words they represent, such as person, organization, location, and miscellaneous.

SNIPS

The SNIPS dataset was created in 2017 as part of benchmarking tests for natural language understanding (NLU) by Snips. The results from these tests are available in the 2018 paper “Snips Voice Platform: an embedded Spoken Language Understanding system for private-by-design voice interfaces” by Coucke, et al. We used the GetWeather and the AddToPlaylist datasets for our experiments. The entities for the GetWeather dataset we considered are timerange, city, state, condition_description, country, and condition_temperature. For AddToPlaylist, we considered the entities artist, playlist_owner, playlist, music_item, and entity_name.

Sampling configuration

The following table represents the dataset configuration for our tests. Each row represents an Amazon Comprehend CER model that was trained, deployed, and used for entity prediction with our test dataset.

Dataset Published year Language Number of documents sampled for training Number of entities sampled Number of annotations per entity (shots) Number of documents sampled for blind test inference (never seen during training)
SNIPS-AddToPlaylist 2017 English 254 5 artist – 101
playlist_owner – 148
playlist – 254
music_item – 100
entity_name – 100
100
SNIPS-GetWeather 2017 English 600 6 timeRange – 281
city – 211
state – 111
condition_description – 121
country – 117
condition_temperature – 115
200
SNIPS-GetWeather 2017 English 1000 6 timeRange -544
city – 428
state -248
condition_description -241
country -230
condition_temperature – 228
200
SNIPS-GetWeather 2017 English 2000 6 timeRange -939
city -770
state – 436
condition_description – 401
country – 451
condition_temperature – 431
200
CoNLL 2003 English 350 3 Location – 183
Organization – 111
Person – 229
200
CoNLL 2003 English 600 3 Location – 384
Organization – 210
Person – 422
200
CoNLL 2003 English 1000 4 Location – 581
Miscellaneous – 185
Organization – 375
Person – 658
200
CoNLL 2003 English 2000 4 Location – 1133
Miscellaneous – 499
Organization – 696
Person – 1131
200
CoNLL 2002 Spanish 380 4 Location – 208
Miscellaneous – 103
Organization – 404
Person – 207
200
CoNLL 2002 Spanish 600 4 Location – 433
Miscellaneous – 220
Organization – 746
Person – 436
200
CoNLL 2002 Spanish 1000 4 Location – 578
Miscellaneous – 266
Organization – 929
Person – 538
200
CoNLL 2002 Spanish 2000 4 Location – 1184
Miscellaneous – 490
Organization – 1726
Person – 945
200

For more details on how to format data to create annotations and entity lists for Amazon Comprehend CER, see Training Custom Entity Recognizers. We created a benchmarking approach based on the sampling configuration for our tests, and we discuss the results in the following sections.

Benchmarking process

As shown in the sampling configuration in the preceding section, we trained a total of 12 models, with four models each for CoNLL English and Spanish datasets with varying document and annotation configurations, three models for the SNIPS-GetWeather dataset, again with varying document and annotation configurations, and one model with the SNIPS-AddToPlaylist dataset, primarily to test the new minimums of 250 documents and 100 annotations per entity.

Two inputs are required to train an Amazon CER model: entity representations and the documents containing these entities. For an example of how to train your own CER model, refer to Setting up human review of your NLP-based entity recognition models with Amazon SageMaker Ground Truth, Amazon Comprehend, and Amazon A2I. We measure the accuracy of our models using metrics such as F1 score, precision, and recall for the test set at training and the blind test set at inference. We run subsequent inference on these models using a blind test dataset of documents that we set aside from our original datasets.

Precision indicates how many times the model makes a correct entity identification compared to the number of attempted identifications. Recall indicates how many times the model makes a correct entity identification compared to the number of instances of that the entity is actually present, as defined by the total number of correct identifications (true positives) and missed identifications (false negatives). F1 score indicates a combination of the precision and recall metrics, which measures the overall accuracy of the model for custom entity recognition. To learn more about these metrics, refer to Custom Entity Recognizer Metrics.

Amazon Comprehend CER provides support for both real-time endpoints and batch inference requirements. We used the asynchronous batch inference API for our experiments. Finally, we calculated the F1 score, precision, and recall for the inference by comparing what the model predicted with what was originally annotated for the test documents. The metrics are calculated by doing a strict match for the span offsets, and a partial match isn’t considered nor given partial credit.

Results

The following tables document the results from our experiments we ran using the sampling configuration and the benchmarking process we explained previously.

Previous limits vs. new limits

The limits have reduced from 1,000 documents and 200 annotations per entity for CER training in the previous model to 250 documents and 100 annotations per entity in the improved model.

The following table shows the absolute improvement in F1 scores measured at training, between the old and new models. The new model improves the accuracy of your entity recognition models even when you have a lower count of training documents.

Model Previous F1 during training New F1 during training F1 point gains
CoNLL-2003-EN-600 85 96.2 11.2
CoNLL-2003-EN-1000 80.8 91.5 10.7
CoNLL-2003-EN-2000 92.2 94.1 1.9
CoNLL-2003-ES-600 81.3 86.5 5.2
CoNLL-2003-ES-1000 85.3 92.7 7.4
CoNLL-2003-ES-2000 86.1 87.2 1.1
SNIPS-Weather-600 74.7 92.1 17.4
SNIPS-Weather-1000 93.1 94.8 1.7
SNIPS-Weather-2000 92.1 95.9 3.8

Next, we report the evaluation on a blind test set that was split before the training process from the dataset.

Previous model with at least 200 annotations New (improved) model with approximately 100 annotations
Dataset Number of entities F1 Blind test set F1 F1 Blind test set F1 F1 point gains on blind test set
CoNLL-2003 – English 3 84.9 79.4 90.2 87.9 8.5
CoNLL-2003 – Spanish 4 85.8 76.3 90.4 81.8 5.5
SNIPS-Weather 6 74.74 80.64 92.14 93.6 12.96

Overall, we observe an improvement in F1 scores with the new model even with half the number of annotations provided, as seen in the preceding table.

Continued improvement with more data

In addition to the improved F1 scores at lower limits, we noticed a trend where the new model’s accuracy measured with the blind test dataset continued to improve as we trained with increased annotations. For this test, we considered the SNIPS GetWeather and AddToPlaylist datasets.

The following graph shows a distribution of absolute blind test F1 scores for models trained with different datasets and annotation counts.

We generated the following metrics during training and inference for the SNIPS-AddToPlaylist model trained with 250 documents in the new Amazon Comprehend CER model.

SNIPS-AddToPlaylist metrics at training time

SNIPS-AddToPlaylist inference metrics with blind test dataset

Conclusion

In our experiments with the model improvements in Amazon Comprehend CER, we observe accuracy improvements with fewer annotations and lower document volumes. Now, we consistently see increased accuracy across multiple datasets even with half the number of data samples. We continue to see improvements to the F1 score as we trained models with different dataset sampling configurations, including multi-lingual models. With this updated model, Amazon Comprehend makes it easy to train custom entity recognition models. Limits have been lowered to 100 annotations per entity and 250 documents for training while offering improved accuracy with your models. You can start training custom entity models on the Amazon Comprehend console or through the API.


About the Authors

Prem Ranga is an Enterprise Solutions Architect based out of Houston, Texas. He is part of the Machine Learning Technical Field Community and loves working with customers on their ML and AI journey. Prem is passionate about robotics, is an Autonomous Vehicles researcher, and also built the Alexa-controlled Beer Pours in Houston and other locations.


Chethan Krishna is a Senior Partner Solutions Architect in India. He works with Strategic AWS Partners for establishing a robust cloud competency, adopting AWS best practices and solving customer challenges. He is a builder and enjoys experimenting with AI/ML, IoT and Analytics.


Mona Mona is an AI/ML Specialist Solutions Architect based out of Arlington, VA. She helps customers adopt machine learning on a large scale. She is passionate about NLP and ML Explainability areas in AI/ML.


Read More

A Dataset Exploration Case Study with Know Your Data

Posted by Mark Díaz and Emily Denton, Research Scientists, Google Research, Ethical AI Team

Data underlies much of machine learning (ML) research and development, helping to structure what a machine learning algorithm learns and how models are evaluated and benchmarked. However, data collection and labeling can be complicated by unconscious biases, data access limitations and privacy concerns, among other challenges. As a result, machine learning datasets can reflect unfair social biases along dimensions of race, gender, age, and more.

Methods of examining datasets that can surface information about how different social groups are represented within are a key component of ensuring development of ML models and datasets is aligned with our AI Principles. Such methods can inform the responsible use of ML datasets and point toward potential mitigations of unfair outcomes. For example, prior research has demonstrated that some object recognition datasets are biased toward images sourced from North America and Western Europe, prompting Google’s Crowdsource effort to balance out image representations in other parts of the world.

Today, we demonstrate some of the functionality of a dataset exploration tool, Know Your Data (KYD), recently introduced at Google I/O, using the COCO Captions dataset as a case study. Using this tool, we find a range of gender and age biases in COCO Captions — biases that can be traced to both dataset collection and annotation practices. KYD is a dataset analysis tool that complements the growing suite of responsible AI tools being developed across Google and the broader research community. Currently, KYD only supports analysis of a small set of image datasets, but we’re working hard to make the tool accessible beyond this set.

Introducing Know Your Data
Know Your Data helps ML research, product and compliance teams understand datasets, with the goal of improving data quality, and thus helping to mitigate fairness and bias issues. KYD offers a range of features that allow users to explore and examine machine learning datasets — users can filter, group, and study correlations based on annotations already present in a given dataset. KYD also presents automatically computed labels from Google’s Cloud Vision API, providing users with a simple way to explore their data based on signals that weren’t originally present in the dataset.

A KYD Case Study
As a case study, we explore some of these features using the COCO Captions dataset, an image dataset that contains five human-generated captions for each of over 300k images. Given the rich annotations provided by free-form text, we focus our analysis on signals already present within the dataset.

Exploring Gender Bias
Previous research has demonstrated undesirable gender biases within computer vision datasets, including pornographic imagery of women and image label correlations that align with harmful gender stereotypes. We use KYD to explore gender biases within COCO Captions by examining gendered correlations within the image captions. We find a gender bias in the depiction of different activities across the images in the dataset, as well as biases relating to how people of different genders are described by annotators.

The first part of our analysis aimed to surface gender biases with respect to different activities depicted in the dataset. We examined images captioned with words describing different activities and analyzed their relation to gendered caption words, such as “man” or “woman”. The KYD Relations tab makes it easy to examine the relation between two different signals in a dataset by visualizing the extent to which two signals co-occur more (or less) than would be expected by chance. Each cell indicates either a positive (blue color) or negative (orange color) correlation between two specific signal values along with the strength of that correlation.

KYD also allows users to filter rows of a relations table based on substring matching. Using this functionality, we initially probed for caption words containing “-ing”, as a simple way to filter by verbs. We immediately saw strong gendered correlations:

Using KYD to analyze the relationship between any word and gendered words. Each cell shows if the two respective words co-occur in the same caption more (up arrow) or less often (down arrow) than pure chance.

Digging further into these correlations, we found that several activities stereotypically associated with women, such as “shopping” and “cooking”, co-occur with images captioned with “women” or “woman” at a higher rate than with images captioned with “men” or “man”. In contrast captions describing many physically intensive activities, such as “skateboarding”, “surfing”, and “snowboarding”, co-occur with images captioned with “man” or “men” at higher rates.

While individual image captions may not use stereotypical or derogatory language, such as with the example below, if certain gender groups are over (or under) represented within a particular activity across the whole dataset, models developed from the dataset risk learning stereotypical associations. KYD makes it easy to surface, quantify, and make plans to mitigate this risk.

An image with one of the captions: “Two women cooking in a beige and white kitchen.” Image licensed under CC-BY 2.0.

In addition to examining biases with respect to the social groups depicted with different activities, we also explored biases in how annotators described the appearance of people they perceived as male or female. Inspired by media scholars who have examined the “male gaze” embedded in other forms of visual media, we examined the frequency with which individuals perceived as women in COCO are described using adjectives that position them as an object of desire. KYD allowed us to easily examine co-occurrences between words associated with binary gender (e.g. “female/girl/woman” vs. “male/man/boy”) and words associated with evaluating physical attractiveness. Importantly, these are captions written by human annotators, who are making subjective assessments about the gender of people in the image and choosing a descriptor for attractiveness. We see that the words “attractive”, “beautiful”, “pretty”, and “sexy” are overrepresented in describing people perceived as women as compared to those perceived as men, confirming what prior work has said about how gender is viewed in visual media.

A screenshot from KYD showing the relationship between words that describe attractiveness and gendered words. For example, “attractive” and “male/man/boy” co-occur 12 times, but we expect ~60 times by chance (the ratio is 0.2x). On the other hand, “attractive” and “female/woman/girl” co-occur 2.62 times more than chance.

KYD also allows us to manually inspect images for each relation by clicking on the relation in question. For example, we can see images whose captions include female terms (e.g. “woman”) and the word “beautiful”.

Exploring Age Bias
Adults older than 65 have been shown to be underrepresented in datasets relative to their presence in the general population — a first step toward improving age representation is to allow developers to assess it in their datasets. By looking at caption words describing different activities and analyzing their relation to caption words describing age, KYD helped us to assess the range of example captions depicting older adults. Having example captions of adults in a range of environments and activities is important for a variety of tasks, such as image captioning or pedestrian detection.

The first trend that KYD made clear is how rarely annotators described people as older adults in captions detailing different activities. The relations tab also shows a trend wherein “elderly”, “old”, and “older” tend not to occur with verbs that describe a variety of physical activities that might be important for a system to be able to detect. Important to note is that, relative to “young”, “old” is more often used to describe things other than people, such as belongings or clothing, so these relations are also capturing some uses that don’t describe people.

The relationship between words associated with age and movement from a screenshot of KYD.

The underrepresentation of captions containing the references to older adults that we examined here could be rooted in a relative lack of images depicting older adults as well as in a tendency for annotators to omit older age-related terms when describing people in images. While manual inspection of the intersection of “old” and “running” shows a negative relation, we notice that it shows no older people and a number of locomotives. KYD makes it easy to quantitatively and qualitatively inspect relations to identify dataset strengths and areas for improvement.

Conclusion
Understanding the contents of ML datasets is a critical first step to developing suitable strategies to mitigate the downstream impact of unfair dataset bias. The above analysis points towards several potential mitigations. For example, correlations between certain activities and social groups, which can lead trained models to reproduce social stereotypes, can be potentially mitigated by “dataset balancing” — increasing the representation of under-represented group/activity combinations. However, mitigations focused exclusively on dataset balancing are not sufficient, as our analysis of how different genders are described by annotators demonstrated. We found annotators’ subjective judgements of people portrayed in images were reflected within the final dataset, suggesting a deeper look at methods of image annotations are needed. One solution for data practitioners who are developing image captioning datasets is to consider integrating guidelines that have been developed for writing image descriptions that are sensitive to race, gender, and other identity categories.

The above case studies highlight only some of the KYD features. For example, Cloud Vision API signals are also integrated into KYD and can be used to infer signals that annotators haven’t labeled directly. We encourage the broader ML community to perform their own KYD case studies and share their findings.

KYD complements other dataset analysis tools being developed across the ML community, including Google’s growing Responsible AI toolkit. We look forward to ML practitioners using KYD to better understand their datasets and mitigate potential bias and fairness concerns. If you have feedback on KYD, please write to knowyourdata-feedback@google.com.

Acknowledgements
The analysis and write-up in this post were conducted with equal contribution by Emily Denton, Mark Díaz, and Alex Hanna. We thank Marie Pellat, Ludovic Peran, Daniel Smilkov, Nikhil Thorat and Tsung-Yi for their contributions to and reviews of this post.

Read More

On the Air: Creative Technology Elevates Broadcast Workflows for International Sporting Event with NVIDIA Networking

Talk about a signal boost. Creative Technology is tackling 4K and 8K signals, as well as new broadcast workflows, with the latest NVIDIA networking technologies.

The London-based firm is one of the world’s leading suppliers of audio visual equipment for broadcasting and online events. Part of global production company NEP Group, CT helps produce high-quality virtual and live events by providing advanced technologies and equipment, from large-screen displays to content delivery systems.

Before the COVID-19 pandemic hit, CT was looking to enhance the broadcast experience, bringing audiences and content closer together. Already in the process of switching from a baseband software-defined infrastructure (SDI) architecture to more advanced internet protocol (IP)-based technologies, CT was prepared when the pandemic led to an increased demand in virtual events.

The company decided to invest in KAIROS, Panasonic’s next-generation IT and IP video processing platform. KAIROS is a software-based, open architecture platform that uses CPU and GPU processing to significantly improve broadcast performance.

CT opted for NVIDIA GPUs to power KAIROS, which uses NVIDIA Rivermax IP streaming acceleration to enable direct data transfers to and from the GPU, leading to enhanced flexibility and increased performance for virtual events.

With plans to use KAIROS for the world’s most recognized sporting event this month, CT is using IP enabled by NVIDIA switches and NVIDIA RTX GPUs. This technology allows CT to easily scale up for larger shows and save time in setting up new productions, while transforming broadcast workflows.

Taking Broadcast Beyond the Standard

With LED screens increasing in resolution, it’s now more common for companies to deal with 4K and 8K signals. CT wanted a powerful solution that could keep up, while also providing better scalability and flexibility to enhance workflows.

When CT first started testing KAIROS, they were discussing using the platform to accommodate a 3G-SDI workflow, which supports the move from 1080/50 interlaced video formats (1080i) to 1080/50 progressive video formats (1080p).

In interlaced scanning, the frame is divided into odd and even lines — only half the frame is shown on screen, and the other half appears in 1/60th of a second. The lines switch so quickly that viewers will see the entire frame, but they may also see flickers on screen.

In progressive scans, the entire frame is transmitted simultaneously. All the lines in the frame are shown at once to fill the screen, which reduces flicker. Progressive scans are ideal for digital transmissions and have become the standard for high-definition TV displays.

But CT also needed to ensure its technology could keep up with any future video workflow advances demanded by clients.

The company has its own servers built on NVIDIA RTX GPUs with ConnectX-6 DX cards, and KAIROS delivers high performance by using the power and flexibility of the GPUs. The CT team no longer has to deal with the painful process of converting 4K and 8K signals to SDI. Instead, it can pass the signals to KAIROS, which can distribute video feeds to projectors or screens regardless of the resolution or format.

“Essentially, what KAIROS did was give us a lot more flexibility,” said Sid Lobb, head of Vision and Integrated Networks at Creative Technology. “There is utter flexibility with what we can use and how we allocate the power that the NVIDIA RTX GPUs provide.”

Switching It Up 

Transitioning from SDI to IP allowed CT to use software for driving all the events. With IP, CT can use a switch instead of cables to connect systems.

“Now, it’s more like connecting computers to each other versus directly connecting cameras to a processor,” said Lobb. “We’re able to use a network to connect the entire production signal path. It’s a whole change to broadcast workflows.”

The latest version of KAIROS enables CT to use the network as a matrix switcher, which allows the team to easily switch from one video or audio source to another. For example, in events that take place in a sports arena, there could be up to 100 PCs capturing and producing different content. During the event, CT could be switching from one PC to another, which would’ve been challenging with traditional architectures. But with IP, CT can easily switch among sources, and also scale up and down to different size shows using the same solution.

The team is also experiencing massive time savings when it comes to getting new productions up and running, as the programming of KAIROS is intuitive and efficient. Each virtual event is different, but KAIROS makes it easy for CT to configure input and outputs based on their productions.

The team will use GPU-powered solutions to enhance the experience for future broadcasting and live events.

The post On the Air: Creative Technology Elevates Broadcast Workflows for International Sporting Event with NVIDIA Networking appeared first on The Official NVIDIA Blog.

Read More

NVIDIA-Certified Systems Land on the Desktop

Enterprises challenged with running accelerated workloads have an answer: NVIDIA-Certified Systems. Available from nearly 20 global computer makers, these servers have been validated for running a diverse range of accelerated workloads with optimum performance, reliability and scale.

Now NVIDIA-Certified Systems are expanding to the desktop with workstations that undergo the same testing to validate their ability to run GPU-accelerated applications well.

Certification ensures that these systems, available as desktop or laptop models, have a well-balanced design and the correct configurations to maximize performance. GPUs eligible for certification in the workstations include the newest NVIDIA RTX A6000, A5000 and A4000, as well as the RTX 8000 and 6000.

NVIDIA-Certified workstations will join a lineup of over 90 already available systems that range from the highest performance AI servers with the NVIDIA HGX A100 8-GPU, to enterprise-class servers with the NVIDIA A30 Tensor Core GPU for mainstream accelerated data centers, to low-profile, low-power systems designed for the edge with NVIDIA T4 GPUs.

Certified Systems to Accelerate Data Science on CDP

Cloudera Data Platform (CDP) v7.1.6, which went into general availability last week, now takes advantage of NVIDIA-Certified Systems. This latest version adds RAPIDS to accelerate data analytics, ETL and popular data science tools like Apache Spark with NVIDIA GPUs to churn through massive data operations.

Testing has shown that this version of CDP runs up to 10x faster on servers with NVIDIA GPUs vs. non-accelerated servers. To make it easy to get started, NVIDIA and Cloudera recommend two NVIDIA-Certified server configurations that customers can purchase from several vendors:

  • CDP-Ready: For running Apache Spark, a CDP-Ready configuration of NVIDIA-Certified servers with two NVIDIA A30 GPUs per server offers over 5x the performance at less than 50 percent incremental cost relative to modern CPU-only alternatives.
  • AI ready: For customers additionally running machine learning or other AI-related applications, the NVIDIA A100 GPU provides even more performance — as well as acceleration on machine learning and AI training.

Data scientists often develop and refine machine learning and deep learning models on workstations to augment data center resources or help minimize cloud-based compute costs. By using an NVIDIA-Certified workstation, they can transition their work to NVIDIA-Certified servers when it’s time for larger scale prototyping and eventually production, without having to port to a different tool or framework.

New White Paper Describes Value of Certification

When it comes to installing GPUs and SmartNICs in a system, choosing the right server or workstation model and correctly configuring the components and firmware are critical to getting the most out of the investment.

With NVIDIA-Certified Systems, NVIDIA and its partners have already done the work of validating that a particular system is capable of running accelerated workloads well, and they’ve figured out the most optimal hardware configuration.

Misconfiguration can lead to poor performance and even inability to function properly or complete tasks. The certification process ensures that issues such as these are surfaced and resolved for each tested system. We’ve described this and more in a new white paper, Accelerate Compute-Intensive Workloads with NVIDIA-Certified Systems.

Our system partners run a suite of more than 25 tests designed by NVIDIA based on our vast experience with compute, graphics and network acceleration. Each of the tests is chosen to exercise the hardware of the system in a unique and thorough manner, so as many potential configuration issues as possible can be exposed. Some of the tests focus on a single aspect of the hardware, while others stress multiple components, both simultaneously as well as in a multi-step workflow.

With NVIDIA-Certified Systems, enterprises can confidently choose performance-optimized hardware to power their accelerated computing workloads — from the desktop to the data center to the edge.

Learn more about NVIDIA-Certified Systems:

The post NVIDIA-Certified Systems Land on the Desktop appeared first on The Official NVIDIA Blog.

Read More

Leading Lights: NVIDIA Researchers Showcase Groundbreaking Advancements for Real-Time Graphics

Computer graphics and AI are cornerstones of NVIDIA. Combined, they’re bringing creators closer to the goal of cinema-quality 3D imagery rendered in real time.

At a series of graphics conferences this summer, NVIDIA Research is sharing groundbreaking work in real-time path tracing and content creation, much of it based on cutting-edge AI techniques. These projects are tackling the hardest unsolved problems in graphics with new tools that advance the state of the art in real-time rendering.

One goal is improving the realism of rendered light as it passes through complex materials like fur or fog. Another is helping artists more easily turn their creative visions into lifelike models and scenes.

Presented at this week’s SIGGRAPH 2021 — as well as the recent High-Performance Graphics conference and the Eurographics Symposium on Rendering — these research advancements highlight how NVIDIA RTX GPUs make it possible to further the frontiers of photorealistic real-time graphics.

Rendering photorealistic images in real time requires accurate simulation of light, modeling the same laws that govern light in the physical world. The most effective approach known so far, path tracing, requires massive computational resources but can deliver spectacular imagery.

The NVIDIA RTX platform, with dedicated ray-tracing hardware and high-performance Tensor Cores for efficient evaluation of AI models, is tailor made for this task. Yet there are still situations where creating high-fidelity rendered images remains challenging.

Consider, for one, a tiger prowling through the woods.

Seeing the Light: Real-Time Path Tracing

To make a scene completely realistic, creators must render complex lighting effects such as reflections, shadows and visible haze.

In a forest scene, dappled sunlight filters through the leaves on the trees and grows hazy among the water molecules suspended in the foggy air. Rendering realistic real-time imagery of clouds, dusty surfaces or mist like this was once out of reach. But NVIDIA researchers have developed techniques that often compute the visual effect of these phenomena 10x more efficiently.

The tiger itself is both illuminated by sunlight and shadowed by trees. As it strides through the woods, its reflection is visible in the pond below. Lighting these kinds of rich visuals with both direct and indirect reflections can require calculating thousands of paths for every pixel in the scene.

It’s a task far too resource-hungry to solve in real time. So our research team created a path-sampling algorithm that prioritizes the light paths and reflections most likely to contribute to the final image, rendering images over 100x more quickly than before.

AI of the Tiger: Neural Radiance Caching

Another group of NVIDIA researchers achieved a breakthrough in global illumination with a new technique named neural radiance caching. This method uses both NVIDIA RT Cores for ray tracing and Tensor Cores for AI acceleration to train a tiny neural network live while rendering a dynamic scene.

The neural network learns how light is distributed throughout the scene. It evaluates over a billion global illumination queries per second when running on an NVIDIA GeForce RTX 3090 GPU, depicting the tiger’s dense fur with rich lighting detail previously unattainable at interactive frame rates.

Seamless Creation of Tough Textures

As rendering algorithms have progressed, it’s crucial that the 3D content available keeps up with the complexity and richness that the algorithms are capable of.

NVIDIA researchers are diving into this area by developing a variety of techniques that support content creators in their efforts to model rich and realistic 3D environments. One area of focus is on materials with rich geometric complexity, which can be difficult to simulate using traditional techniques.

The weave of a polo shirt, the texture of a carpet, or blades of grass have features often much smaller than the size of a pixel, making it difficult to efficiently store and render representations of them. NVIDIA researchers are addressing this with NeRF-Tex, an approach that uses neural networks to represent these challenging materials and encode how they respond to lighting.

Seeing the Forest for the Trees

Complex geometric objects also vary in their appearance depending on how close they are to the viewer. A leafy tree is one example: Close up, there’s enormous detail in its branches, leaves and bark. From afar, it may appear to be little more than a green blob.

It would be a waste of time to render detailed bark and leaves on a tree that’s on the other end of the forest in a scene. But when zooming in for a close-up, the model should be as realistic as possible.

This is a classic problem in computer graphics known as level of detail. Artists have often been burdened with this challenge, manually modeling multiple versions of each 3D object to enable efficient rendering.

NVIDIA researchers have developed a new approach that generates simplified models automatically based on an inverse rendering method. With it, creators can generate simplified models that are optimized to appear indistinguishable from the originals, but with drastic reductions in their geometric complexity.

NVIDIA at SIGGRAPH 2021 

More than 200 scientists around the globe make up the NVIDIA Research team, focusing on AI, computer graphics, computer vision, self-driving cars, robotics and more. At SIGGRAPH, which runs from Aug. 9-13, our researchers are presenting the following papers:

Don’t miss NVIDIA’s special address at SIGGRAPH on Aug. 10 at 8 a.m. Pacific, revealing our latest technology, demos and more. Catch our Real Time Live demo on Aug. 10 at 4:30 p.m. Pacific to see how NVIDIA Research creates AI-driven digital avatars.

We’re also discussing esports as a real-time graphics challenge in a panel on Aug. 11. An interactive esports demo is available on demand through the SIGGRAPH Emerging Technologies program.

For more, check out the full lineup of NVIDIA events at SIGGRAPH 2021.

The post Leading Lights: NVIDIA Researchers Showcase Groundbreaking Advancements for Real-Time Graphics appeared first on The Official NVIDIA Blog.

Read More

Time to Embark: Autonomous Trucking Startup Develops Universal Platform on NVIDIA DRIVE

Autonomous trucking startup Embark is planning for universal autonomy of commercial semi-trucks, developing one AI platform that fits all.

The company announced today that it will use NVIDIA DRIVE to develop its Embark Universal Interface (EUI), a manufacturer-agnostic platform that includes the compute and multimodal sensors necessary for autonomous trucks. This flexible approach, combined with the high performance of NVIDIA DRIVE, leads to an easily scalable solution for safer, more efficient delivery and logistics.

The EUI is purpose-built to run Embark Driver autonomous driving software for a comprehensive self-driving trucking system.

Most trucking carriers don’t just use one model of vehicle in their fleets. This variety can even extend to vehicles from different manufacturers to haul a wide range of cargo around the world.

The Embark platform will be capable of integrating into trucks from any of the four major truck manufacturers in the U.S. — PACCAR, Volvo, International and Freightliner. By developing a platform that can be retrofitted to such a wide range of vehicles, Embark is helping the trucking industry realize the benefits of AI-powered driving without having to wait for purpose-built vehicles.

And with NVIDIA DRIVE at its core, the platform leverages the best in high-performance AI compute for robust self-driving capabilities.

Scaling Safety

Autonomous vehicles are always learning, taking in vast amounts of data to navigate the unpredictability of the real world, from highways to crowded ports. This rapid processing requires centralized, high-performance AI compute.

The NVIDIA DRIVE platform is the first scalable AI hardware and software platform to enable the production of automated and self-driving vehicles. It combines deep learning, sensor fusion and surround vision for a safe driving experience.

This end-to-end open platform allows for one development investment across an entire fleet, from level 2+ systems all the way to level 5 fully autonomous vehicles. In addition to high-performance, scalable compute, the EUI will have all the necessary functional safety certification to operate without a driver on public roads.

“We need an enormous amount of compute horsepower in our trucks,” said Ajith Dasari, head of Hardware Platform at Embark. “NVIDIA DRIVE meets this need head-on, and allows us to outfit our partners and customers with the best self-driving hardware and software currently on the market.”

A Growing Ecosystem

Embark is already working with leading trucking companies and plans to continue to extend its software and hardware technology.

In April, the company unveiled partnerships with Werner Enterprises, Mesilla Valley Transportation and Bison Transport. It’s also working with shippers including Anheuser Busch InBev and HP, Inc.

Embark plans to list on the public market, announcing a SPAC, or special purpose acquisition company, agreement in June, as well as a partnership with Knight-Swift Transportation. The autonomous trucking company will join the ranks of NVIDIA DRIVE ecosystem members who have collectively raised more than $8 billion via public listings.

And just like the trucks running on its Embark Universal Interface, the company is tapping the power of NVIDIA DRIVE to keep traveling further and more intelligently.

The post Time to Embark: Autonomous Trucking Startup Develops Universal Platform on NVIDIA DRIVE appeared first on The Official NVIDIA Blog.

Read More

What Matters in Learning from Offline Human Demonstrations for Robot Manipulation

Overview

Imitation Learning is a promising approach to endow robots with various complex manipulation capabilities. By allowing robots to learn from datasets collected by humans, robots can learn to perform the same skills that were demonstrated by the human. Typically, these datasets are collected by having humans control robot arms, guiding them through different tasks. While this paradigm has proved effective, a lack of open-source human datasets and reproducible learning methods make assessing the state of the field difficult. In this paper, we conduct an extensive study of six offline learning algorithms for robot manipulation on five simulated and three real-world multi-stage manipulation tasks of varying complexity, and with datasets of varying quality. Our study analyzes the most critical challenges when learning from offline human data for manipulation.

Based on the study, we derive several lessons to understand the challenges in learning from human demonstrations, including the sensitivity to different algorithmic design choices, the dependence on the quality of the demonstrations, and the variability based on the stopping criteria due to the different objectives in training and evaluation. We also highlight opportunities for learning from human datasets, such as the ability to learn proficient policies on challenging, multi-stage tasks beyond the scope of current reinforcement learning methods, and the ability to easily scale to natural, real-world manipulation scenarios where only raw sensory signals are available.

We have open-sourced our datasets and all algorithm implementations to facilitate future research and fair comparisons in learning from human demonstration data. Please see the robomimic website for more information.

In this study, we investigate several challenges of offline learning from human datasets and extract lessons to guide future work.

Why is learning from human-labeled datasets difficult?

We explore five challenges in learning from human-labeled datasets.

  • (C1) Unobserved Factors in Human Decision Making. Humans are not perfect Markovian agents. In addition to what they currently see, their actions may be influenced by other external factors – such as the device they are using to control the robot and the history of the actions that they have provided.
  • (C2) Mixed Demonstration Quality. Collecting data from multiple humans can result in mixed quality data, since some people might be better quality supervisors than others.
  • (C3) Dependence on dataset size. When a robot learns from an offline dataset, it needs to understand how it should act (action) in every scenario that it might encounter (state). This is why the coverage of states and actions in the dataset matters. Larger datasets are likely to contain more situations, and are therefore likely to train better robots.
  • (C4) Train Objective ≠ Eval Objective. Unlike traditional supervised learning, where validation loss is a strong indicator of how good a model is, policies are usually trained with surrogate losses. Consider an example where we train a policy via Behavioral Cloning from a set of demonstrations on a block lifting task. Here, the policy is trained to replicate the actions taken by the demonstrator, but this is not necessarily equivalent to optimizing the block lifting success rate (see the Dagger paper for a more precise explanation). This makes it hard to know which trained policy checkpoints are good without trying out each and every model directly on the robot – a time consuming process.
  • (C5) Sensitivity to Agent Design Decisions. Performance can be very sensitive to important agent design decisions, like the observation space and hyperparameters used for learning.

Study Design

In this section, we summarize the tasks (5 simulated and 3 real), datasets (3 different variants), algorithms (6 offline methods, including 3 imitation and 3 batch reinforcement), and observation spaces (2 main variants) that we explored in our study.

Tasks

Lift
Can
Tool Hang
Square
Lift (Real)
Can (Real)
Tool Hang (Real)
Transport
We collect datasets across 6 operators of varying proficiency and evaluate offline policy learning methods on 8 challenging manipulation tasks that test a wide range of manipulation capabilities including pick-and-place, multi-arm coordination, and high-precision insertion and assembly.

Task Reset Distributions

When measuring the task success rate of a policy, the policy is evaluated across several trials. At the start of each trial, the initial placement of all objects in the task are randomized from a task reset distribution. The videos below show this distribution for each task. This gives an impression of the range of different scenarios that a trained policy is supposed to be able to handle.

Lift
Can
Tool Hang
Square
Lift (Real)
Can (Real)
Tool Hang (Real)
Transport
We show the task reset distributions for each task, which governs the initial placement of all objects in the scene at the start of each episode. Initial states are sampled from this distribution at both train and evaluation time.

Datasets

We collected 3 kinds of datasets in this study.

Machine-Generated

These datasets consist of rollouts from a series of SAC agent checkpoints trained on Lift and Can, instead of humans. As a result, they contain random, suboptimal, and expert data due to the varied success rates of the agents that generated the data. This kind of mixed quality data is common in offline RL works (e.g. D4RL, RLUnplugged).

Lift (MG)
Can (MG)
Lift and Can Machine-Generated datasets.

Proficient-Human

These datasets consist of 200 demonstrations collected from a single proficient human operator using RoboTurk.

Lift (PH)
Can (PH)
Square (PH)
Transport (PH)
Tool Hang (PH)
Proficient-Human datasets generated by 1 proficient operator (with the exception of Transport, which had 2 proficient operators working together).

Multi-Human

These datasets consist of 300 demonstrations collected from six human operators of varied proficiency using RoboTurk. Each operator falls into one of 3 groups – “Worse”, “Okay”, and “Better” – each group contains two operators. Each operator collected 50 demonstrations per task. As a result, these datasets contain mixed quality human demonstration data. We show videos for a single operator from each group.

Lift (MH) – Worse
Lift (MH) – Okay
Lift (MH) – Better
Multi-Human Lift dataset. The videos show three operators – one that’s “worse” (left), “okay” (middle) and “better” (right).
Can (MH) – Worse
Can (MH) – Okay
Can (MH) – Better
Multi-Human Can dataset. The videos show three operators – one that’s “worse” (left), “okay” (middle) and “better” (right).
Square (MH) – Worse
Square (MH) – Okay
Square (MH) – Better
Multi-Human Square dataset. The videos show three operators – one that’s “worse” (left), “okay” (middle) and “better” (right).
Transport (MH) – Worse-Worse
Transport (MH) – Okay-Okay
Transport (MH) – Better-Better
Transport (MH) – Worse-Okay
Transport (MH) – Worse-Better
Transport (MH) – Okay-Better
Multi-Human Transport dataset. These were collected using pairs of operators with Multi-Arm RoboTurk (each one controlled 1 robot arm). We collected 50 demonstrations per combination of the operator subgroups.

Algorithms

We evaluated 6 different offline learning algorithms in this study, including 3 imitation learning and 3 batch (offline) reinforcement learning algorithms.

We evaluated 6 different offline learning algorithms in this study, including 3 imitation learning and 3 batch (offline) reinforcement learning algorithms.
  • BC: standard Behavioral Cloning, which is direct regression from observations to actions.
  • BC-RNN: Behavioral Cloning with a policy network that’s a recurrent neural network (RNN), which allows modeling temporal correlations in decision-making.
  • HBC: Hierarchical Behavioral Cloning, where a high-level subgoal planner is trained to predict future observations, and a low-level recurrent policy is conditioned on a future observation (subgoal) to predict action sequences (see Mandlekar*, Xu* et al. (2020) and Tung*, Wong* et al. (2021) for more details).
  • BCQ: Batch-Constrained Q-Learning, a batch reinforcement learning method proposed in Fujimoto et al. (2019).
  • CQL: Conservative Q-Learning, a batch reinforcement learning method proposed in Kumar et al. (2020).
  • IRIS: Implicit Reinforcement without Interaction, a batch reinforcement learning method proposed in Mandlekar et al. (2020).

Observation Spaces

We study two different observation spaces in this work – low-dimensional observations and image observations.

We study two different observation spaces in this work.

Image Observations

We provide examples of the image observations used in each task below.

Most tasks have a front view and wrist view camera. The front view matches the view provided to the operator during data collection.
Tool Hang has a side view and wrist view camera. The side view matches the view provided to the operator during data collection.
Transport has a shoulder view and wrist view camera per arm. The shoulder view cameras match the views provided to each operator during data collection.

Summary of Lessons Learned

In this section, we briefly highlight the lessons we learned from our study. See the paper for more thorough results and discussion.

Lesson 1: History-dependent models are extremely effective.

We found that there is a substantial performance gap between BC-RNN and BC, which highlights the benefits of history-dependence. This performance gap is larger for longer-horizon tasks (e.g. ~55% for the Transport (PH) dataset compared to ~5% for the Square (PH) dataset)) and also larger for multi-human data compared to single-human data (e.g.~25% for Square (MH) compared to ~5% for Square (PH)).

Methods that make decisions based on history, such as BC-RNN and HBC, outperform other methods on human datasets.

Lesson 2: Batch (Offline) RL struggles with suboptimal human data.

Recent batch (offline) RL algorithms such as BCQ and CQL have demonstrated excellent results in learning from suboptimal and multi-modal machine-generated datasets. Our results confirm the capacity of such algorithms to work well – BCQ in particular performs strongly on our agent-generated MG datasets that consist of a diverse mixture of good and poor policies (for example, BCQ achieves 91.3% success rate on Lift (MG) compared to BC which achieves 65.3%).

Surprisingly though, neither BCQ nor CQL performs particularly well on these human-generated datasets. For example, BCQ and CQL achieve 62.7% and 22.0% success respectively on the Can (MH) dataset, compared to BC-RNN which achieves 100% success. This puts the ability of such algorithms to learn from more natural dataset distributions into question (instead of those collected via RL exploration or pre-trained agents). There is an opportunity for future work in batch RL to resolve this gap.

While batch (offline) RL methods are proficient at dealing with mixed quality machine-generated data, they struggle to deal with mixed quality human data.
To further evaluate methods in a simpler setting, we collected the Can Paired dataset, where every task instance has two demonstrations, one success and one failure. Even this simple setting, where each start state has exactly one positive and one negative demonstration, poses a problem.

Lesson 3: Improving offline policy selection is important.

The mismatch between train and evaluation objective causes problems for policy selection – unlike supervised learning, the best validation loss does not correspond to the best performing policy. We found that the best validation policy is 50 to 100% worse than the best performing policy. Thus, each policy checkpoint needs to be tried directly on the robot – this can be costly.

Lesson 4: Observation space and hyperparameters play a large role in policy performance.

We found that observation space choice and hyperparameter selection is crucial for good performance. As an example, not including wrist camera observations can reduce performance by 10 to 45 percent

Lesson 5: Using human data for manipulation is promising.

Studying how dataset size impacts performance made us realize that using human data holds much promise. For each task, the bar chart shows how performance changes going from 20% to 50% to 100% of the data. Simpler tasks like Lift and Can require just a fraction of our collected datasets to learn, while more complex tasks like Square and Transport benefit substantially from adding more human data, suggesting that more complex tasks could be addressed by using large human datasets.

Lesson 6: Study results transfer to real world.

We collected 200 demonstrations per task, and trained a BC-RNN policy using identical hyperparameters to simulation, with no hyperparameter tuning. We see that in most cases, performance and insights on what works in simulation transfer well to the real world.

Lift (Real). 96.7% success rate. Nearly matches performance in simulation (100%).
Can (Real). 73.3% success rate. Nearly matches performance in simulation (100%).
Tool Hang (Real). 3.3% success rate. Far from simulation (67.3%) – the real task is harder.

Below, we present examples of policy failures on the Tool Hang task, which illustrate its difficulty, and the large room for improvement.

Insertion Miss
Failed Insertion
Failed Tool Grasp
Tool Drop
Failures which illustrate the difficulty of the Tool Hang task.

We also show that results from our observation space study hold true in the real world – visuomotor policies benefit strongly from wrist observations and pixel shift randomization.

Can (no Wrist). 43.3% success rate (compared to 73.3% with wrist).
Can (no Rand). 26.7% success rate (compared to 73.3% with randomization).
Without wrist observations (left) the success rate decreases from 73.3% to 43.3%. Without pixel shift randomization (right), the success rate decreases from 73.3% to 26.7%.

Takeaways

  1. Learning from large multi-human datasets can be challenging.
  2. Large multi-human datasets hold promise for endowing robots with dexterous manipulation capabilities.
  3. Studying this setting in simulation can enable reproducible evaluation and insights can transfer to real world.

Please see the robomimic website for more information.

This blog post is based on the following paper:

Read More