Scientists from glamazon, Amazon’s LGBTQIA+ affinity group, say this year’s Pride Month is as much about solidarity as it is about celebration.Read More
Applying for technical roles
We answer the Women in Machine Learning community’s questions about applying for a job in industry.Read More

RepNet: Counting Repetitions in Videos
Posted by Debidatta Dwibedi, Research Scientist, Robotics at Google
Repeating processes ranging from natural cycles, such as phases of the moon or heartbeats and breathing, to artificial repetitive processes, like those found on manufacturing lines or in traffic patterns, are commonplace in our daily lives. Beyond just their prevalence, repeating processes are of interest to researchers for the variety of insights one can tease out of them. It may be that there is an underlying cause behind something that happens multiple times, or there may be gradual changes in a scene that may be useful for understanding. Sometimes, repeating processes provide us with unambiguous “action units”, semantically meaningful segments that make up an action. For example, if a person is chopping an onion, the action unit is the manipulation action that is repeated to produce additional slices. These units may be indicative of more complex activity and may allow us to analyze more such actions automatically at a finer time-scale without having a person annotate these units. For the above reasons, perceptual systems that aim to observe and understand our world for an extended period of time will benefit from a system that understands general repetitions.
In “Counting Out Time: Class Agnostic Video Repetition Counting in the Wild”, we present RepNet, a single model that can understand a broad range of repeating processes, ranging from people exercising or using tools, to animals running and birds flapping their wings, pendulums swinging, and a wide variety of others. In contrast to our previous work, which used cycle-consistency constraints across different videos of the same action to understand them at a fine-grained level, in this work we present a system that can recognize repetitions within a single video. Along with this model, we are releasing a dataset to benchmark class-agnostic counting in videos and a Colab notebook to run RepNet.
RepNet
RepNet is a model that takes as input a video that contains periodic action of a variety of classes (including those unseen during training) and returns the period of repetitions found therein. In the past the problem of repetition counting has been addressed by directly comparing pixel intensities in frames, but real world videos have camera motion, occlusion by objects in the field, drastic scale difference and changes in form, which necessitates learning of features invariant to such noise. To accomplish this we train a machine learning model in an end-to-end manner to directly estimate the period of the repetitions. The model consists of three parts: a frame encoder, an intermediate representation, called a temporal self-similarity matrix (which we will describe below), and a period predictor.
First, the frame encoder uses the ResNet architecture as a per-frame model to generate embeddings of each frame of the video The ResNet architecture was chosen since it has been successful for a number of image and video tasks. Passing each frame of a video through a ResNet-based encoder yields a sequence of embeddings.
At this point we calculate a temporal self-similarity matrix (TSM) by comparing each frame’s embedding with every other frame in the video, returning a matrix that is easy for subsequent modules to analyze for counting repetitions. This process surfaces self-similarities in the stream of video frames that enable period estimation, as demonstrated in the video below.
 |
| Demonstration of how the TSM processes images of the Earth’s day-night cycle. |
For each frame, we then use Transformers to predict the period of repetition and the periodicity (i.e., whether or not a frame is part of the periodic process) directly from the sequence of similarities in the TSM. Once we have the period, we obtain the per-frame count by dividing the number of frames captured in a periodic segment by the period length. We sum this up to predict the number of repetitions in the video.
 |
| Overview of the RepNet model. |
Temporal Self-Similarity Matrix
The example of the TSM from the day-night cycle, shown above, is derived from an idealized scenario with fixed period repetitions. TSMs from real videos often reveal fascinating structures in the world, as demonstrated in the three examples below. Jumping jacks are close to the ideal periodic action with a fixed period, while in contrast, the period of a bouncing ball declines as the ball loses energy through repeated bounces. The video of someone mixing concrete demonstrates repetitive action that is preceded and followed by a period without motion. These three behaviors are clearly distinguished in the learned TSM, which requires that the model pay attention to fine changes in the scene.
 |
| Jumping Jacks (constant period; video from Kinetics), Bouncing ball (decreasing period; Kinetics), Mixing concrete (aperiodic segments present in video; PERTUBE dataset). |
One advantage of using the TSM as an intermediate layer in RepNet is that the subsequent processing by the transformers is done in the self-similarity space and not in the feature space. This encourages generalization to unseen classes. For example, the TSMs produced by actions as different as jumping jacks or swimming are similar as long as the action was repeated at a similar pace. This allows us to train on some classes and yet expect generalization to unseen classes.
Data
One way to train the above model would be to collect a large dataset of videos that capture repetitive activities and label them with the repetition count. The challenge in this is two-fold. First, it requires one to examine a large number of videos to identify those with repeated actions. Following that, each video must be annotated with the number of times an action was repeated. While for certain tasks annotators can skip frames (for example, to classify a video as showing jumping jacks), they still need to see the entire video in order to count how many jumping jacks were performed.
We overcome this challenge by introducing a process for synthetic data generation that produces videos with repetitions using videos that may not contain repeating actions at all. This is accomplished by randomly selecting a segment of the video to repeat an arbitrary number of times, bookended by the original video context.
 |
| Our synthetic data generation pipeline that produces videos with repetitions from any video. |
While this process generates a video that resembles a natural-looking video with repeating processes, it is still too simple for deep learning methods, which can learn to cheat by looking for artifacts, instead of learning to recognize repetitions. To address this, we perform extreme data augmentation, which we call camera motion augmentation. In this method, we modify the video to simulate a camera that smoothly moves around using 2D affine motion as the video progresses.
 |
| Left: An example of a synthetic repeating video generated from a random video. Right: An example of a video with camera motion augmentation, which is tougher for the model, but results in better generalization to real repeating videos (both from Kinetics). |
Evaluation
Even though we can train a model on synthetic repeating videos, the resulting models must be able to generalize to real video of repeating processes. In order to evaluate the performance of the trained models on real videos, we collect a dataset of ~9000 videos from the Kinetics dataset. These videos span many action classes and capture diverse scenes, arising from the diversity of data seen on Youtube. We annotate these videos with the count of the action being repeated in the video. To encourage further research in this field, we are releasing the count annotations for this dataset, which we call Countix.
Applications
A class-agnostic counting model has many useful applications. RepNet serves as a single model that can count repetitions from many different domains:
 |
| RepNet can count repeated activities from a range of domains, such as slicing onions (left; video from Kinetics dataset), Earth’s diurnal cycle (middle; Himawari satellite data), or even a cheetah in motion (right; video from imgur.com). |
RepNet could be used to estimate heartbeat rates from echocardiogram videos even though it has not seen such videos in training:
 |
| Predicted heart rates: 45 bpm (left) and 75 bpm (right). True heart rates 46-50 bpm and 78-79 bpm, respectively. RepNet’s prediction of the heart rate across different devices is encouragingly close to the rate measured by the device. (Source for left and right) |
RepNet can also be used to monitor repeating activities for any changes in speed. Below we show how the Such changes in speed can also be used in other settings for quality or process control.
 |
| In this video, we see RepNet counting accelerating cellular oscillations observed under a laser microscope even though it has never seen such a video during training, (from Nature article). |
 |
| Left: Person performing a “mountain climber” exercise. Right: The 1D projection of the RepNet embeddings using principal component analysis, capturing the moment that the person changes their speed during the exercise. (Video from Kinetics) |
Release
We are releasing Countix annotations for the community to work on the problem of repetition counting. We are also releasing a Colab notebook for running RepNet. Using this you can run RepNet on your videos or even using your webcam to detect periodic activities in video and count repetitions automatically in videos.
Acknowledgements
This is joint work with Yusuf Aytar, Jonathan Tompson, Pierre Sermanet, and Andrew Zisserman. Special thanks to Tom Small for designing the visual explanation of TSM. The authors thank Anelia Angelova, Relja Arandjelović, Sourish Chaudhuri, Aishwarya Gomatam, Meghana Thotakuri, and Vincent Vanhoucke for their help with this project.

Scheduling Jupyter notebooks on SageMaker ephemeral instances
It’s 5 PM on a Friday. You’ve spent all afternoon coding out a complex, sophisticated feature engineering strategy. It just started working on your Amazon SageMaker Studio t3.medium notebook, and all you want to do is plug this onto a massive instance, scale it out over the rest of your dataset, and go home. You could upgrade your notebook instance, but the job would stop as soon as you close your laptop. Why not schedule the job from your notebook directly?
Amazon SageMaker provides a fully-managed solution for building, training, and deploying machine learning (ML) models. In this post, we demonstrate using Amazon SageMaker Processing Jobs to execute Jupyter notebooks with the open-source project Papermill. The combination of Amazon SageMaker with Amazon CloudWatch, AWS Lambda, and the entire AWS stack have always provided the modular backbone you need to scale up jobs, like feature engineering, both on the fly and on a schedule. We’re happy to provide a do-it-yourself toolkit to simplify this process, using AWS CloudFormation to set up permissions, Lambda to launch the job, and Amazon Elastic Container Registry (Amazon ECR) to create a customized execution environment. It includes a library and CLI to initiate notebook execution from any AWS client and a Jupyter plugin for a seamless user experience.
As of this writing, you can write code in a Jupyter notebook and run it on an Amazon SageMaker ephemeral instance with the click of a button, either immediately or on a schedule. With the tools provided here, you can do this from anywhere: at a shell prompt, in JupyterLab on Amazon SageMaker, in another JupyterLab environment you have, or automated in a program you’ve written. We’ve written sample code that simplifies setup by using AWS CloudFormation to handle the heavy lifting and provides convenience tools to run and monitor executions.
For more information about executing notebooks, see the GitHub repo. All the source code is available in aws-samples on GitHub. Read on to learn all about how to use scheduled notebook execution.
When to use this solution
This toolkit is especially useful for running nightly reports. For example, you may want to analyze all the training jobs your data science team ran that day, run a cost/benefit analysis, and generate a report about the business value your models are going to bring after you deploy them into production. That would be a perfect fit for a scheduled notebook—all the graphs, tables, and charts are generated by your code, the same as if you stepped through the notebook yourself, except now they are handled automatically, in addition to persisting in Amazon Simple Storage Service (Amazon S3). You can start your day with the latest notebook, executed overnight, to move your analysis forward.
Or, imagine that you want to scale up a feature engineering step. You’ve already perfected the for-loop to knock out all your Pandas transformations, and all you need is time and compute to run this on the full 20 GB of data. No problem—just drop your notebook into the toolkit, run a job, close your laptop, and you’re done. Your code continues to run on the scheduled instance, regardless of whether or not you’re actively using Jupyter at the moment.
Perhaps you’re on a data science team that still trains models on local laptops or Amazon SageMaker notebooks, and haven’t yet adopted the Amazon SageMaker ephemeral instances for training jobs. With this toolkit, you can easily use the advanced compute options only for the time you’re training a model. You can spin up a p3.xlarge only for the hour your model trains but use your Studio environment all day on the affordable t3.medium. You can easily connect these resources to the Experiments SDK with a few lines of code. Although it’s still fully supported to run Amazon SageMaker notebooks and Amazon SageMaker Studio on p3 instances, developing a habit of using the largest instances only for short periods is a net cost-savings exercise.
You may have an S3 bucket full of objects and need to run a full notebook on each object. These could be dates of phone call records in your call center or Tweet-streams from particular users in your social network. You can easily write a for-loop over those objects by using this toolkit, which schedules a job for each file, runs it on its dedicated instance, and stores the completed notebook in Amazon S3. These could even be model artifacts loaded in from your preferred training environment—package up your inference code in a notebook and use the toolkit to easily deploy them!
Finally, customers tell us that reporting on the performance of their models is a key asset for their stakeholders. With this toolkit, you can implement a human-in-the-loop solution that analyzes feature importance, produces ROC curves, and estimates how your model will perform on the tricky edge cases that are crucial to your final product. You can build a model profiler that all the data scientists on your team can easily access. You can trigger this model profiler to run after every training job is complete, closing the loop on the value of your analysis to your stakeholders.
Three Ways to Execute Notebooks on a Schedule in SageMaker
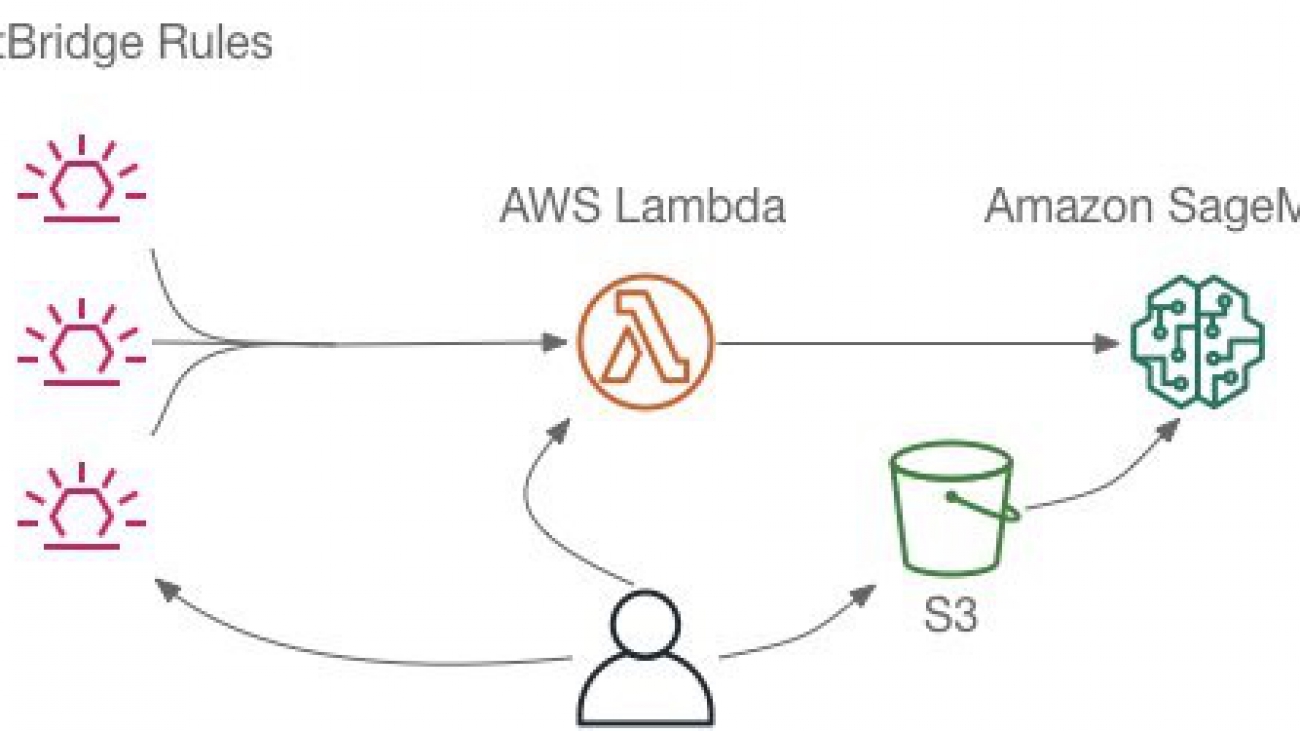
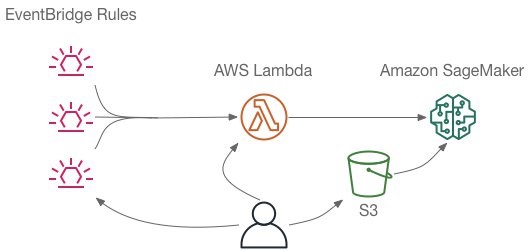
To execute a notebook in Amazon SageMaker, you use a Lambda function that sets up and runs an Amazon SageMaker Processing job. The function can be invoked directly by the user or added as a target of an Amazon EventBridge rule to run on a schedule or in response to an event. The notebook to run is stored as an Amazon S3 object so it’s available to run even if you’re not online when the execution happens. The following diagram illustrates this architecture.
We outline three different ways to install and use this capability that let you work with notebooks and schedules just the way you want.
Using the AWS APIs or CLI directly
You can use the AWS APIs directly to execute and schedule notebooks. To make the process easier, we have provided a CloudFormation template to set up the Lambda function you need and some AWS Identity and Access Management (IAM) roles and policies that you use when running notebooks. We also provided scripts for building and customizing the Docker container images that Amazon SageMaker Processing Jobs uses when running the notebooks.
After you instantiate the CloudFormation template and create a container image, you can run a notebook like this with the following code:
$ aws lambda invoke --function-name RunNotebook
             --payload '{"input_path": "s3://mybucket/mynotebook.ipynb",
                         "parameters": {"p": 0.75}}' result.json
To create a schedule, enter the following code, replacing the Region and account number in the arn, as well as the input_path to your S3 bucket.
$ aws events put-rule --name "RunNotebook-test" --schedule "cron(15 1 * * ? *)"
$ aws lambda add-permission --statement-id EB-RunNotebook-test
                            --action lambda:InvokeFunction
                            --function-name RunNotebook
                            --principal events.amazonaws.com
                            --source-arn arn:aws:events:us-east-1:123456789:rule/RunNotebook-test
$ aws events put-targets --rule RunNotebook-test
                         --targets '[{"Id": "Default",
                                      "Arn": "arn:aws:lambda:us-east-1:123456789:function:RunNotebook",
                                      "Input": "{ "input_path": "s3://mybucket/mynotebook.ipynb",
                                                  "parameters": {"p": 0.75}}"}]‘
With this approach, you manage moving the notebook to Amazon S3, monitoring Amazon SageMaker Processing Jobs, and retrieving the output notebook from Amazon S3.
This is a great solution when you’re a knowledgeable AWS user who wants to craft a solution without taking on extra dependencies. You can even modify the Lambda function we’ve written or the Papermill execution container to meet your exact needs.
For more information about scheduling notebooks with the AWS APIs, see the full setup instructions on the GitHub repo.
Making things easier with a convenience package
To make it easier to schedule notebooks (especially if you aren’t an AWS expert), we’ve created a convenience package that wraps the AWS tools in a CLI and Python library that give you a more natural interface to running and scheduling notebooks. This package lets you build customized execution environments without Docker, via AWS CodeBuild instead, and manages the Amazon S3 interactions and job monitoring for you.
After you run the setup, execute the notebook with the following code:
$ run-notebook run mynotebook.ipynb -p p=0.5 -p n=200Schedule a notebook with the following code:
$ run-notebook schedule --at "cron(15 1 * * ? *)" --name nightly weather.ipynb -p "name=Boston, MA"The convenience package also contains tools to monitor jobs and view schedules. See the following code:
$ run-notebook list-runs
Date                 Rule                 Notebook              Parameters           Status     Job
2020-06-15 15:31:40                       fraud-analysis.ipynb  name=Tom             Completed  papermill-fraud-analysis-2020-06-15-22-31-39
2020-06-15 01:00:08  DailyForecastSeattle DailyForecast.ipynb   place=Seattle, WA    Completed  papermill-DailyForecast-2020-06-15-08-00-08
2020-06-15 01:00:03  DailyForecastNewYork DailyForecast.ipynb   place=New York, NY   Completed  papermill-DailyForecast-2020-06-15-08-00-02
2020-06-12 22:34:06                       powers.ipynb          p=0.5                Completed  papermill-powers-2020-06-13-05-34-05
                                                                n=20
$
For more information about the convenience package, see the GitHub repo.
Executing notebooks directly from JupyterLab with a GUI
For those who prefer an interactive experience, the convenience package includes a JupyterLab extension that you can enable for JupyterLab running locally, in Amazon SageMaker Studio, or on an Amazon SageMaker notebook instance.

After you set up the Jupyter extension for Amazon SageMaker Studio users, you see the new notebook execution sidebar (the rocket ship icon). The sidebar lets you execute or schedule the notebook you’re viewing . You can use the notebook-runner container that was created by the default setup or any other container you built. Enter the ARN for the execution role these jobs utilize and your instance preference, and you’re ready to go!
After you choose Run Now, the Lambda function picks up your notebook and runs it on an Amazon SageMaker Processing job. You can view the status of that job by choosing Runs. See the following screenshot.

When the job is complete, the finished notebook is stored in Amazon S3. Remember, this means your previous runs will persist, so you can easily revert back to them.
Finally, import the output notebook by choosing View Output and Import Notebook. If you don’t import the notebook, it’s never copied to your local directory. This is great when you want to see what happened, but don’t want to clutter things up with lots of extra notebooks.

For instructions on setting up the JupyterLab extension and using the GUI to run and monitor your notebooks, see the GitHub repo.
Summary
This post discussed how you can combine the modular capabilities of Amazon SageMaker and the AWS cloud to give data scientists and ML engineers the seamless experience of running notebooks on ephemeral instances. We are releasing an open-source toolkit to simplify this process, including a CLI, convenience package, and Jupyter widget. We discussed a variety of use cases for this, from running nightly reports to scaling up feature engineering to profiling models on the latest datasets. We shared examples from the various ways of running the toolkit. Feel free to walk through the Quick Start on GitHub and step through even more examples on the GitHub repo.
Author Bios
 Emily Webber is a machine learning specialist SA at AWS, who alternates between data scientist, machine learning architect, and research scientist based on the day of the week. She lives in Chicago, and you can find her on YouTube, LinkedIn, GitHub, or Twitch. When not helping customers and attempting to invent the next generation of machine learning experiences, she enjoys running along beautiful Lake Shore Drive, escaping into her Kindle, and exploring the road less traveled.
 Tom Faulhaber is a Principal Engineer on the Amazon SageMaker team. Lately, he has been focusing on unlocking all the potential uses of the richness of Jupyter notebooks and how they can add to the data scientist’s toolbox in non-traditional ways. In his spare time, Tom is usually found biking and hiking to discover all the wild spaces around Seattle with his kids.

AWS DeepComposer Chartbusters: generate compositions in the style of Bach and compete to top the charts
We are excited to announce the launch of AWS DeepComposer Chartbusters, a monthly challenge where developers can use AWS DeepComposer to create original compositions and compete to top the charts and win prizes. AWS DeepComposer gives developers a creative way to get started with machine learning (ML) and generative AI techniques. With AWS DeepComposer, developers, regardless of their background in ML, can get started with generative AI techniques to learn how to train and optimize their models to create original music. The first AWS DeepComposer Chartbusters challenge, Bach to the Future, requires developers to use a new generative AI algorithm provided in the AWS DeepComposer console to create compositions in the style of Bach.
Every month through October, 2020, AWS will release a new Chartbusters challenge that has a different monthly theme to introduce you to a variety of generative AI techniques. You don’t need any musical knowledge to participate in the challenge. Before participating in a challenge, you can use learning capsules available in the AWS DeepComposer console to learn the generative AI concepts required for each month’s challenge. Learning capsules provide easy-to-consume, bite-size content to help you learn the concepts of generative AI algorithms.
How to participate in the challenge
The challenge is open worldwide for developers to participate. To get started, you will need to use one of the generative AI algorithms available in the AWS DeepComposer console to create compositions. Once you are ready to submit your composition for the challenge, select Submit a composition in the console to submit your creations to SoundCloud. AWS DeepComposer will add your submission to the Chartbuster challenge playlist on SoundCloud.
You can invite your family and friends to listen and like your composition by using the social sharing buttons available on SoundCloud. At the end of each challenge period, AWS will shortlist the top 20 compositions using a sum of customer likes and count of plays on SoundCloud. Our human AWS experts and DeepComposer AI judge will evaluate the shortlist based on musical quality and creativity to select the top 10 ranked compositions. The DeepComposer AI judge is trained on original Bach compositions and scores how similar your composition is to Bach’s style.
At the end of each challenge period, we will announce the top 10 compositions in an AWS ML blog post and feature them in an exclusive AWS top 10 playlist on SoundCloud and in the AWS DeepComposer console. The winner for each month’s challenge will receive an AWS DeepComposer Chartbusters gold record mailed to their physical address. Additionally, we will interview the winner to share their experience and feature them in an AWS ML blog post. You can continue to participate in multiple challenges so that if you don’t make it to the top 10 in one challenge, you can participate in the next challenge for another chance to top the charts.

Bach to the Future challenge
The first AWS DeepComposer Chartbuster challenge titled Bach to the Future launches today and is open until July 25th. To participate in the challenge, you will need to use the autoregressive CNN (AR-CNN) algorithm available in the AWS DeepComposer console to create compositions in the style of Bach. AWS will announce the top 10 compositions for the Bach to the Future challenge and the theme for the next challenge on July 31st, 2020, in an AWS ML blog post.
The AR-CNN algorithm enhances the original input melody by adding or removing musical notes from the input melody. If the algorithm detects off-key or extraneous notes, it may choose to remove them. If it identifies additional specific notes that are highly probable in a Bach composition, it may decide to add them. Listen to the following example of a composition that is generated by applying the AR-CNN algorithm. You might recognize this tune from Jonathan Coulton, as it is available as a sample input melody in the AWS DeepComposer console.
Input: me-and-my-jar-with-extra-missing-notes.midi
Enhanced composition: me-and-my-jar-enhanced.midi
You can use the Introduction to autoregressive convolutional neural network learning capsule available in the AWS DeepComposer console to learn the concepts. To access the learning capsule in the console, navigate to learning capsules using the left navigation menu. Choose Introduction to autoregressive convolutional neural network to begin learning.

Creating and submitting a composition
To get started, log in to the AWS DeepComposer console and navigate to the music studio using the left navigation menu. You can use either the sample melodies provided in the console, record a custom melody using the keyboard, or import your own input track. You can adjust the tempo and pitch for your melody in the music studio.
Choose Autoregressive generative AI technique, and then choose Autoregressive CNN Bach model. You have four parameters that you can choose to adjust: Maximum notes to add, Maximum notes to remove, Sampling iterations, and Creative risk. For this example, let’s choose the defaults and select Enhance input melody.
The AR-CNN algorithm allows you to collaborate iteratively with the machine learning algorithm by experimenting with the parameters; you can use the output from one iteration of the AR-CNN algorithm as input to the next iteration.

To submit your composition for the challenge, choose Chartbusters using the left navigation menu, and select Submit a composition. Choose your composition from the drop-down menu, provide a track name for your composition, and select Submit. AWS DeepComposer will submit your composition to the Bach to the Future playlist on SoundCloud. You can select the Vote on SoundCloud button in the console to review and listen to other submissions for the challenge.

Congratulations! You have submitted your first entry for the AWS DeepComposer Chartbusters challenge. Invite your friends and family to listen to and like your composition.
To celebrate the launch of the first Chartbuster challenge, we are offering the AWS DeepComposer keyboard at a special price of $79 for a limited period from 6/23/2020 to 7/15/2020 on amazon.com. The pricing includes the keyboard and a 3-month free trial of AWS DeepComposer services.
Learn more about AWS DeepComposer Chartbusters at https://aws.amazon.com/deepcomposer/chartbusters.
About the Author
 Jyothi Nookula is a Principal Product Manager for AWS AI devices. She loves to build products that delight her customers. In her spare time, she loves to paint and host charity fund raisers for her art exhibitions.

Spotlight session with PhD students from the 2019 Facebook Fellowship cohort
Each year, we invite PhD students from around the world to apply for the Facebook Fellowship, a program designed to encourage and support promising doctoral students who are engaged in innovative and relevant research in areas related to computer science and engineering.
As a continuation of our regular Fellowship spotlight series, we’re highlighting Aishwarya Ganesan (University of Wisconsin–Madison), Kartik Hegde (University of Illinois at Urbana-Champaign), Maria Bauza Villalonga (Massachusetts Institute of Technology), and Neil Gaikwad (Massachusetts Institute of Technology). From teaching robots to identify objects to developing human-centered AI and public policy for sustainable development, these four Fellows showcase a wide array of research areas.
Improving the reliability of distributed systems without compromising performance
 Aishwarya Ganesan is a PhD candidate in computer sciences at the University of Wisconsin–Madison (UW–Madison), advised by Professor Andrea Arpaci-Dusseau and Professor Remzi Arpaci-Dusseau. Her research interests are in distributed systems, storage and file systems, and operating systems, with a focus on improving the reliability of distributed systems without compromising their performance.
“I’ve always been fascinated by distributed systems,” she says. “And the reliability and performance challenges are especially interesting at the scale of Facebook with multiple applications and millions of users.” In February, Aishwarya and her team at UW–Madison won a Facebook research award in distributed systems with their proposal entitled “BlockCheck: Examining and improving blockchain reliability.”
Aishwarya learned about the Facebook Fellowship program at OSDI. “One of the main reasons I applied [to the program] was the opportunity to be part of a cohort of peers who are likely to be my future colleagues in academia or industry,” she says. She also appreciates having connections to Fellows from previous years who could provide PhD guidance and practical advice such as what the interview process after graduation is like.
“Winning the Facebook Fellowship also gives me an opportunity to interact with Facebook researchers and engineers. Through these interactions, I hope to learn how the ideas developed as part of my thesis are applicable in the real world.”
Aishwarya’s research has been recognized with a Best Paper award at FAST 2020 and FAST 2018 and a Best Paper award nomination at FAST 2017. She was selected for the Rising Stars in EECS 2018 workshop. Read more on her webpage.
Accelerating deep learning on mobile and IoT devices
 Kartik Hegde is a PhD student at the University of Illinois at Urbana-Champaign, advised by Chris Fletcher. He received a bachelor of technology degree from National Institute of Technology Karnataka (NITK), Surathkal, in 2015. His research is focused on building efficient chips to power next-generation AI workloads.
Every day, we interact with smart devices that offer information and convenience through services hosted in the cloud — but this requires a constant internet connection, and response times can be slow. Kartik’s research aims to build more efficient processors that enable more machine learning on the device, faster and more cost effectively.
Before Kartik became a Fellow, he spent some time as an intern at Facebook and experienced what it’s like to conduct research in industry. “At Facebook, we get the best of what academia and industry offer,” he explains. “In academia, you have the independence to pursue your own ideas. In industry, you get the satisfaction of having an impact on people. If your idea is built into something at Facebook, it’s impacting billions of people. It’s the best of both worlds.”
The Fellowship Award includes a paid visit to Facebook HQ in Menlo Park for the annual Fellowship Summit, where Fellows may present their current research in a poster session to discuss their ideas with other Fellows as well as Facebook researchers. “It’s a great privilege where you meet all of the other Fellows and get a chance to network and hear great talks,” says Kartik, who attended the 2019 Fellowship Summit. “I was inspired by conversations I had with other Fellows about new ideas and possibilities for collaboration.”
Although the event won’t be held in person this year, the Fellows will still get a chance to connect with each other remotely. “In addition to the benefit of making new connections, the Fellowship also offers the recognition of winning a competitive fellowship and the independence to work on your own projects,” Kartik says.
To learn more about Kartik and his research, visit his webpage.
Teaching robots to identify objects by combining tactile sensors with computer vision
 Maria Bauza Villalonga is a PhD student in robotics at Massachusetts Institute of Technology, working with Professor Alberto Rodriguez. She received bachelor’s degrees in mathematics and in physics from Polytechnic University of Catalonia in Spain. Her research focuses on combining tactile and visual information to enhance robot dexterity during object manipulation.
“In industry automation, many processes involve picking up objects and performing tasks,” Maria explains. “While it’s trivial for a human to identify an object through touch, it requires a lot of intelligence for a robot to pick up an object from a bin and accurately localize it in order to perform the next task. There are many cases where industry cannot yet use robots because of this challenge.”
Maria’s goal is to improve a robot’s ability to accurately manipulate objects and perform tasks by combining computer vision with tactile sensing information. With her MIT-Princeton team, Maria won the Amazon Robotics Challenge stowing task in 2017 and received the Amazon Robotics Best Systems Paper Award in Manipulation in 2018. She explains that through this competition, they learned about the importance of tactile localization for a robot to be able to estimate where an object is.
In her research, the robot uses tactile sensors to scan and reason about the object it is touching and combines that with computer vision to accurately identify and localize objects. She is using tools that Facebook has developed for image recognition and segmentation in her research.
When she finishes her PhD, Maria plans to apply for a faculty position. She enjoys academia because she can think long-term and work on projects that could take years to accomplish, and explore her original ideas with her students. Learn more about Maria’s research on her website.
Advancing sustainable development with just design of human-centered AI and public policy
 Neil Gaikwad is a doctoral student in the MIT Media Lab at the Massachusetts Institute of Technology, working with Professor Danielle Wood. He specializes in human-centered machine learning and public policy for sustainable development. Neil develops data-driven human-AI collaboration algorithms and social computing systems, with a focus on increasing fairness and transparency in high-stakes policy decisions.
“Over the centuries, socio-technical systems such as market institutions and humanitarian systems have been instrumental in socioeconomic and environmental sustainability. However, lack of scientific understanding of underlying social and physical processes often leads to prejudiced policy decisions that harm vulnerable communities and hinder sustainable development,” Neil explains. “My research seeks to decode the fundamental nature of these processes on sustainability through the lens of human-centered machine learning, participatory design, and evidence-based policymaking.”
Neil became interested in the Fellowship because of the high-impact research of Facebook Core Data Science (CDS), which aligned with his research agenda. Neil and Facebook CDS have created the first workshop on Humanitarian Mapping at the ACM KDD conference. “The ongoing crisis of the COVID-19 pandemic exemplifies the criticality of the workshop. This initiative will create a framework for researchers to showcase how industry, academics, government research labs, and policymakers can work together to address humanitarian and sustainability challenges,” he says.
Neil is also a recipient of the Karl Taylor Compton Prize (MIT’s highest student award) and is an MIT Arts Scholar. He harnesses contemporary photography to communicate and advocate for science. “It’s hard to contextualize sustainability challenges such as climate change to a general audience merely through scientific models,” he says. “The arts play a vital role in helping people understand scientific underpinnings at subconscious levels and facilitate inclusive dialogues and engagement between diverse communities.”
After graduation, Neil plans to pursue a career in a line of academic research as a professor. “My major goal is to establish an informed research agenda at the boundaries of computational, design, and socioeconomic thinking, with students and global collaborators, to address the pressing sustainable development problems,” he says. For more information about Neil’s work, visit his webpage and arts portfolio.
The post Spotlight session with PhD students from the 2019 Facebook Fellowship cohort appeared first on Facebook Research.
Cynthia Breazeal named Media Lab associate director
Cynthia Breazeal has been promoted to full professor and named associate director of the Media Lab, joining the two other associate directors: Hiroshi Ishii and Andrew Lippman. Both appointments are effective July 1.
In her new associate director role, Breazeal will work with lab faculty and researchers to develop new strategic research initiatives. She will also play a key role in exploring new funding mechanisms to support broad Media Lab needs, including multi-faculty research efforts, collaborations with other labs and departments across the MIT campus, and experimental executive education opportunities.
“I am excited that Cynthia will be applying her tremendous energy, creativity, and intellect to rally the community in defining new opportunities for funding and research directions,” says Pattie Maes, chair of the lab’s executive committee. “As a first step, she has already organized a series of informal charrettes, where all members of the lab community can participate in brainstorming collaborations that range from tele-creativity, to resilient communities, to sustainability and climate change.”
Most recently, Breazeal has led an MIT collaboration between the Media Lab, MIT Stephen A. Schwarzman College of Computing, and MIT Open Learning to develop aieducation.mit.edu, an online learning site for grades K-12, which shares a variety of online activities for students to learn about artificial intelligence, with a focus on how to design and use AI responsibly.
While assuming these new responsibilities, Breazeal will continue to head the lab’s Personal Robots research group, which focuses on developing personal social robots and their potential for meaningful impact on everyday life — from educational aids for children, to pediatric use in hospitals, to at-home assistants for the elderly.
Breazeal is globally recognized as a pioneer in human-robot interaction. Her book, “Designing Sociable Robots” (MIT Press, 2002), is considered pivotal in launching the field. In 2019 she was named an AAAI fellow. Previously, she received numerous awards including the National Academy of Engineering’s Gilbreth Lecture Award and MIT Technology Review‘s TR100/35 Award. Her robot Jibo was on the cover of TIME magazine in its Best Inventions list of 2017, and in 2003 she was a finalist for the National Design Awards in Communications Design. In 2014, Fortune magazine recognized her as one of the Most Promising Women Entrepreneurs. The following year, she was named one of Entrepreneur magazine’s Women to Watch.
Breazeal earned a BS in electrical and computer engineering from the University of California at Santa Barbara, and MS and ScD degrees from MIT in electrical engineering and computer science.
CVPR 2020: Charlie Bell fireside chat
Watch the fireside chat featuring Charlie Bell, senior vice president of Amazon Web Services.Read More
Bringing the predictive power of artificial intelligence to health care
An important aspect of treating patients with conditions like diabetes and heart disease is helping them stay healthy outside of the hospital — before they to return to the doctor’s office with further complications.
But reaching the most vulnerable patients at the right time often has more to do with probabilities than clinical assessments. Artificial intelligence (AI) has the potential to help clinicians tackle these types of problems, by analyzing large datasets to identify the patients that would benefit most from preventative measures. However, leveraging AI has often required health care organizations to hire their own data scientists or settle for one-size-fits-all solutions that aren’t optimized for their patients.
Now the startup ClosedLoop.ai is helping health care organizations tap into the power of AI with a flexible analytics solution that lets hospitals quickly plug their data into machine learning models and get actionable results.
The platform is being used to help hospitals determine which patients are most likely to miss appointments, acquire infections like sepsis, benefit from periodic check ups, and more. Health insurers, in turn, are using ClosedLoop to make population-level predictions around things like patient readmissions and the onset or progression of chronic diseases.
“We built a health care data science platform that can take in whatever data an organization has, quickly build models that are specific to [their patients], and deploy those models,” says ClosedLoop co-founder and Chief Technology Officer Dave DeCaprio ’94. “Being able to take somebody’s data the way it lives in their system and convert that into a model that can be readily used is still a problem that requires a lot of [health care] domain knowledge, and that’s a lot of what we bring to the table.”
In light of the Covid-19 pandemic, ClosedLoop has also created a model that helps organizations identify the most vulnerable people in their region and prepare for patient surges. The open source tool, called the C-19 Index, has been used to connect high-risk patients with local resources and helped health care systems create risk scores for tens of millions of people overall.
The index is just the latest way that ClosedLoop is accelerating the health care industry’s adoption of AI to improve patient health, a goal DeCaprio has worked toward for the better part of his career.
Designing a strategy
After working as a software engineer for several private companies through the internet boom of the early 2000s, DeCaprio was looking to make a career change when he came across a project focused on genome annotation at the Broad Institute of MIT and Harvard.
The project was DeCaprio’s first professional exposure to the power of artificial intelligence. It blossomed into a six year stint at the Broad, after which he continued exploring the intersection of big data and health care.
“After a year in health care, I realized it was going to be really hard to do anything else,” DeCaprio says. “I’m not going to be able to get excited about selling ads on the internet or anything like that. Once you start dealing with human health, that other stuff just feels insignificant.”
In the course of his work, DeCaprio began noticing problems with the ways machine learning and other statistical techniques were making their way into health care, notably in the fact that predictive models were being applied without regard for hospitals’ patient populations.
“Someone would say, ‘I know how to predict diabetes’ or ‘I know how to predict readmissions,’ and they’d sell a model,” DeCaprio says. “I knew that wasn’t going to work, because the reason readmissions happen in a low-income population of New York City is very different from the reason readmissions happen in a retirement community in Florida. The important thing wasn’t to build one magic model but to build a system that can quickly take somebody’s data and train a model that’s specific for their problems.”
With that approach in mind, DeCaprio joined forces with former co-worker and serial entrepreneur Andrew Eye, and started ClosedLoop in 2017. The startup’s first project involved creating models that predicted patient health outcomes for the Medical Home Network (MHN), a not-for-profit hospital collaboration focused on improving care for Medicaid recipients in Chicago.
As the founders created their modeling platform, they had to address many of the most common obstacles that have slowed health care’s adoption of AI solutions.
Often the first problems startups run into is making their algorithms work with each health care system’s data. Hospitals vary in the type of data they collect on patients and the way they store that information in their system. Hospitals even store the same types of data in vastly different ways.
DeCaprio credits his team’s knowledge of the health care space with helping them craft a solution that allows customers to upload raw data sets into ClosedLoop’s platform and create things like patient risk scores with a few clicks.
Another limitation of AI in health care has been the difficulty of understanding how models get to results. With ClosedLoop’s models, users can see the biggest factors contributing to each prediction, giving them more confidence in each output.
Overall, to become ingrained in customer’s operations, the founders knew their analytics platform needed to give simple, actionable insights. That has translated into a system that generates lists, risk scores, and rankings that care managers can use when deciding which interventions are most urgent for which patients.
“When someone walks into the hospital, it’s already too late [to avoid costly treatments] in many cases,” DeCaprio says. “Most of your best opportunities to lower the cost of care come by keeping them out of the hospital in the first place.”
Customers like health insurers also use ClosedLoop’s platform to predict broader trends in disease risk, emergency room over-utilization, and fraud.
Stepping up for Covid-19
In March, ClosedLoop began exploring ways its platform could help hospitals prepare for and respond to Covid-19. The efforts culminated in a company hackathon over the weekend of March 16. By Monday, ClosedLoop had an open source model on GitHub that assigned Covid-19 risk scores to Medicare patients. By that Friday, it had been used to make predictions on more than 2 million patients.
Today, the model works with all patients, not just those on Medicare, and it has been used to assess the vulnerability of communities around the country. Care organizations have used the model to project patient surges and help individuals at the highest risk understand what they can do to prevent infection.
“Some of it is just reaching out to people who are socially isolated to see if there’s something they can do,” DeCaprio says. “Someone who is 85 years old and shut in may not know there’s a community based organization that will deliver them groceries.”
For DeCaprio, bringing the predictive power of AI to health care has been a rewarding, if humbling, experience.
“The magnitude of the problems are so large that no matter what impact you have, you don’t feel like you’ve moved the needle enough,” he says. “At the same time, every time an organization says, ‘This is the primary tool our care managers have been using to figure out who to reach out to,’ it feels great.”
Detecting fraud in heterogeneous networks using Amazon SageMaker and Deep Graph Library
Fraudulent users and malicious accounts can result in billions of dollars in lost revenue annually for businesses. Although many businesses use rule-based filters to prevent malicious activity in their systems, these filters are often brittle and may not capture the full range of malicious behavior.
However, some solutions, such as graph techniques, are especially suited for detecting fraudsters and malicious users. Fraudsters can evolve their behavior to fool rule-based systems or simple feature-based models, but it’s difficult to fake the graph structure and relationships between users and other entities captured in transaction or interaction logs. Graph neural networks (GNNs) combine information from the graph structure with attributes of users or transactions to learn meaningful representations that can distinguish malicious users and events from legitimate ones.
This post shows how to use Amazon SageMaker and Deep Graph Library (DGL) to train GNN models and detect malicious users or fraudulent transactions. Businesses looking for a fully-managed AWS AI service for fraud detection can also use Amazon Fraud Detector, which makes it easy to identify potentially fraudulent online activities, such as the creation of fake accounts or online payment fraud.
In this blog post, we focus on the data preprocessing and model training with Amazon SageMaker. To train the GNN model, you must first construct a heterogeneous graph using information from transaction tables or access logs. A heterogeneous graph is one that contains different types of nodes and edges. In the case where nodes represent users or transactions, the nodes can have several kinds of distinct relationships with other users and possibly other entities, such as device identifiers, institutions, applications, IP addresses and so on.
Some examples of use cases that fit under this include:
- A financial network where users transact with other users and specific financial institutions or applications
- A gaming network where users interact with other users but also with distinct games or devices
- A social network where users can have different types of links to other users
The following diagram illustrates a heterogeneous financial transaction network.

GNNs can incorporate user features like demographic information or transaction features like activity frequency. In other words, you can enrich the heterogeneous graph representation with features for nodes and edges as metadata. After the node and relations in the heterogeneous graph are established, with their associated features, you can train a GNN model to learn to classify different nodes as malicious or legitimate, using both the node or edge features as well as the graph structure. The model training is set up in a semi-supervised manner—you have a subset of nodes in the graph already labeled as fraudulent or legitimate. You use this labeled subset as a training signal to learn the parameters of the GNN. The trained GNN model can then predict the labels for the remaining unlabeled nodes in the graph.
Architecture
To get started, you can use the full solution architecture that uses Amazon SageMaker to run the processing jobs and training jobs. You can trigger the Amazon SageMaker jobs automatically with AWS Lambda functions that respond to Amazon Simple Storage Service (Amazon S3) put events, or manually by running cells in an example Amazon SageMaker notebook. The following diagram is a visual depiction of the architecture.

The full implementation is available on the GitHub repo with an AWS CloudFormation template that launches the architecture in your AWS account.
Data preprocessing for fraud detection with GNNs
In this section, we show how to preprocess an example dataset and identify the relations that will make up the heterogeneous graph.
Dataset
For this use case, we use the IEEE-CIS fraud dataset to benchmark the modeling approach. This is an anonymized dataset that contains 500 thousand transactions between users. The dataset has two main tables:
- Transactions table – Contains information about transactions or interactions between users
- Identity table – Contains information about access logs, device, and network information for users performing transactions
You use a subset of these transactions with their labels as a supervision signal for the model training. For the transactions in the test dataset, their labels are masked during training. The task is to predict which masked transactions are fraudulent and which are not.
The following code example gets the data and uploads it to an S3 bucket that Amazon SageMaker uses to access the dataset during preprocessing and training (run this in a Jupyter notebook cell):
# Replace with an S3 location or local path to point to your own dataset
raw_data_location = 's3://sagemaker-solutions-us-west-2/Fraud-detection-in-financial-networks/data'

bucket = 'SAGEMAKER_S3_BUCKET'
prefix = 'dgl'
input_data = 's3://{}/{}/raw-data'.format(bucket, prefix)

!aws s3 cp --recursive $raw_data_location $input_data

# Set S3 locations to store processed data for training and post-training results and artifacts respectively
train_data = 's3://{}/{}/processed-data'.format(bucket, prefix)
train_output = 's3://{}/{}/output'.format(bucket, prefix)
Despite the efforts of fraudsters to mask their behavior, fraudulent or malicious activities often have telltale signs like high out-degree or activity aggregation in the graph structure. The following sections show how to perform feature extraction and graph construction to allow the GNN models to take advantage of these patterns to predict fraud.
Feature extraction
Feature extraction consists of performing numerical encoding on categorical features and some transformation of numerical columns. For example, the transaction amounts are logarithmically transformed to indicate the relative magnitude of the amounts, and categorical attributes can be converted to numerical form by performing one hot encoding. For each transaction, the feature vector contains attributes from the transaction tables with information about the time delta between previous transactions, name and addresses matches, and match counts.
Constructing the graph
To construct the full interaction graph, split the relational information in the data into edge lists for each relation type. Each edge list is a bipartite graph between transaction nodes and other entity types. These entity types each constitute an identifying attribute about the transaction. For example, you can have an entity type for the kind of card (debit or credit) used in the transaction, the IP address of the device the transaction was completed with, and the device ID or operating system of the device used. The entity types used for graph construction consist of all the attributes in the identity table and a subset of attributes in the transactions table, like credit card information or email domain. The heterogeneous graph is constructed with the set of per relation type edge lists and the feature matrix for the nodes.
Using Amazon SageMaker Processing
You can execute the data preprocessing and feature extraction step using Amazon SageMaker Processing. Amazon SageMaker Processing is a feature of Amazon SageMaker that lets you run preprocessing and postprocessing workloads on fully managed infrastructure. For more information, see Process Data and Evaluate Models.
First define a container for the Amazon SageMaker Processing job to use. This container should contain all the dependencies that the data preprocessing script requires. Because the data preprocessing here only depends on the pandas library, you can have a minimal Dockerfile to define the container. See the following code:
FROM python:3.7-slim-buster

RUN pip3 install pandas==0.24.2
ENV PYTHONUNBUFFERED=TRUE

ENTRYPOINT ["python3"]
You can build the container and push the built container to an Amazon Elastic Container Registry (Amazon ECR) repository by entering the following of code:
import boto3

region = boto3.session.Session().region_name
account_id = boto3.client('sts').get_caller_identity().get('Account')
ecr_repository = 'sagemaker-preprocessing-container'
ecr_repository_uri = '{}.dkr.ecr.{}.amazonaws.com/{}:latest'.format(account_id, region, ecr_repository)

!bash data-preprocessing/container/build_and_push.sh $ecr_repository docker
When the data preprocessing container is ready, you can create an Amazon SageMaker ScriptProcessor that sets up a Processing job environment using the preprocessing container. You can then use the ScriptProcessor to run a Python script, which has the data preprocessing implementation, in the environment defined by the container. The Processing job terminates when the Python script execution is complete and the preprocessed data has been saved back to Amazon S3. This process is completely managed by Amazon SageMaker. When running the ScriptProcessor, you have the option of passing in arguments to the data preprocessing script. Specify what columns in the transaction table should be considered as identity columns and what columns are categorical features. All other columns are assumed to be numerical features. See the following code:
from sagemaker.processing import ScriptProcessor, ProcessingInput, ProcessingOutput

script_processor = ScriptProcessor(command=['python3'],
                                   image_uri=ecr_repository_uri,
                                   role=role,
                                   instance_count=1,
                                   instance_type='ml.r5.24xlarge')

script_processor.run(code='data-preprocessing/graph_data_preprocessor.py',
                     inputs=[ProcessingInput(source=input_data,
                                             destination='/opt/ml/processing/input')],
                     outputs=[ProcessingOutput(destination=train_data,
                                               source='/opt/ml/processing/output')],
                     arguments=['--id-cols', 'card1,card2,card3,card4,card5,card6,ProductCD,addr1,addr2,P_emaildomain,R_emaildomain',
                                '--cat-cols',' M1,M2,M3,M4,M5,M6,M7,M8,M9'])
The following code example shows the outputs of the Amazon SageMaker Processing job stored in Amazon S3:
from os import path
from sagemaker.s3 import S3Downloader
processed_files = S3Downloader.list(train_data)
print("===== Processed Files =====")
print('n'.join(processed_files))Output:

===== Processed Files =====
s3://graph-fraud-detection/dgl/processed-data/features.csv
s3://graph-fraud-detection/dgl/processed-data/relation_DeviceInfo_edgelist.csv
s3://graph-fraud-detection/dgl/processed-data/relation_DeviceType_edgelist.csv
s3://graph-fraud-detection/dgl/processed-data/relation_P_emaildomain_edgelist.csv
s3://graph-fraud-detection/dgl/processed-data/relation_ProductCD_edgelist.csv
s3://graph-fraud-detection/dgl/processed-data/relation_R_emaildomain_edgelist.csv
s3://graph-fraud-detection/dgl/processed-data/relation_TransactionID_edgelist.csv
s3://graph-fraud-detection/dgl/processed-data/relation_addr1_edgelist.csv
s3://graph-fraud-detection/dgl/processed-data/relation_addr2_edgelist.csv
s3://graph-fraud-detection/dgl/processed-data/relation_card1_edgelist.csv
s3://graph-fraud-detection/dgl/processed-data/relation_card2_edgelist.csv
s3://graph-fraud-detection/dgl/processed-data/relation_card3_edgelist.csv
s3://graph-fraud-detection/dgl/processed-data/relation_card4_edgelist.csv
s3://graph-fraud-detection/dgl/processed-data/relation_card5_edgelist.csv
s3://graph-fraud-detection/dgl/processed-data/relation_card6_edgelist.csv
s3://graph-fraud-detection/dgl/processed-data/relation_id_01_edgelist.csv
s3://graph-fraud-detection/dgl/processed-data/relation_id_02_edgelist.csv
s3://graph-fraud-detection/dgl/processed-data/relation_id_03_edgelist.csv
s3://graph-fraud-detection/dgl/processed-data/relation_id_04_edgelist.csv
s3://graph-fraud-detection/dgl/processed-data/relation_id_05_edgelist.csv
s3://graph-fraud-detection/dgl/processed-data/relation_id_06_edgelist.csv
s3://graph-fraud-detection/dgl/processed-data/relation_id_07_edgelist.csv
s3://graph-fraud-detection/dgl/processed-data/relation_id_08_edgelist.csv
s3://graph-fraud-detection/dgl/processed-data/relation_id_09_edgelist.csv
s3://graph-fraud-detection/dgl/processed-data/relation_id_10_edgelist.csv
s3://graph-fraud-detection/dgl/processed-data/relation_id_11_edgelist.csv
s3://graph-fraud-detection/dgl/processed-data/relation_id_12_edgelist.csv
s3://graph-fraud-detection/dgl/processed-data/relation_id_13_edgelist.csv
s3://graph-fraud-detection/dgl/processed-data/relation_id_14_edgelist.csv
s3://graph-fraud-detection/dgl/processed-data/relation_id_15_edgelist.csv
s3://graph-fraud-detection/dgl/processed-data/relation_id_16_edgelist.csv
s3://graph-fraud-detection/dgl/processed-data/relation_id_17_edgelist.csv
s3://graph-fraud-detection/dgl/processed-data/relation_id_18_edgelist.csv
s3://graph-fraud-detection/dgl/processed-data/relation_id_19_edgelist.csv
s3://graph-fraud-detection/dgl/processed-data/relation_id_20_edgelist.csv
s3://graph-fraud-detection/dgl/processed-data/relation_id_21_edgelist.csv
s3://graph-fraud-detection/dgl/processed-data/relation_id_22_edgelist.csv
s3://graph-fraud-detection/dgl/processed-data/relation_id_23_edgelist.csv
s3://graph-fraud-detection/dgl/processed-data/relation_id_24_edgelist.csv
s3://graph-fraud-detection/dgl/processed-data/relation_id_25_edgelist.csv
s3://graph-fraud-detection/dgl/processed-data/relation_id_26_edgelist.csv
s3://graph-fraud-detection/dgl/processed-data/relation_id_27_edgelist.csv
s3://graph-fraud-detection/dgl/processed-data/relation_id_28_edgelist.csv
s3://graph-fraud-detection/dgl/processed-data/relation_id_29_edgelist.csv
s3://graph-fraud-detection/dgl/processed-data/relation_id_30_edgelist.csv
s3://graph-fraud-detection/dgl/processed-data/relation_id_31_edgelist.csv
s3://graph-fraud-detection/dgl/processed-data/relation_id_32_edgelist.csv
s3://graph-fraud-detection/dgl/processed-data/relation_id_33_edgelist.csv
s3://graph-fraud-detection/dgl/processed-data/relation_id_34_edgelist.csv
s3://graph-fraud-detection/dgl/processed-data/relation_id_35_edgelist.csv
s3://graph-fraud-detection/dgl/processed-data/relation_id_36_edgelist.csv
s3://graph-fraud-detection/dgl/processed-data/relation_id_37_edgelist.csv
s3://graph-fraud-detection/dgl/processed-data/relation_id_38_edgelist.csv
s3://graph-fraud-detection/dgl/processed-data/tags.csv
s3://graph-fraud-detection/dgl/processed-data/test.csv
All the relation edgelist files represent the different kinds of edges used to construct the heterogenous graph during training. Features.csv contains the final transformed features of the transaction nodes, and tags.csv contains the labels of the nodes used as the training supervision signal. Test.csv contains the TransactionID data to use as a test dataset to evaluate the performance of the model. The labels for these nodes are masked during training.
GNN model training
Now you can use Deep Graph Library (DGL) to create the graph and define a GNN model, and use Amazon SageMaker to launch the infrastructure to train the GNN. Specifically, a relational graph convolutional neural network model can be used to learn embeddings for the nodes in the heterogeneous graph, and a fully connected layer for the final node classification.
Hyperparameters
To train the GNN, you need to define a few hyperparameters that are fixed before the training process, such as the kind of graph you’re constructing, the class of GNN models you’re using, the network architecture, and the optimizer and optimization parameters. See the following code:
edges = ",".join(map(lambda x: x.split("/")[-1], [file for file in processed_files if "relation" in file]))
params = {'nodes' : 'features.csv',
          'edges': 'relation*.csv',
          'labels': 'tags.csv',
          'model': 'rgcn',
          'num-gpus': 1,
          'batch-size': 10000,
          'embedding-size': 64,
          'n-neighbors': 1000,
          'n-layers': 2,
          'n-epochs': 10,
          'optimizer': 'adam',
          'lr': 1e-2
        }
The preceding code shows a few of the hyperparameters. For more information about all the hyperparameters and their default values, see estimator_fns.py in the GitHub repo.
Model training with Amazon SageMaker
With the hyperparameters defined, you can now kick off the training job. The training job uses DGL, with MXNet as the backend deep learning framework, to define and train the GNN. Amazon SageMaker makes it easy to train GNN models with the framework estimators, which have the deep learning framework environments already set up. For more information about training GNNs with DGL on Amazon SageMaker, see Train a Deep Graph Network.
You can now create an Amazon SageMaker MXNet estimator and pass in the model training script, hyperparameters, and the number and type of training instances you want. You can then call fit on the estimator and pass in the training data location in Amazon S3. See the following code:
from sagemaker.mxnet import MXNet

estimator = MXNet(entry_point='train_dgl_mxnet_entry_point.py',
                  source_dir='dgl-fraud-detection',
                  role=role,
                  train_instance_count=1,
                  train_instance_type='ml.p2.xlarge',
                  framework_version="1.6.0",
                  py_version='py3',
                  hyperparameters=params,
                  output_path=train_output,
                  code_location=train_output,
                  sagemaker_session=sess)

estimator.fit({'train': train_data})
Results
After training the GNN, the model learns to distinguish legitimate transactions from fraudulent ones. The training job produces a pred.csv file, which contains the model’s predictions for the transactions in test.csv. The ROC curve depicts the relationship between the true positive rate and the false positive rate at various thresholds, and the Area Under the Curve (AUC) can be used as an evaluation metric. The following graph shows that the GNN model we trained outperforms both fully connected feed forward networks and gradient boosted trees that use the features but don’t fully take advantage of the graph structure.

Conclusion
In this post, we showed how to construct a heterogeneous graph from user transactions and activity and use that graph and other collected features to train a GNN model to predict which transactions are fraudulent. This post also showed how to use DGL and Amazon SageMaker to define and train a GNN that achieves high performance on this task. For more information about the full implementation of the project and other GNN models for the task, see the GitHub repo.
Additionally, we showed how to perform data processing to extract useful features and relations from raw transaction data logs using Amazon SageMaker Processing. You can get started with the project by deploying the provided CloudFormation template and passing in your own dataset to detect malicious users and fraudulent transactions in your data.
About the Author
 Soji Adeshina is a Machine Learning Developer who works on developing deep learning based solutions for AWS customers. Currently, he’s working on graph learning with applications in financial services and advertising but he also has a background in computer vision and recommender systems. In his spare time, he likes to cook and read philosophical texts.