Image GPT

Image GPT

Image GPT

We find that, just as a large transformer model trained on language can generate coherent text, the same exact model trained on pixel sequences can generate coherent image completions and samples. By establishing a correlation between sample quality and image classification accuracy, we show that our best generative model also contains features competitive with top convolutional nets in the unsupervised setting.

CodeICML 2020 Paper (v1)Paper (v2)

Introduction

Unsupervised and self-supervised learning, or learning without human-labeled data, is a longstanding challenge of machine learning. Recently, it has seen incredible success in language, as transformer models like BERT, GPT-2, RoBERTa, T5, and other variants have achieved top performance on a wide array of language tasks. However, the same broad class of models has not been successful in producing strong features for image classification. Our work aims to understand and bridge this gap.

Transformer models like BERT and GPT-2 are domain agnostic, meaning that they can be directly applied to 1-D sequences of any form. When we train GPT-2 on images unrolled into long sequences of pixels, which we call iGPT, we find that the model appears to understand 2-D image characteristics such as object appearance and category. This is evidenced by the diverse range of coherent image samples it generates, even without the guidance of human provided labels. As further proof, features from the model achieve state-of-the-art performance on a number of classification datasets and near state-of-the-art unsupervised accuracy[1] on ImageNet.

Evaluation Dataset Our Result Best non-iGPT Result
Logistic regression on learned features (linear probe) CIFAR-10
96.3

iGPT-L 32×32 w/ 1536 features

95.3

SimCLR w/ 8192 features

CIFAR-100
82.8

iGPT-L 32×32 w/ 1536 features

80.2

SimCLR w/ 8192 features

STL-10
95.5

iGPT-L 32×32 w/ 1536 features

94.2

AMDIM w/ 8192 features

ImageNet
72.0

iGPT-XLa 64×64 w/ 15360 features

76.5

SimCLR w/ 8192 features

Full fine-tune CIFAR-10
99.0

iGPT-L 32×32, trained on ImageNet

99.0b

GPipe, trained on ImageNet

ImageNet 32×32
66.3

iGPT-L 32×32

70.2

Isometric Nets

  1. We only show ImageNet linear probe accuracy for iGPT-XL since other experiments did not finish before we needed to transition to different supercomputing facilities.
  2. Bit-L, trained on JFT (300M images with 18K classes), achieved a result of 99.3.

To highlight the potential of generative sequence modeling as a general purpose unsupervised learning algorithm, we deliberately use the same transformer architecture as GPT-2 in language. As a consequence, we require significantly more compute in order to produce features competitive with those from top unsupervised convolutional nets. However, our results suggest that when faced with a new domain where the correct model priors are unknown, a large GPT-2 can learn excellent features without the need for domain-specific architectural design choices.
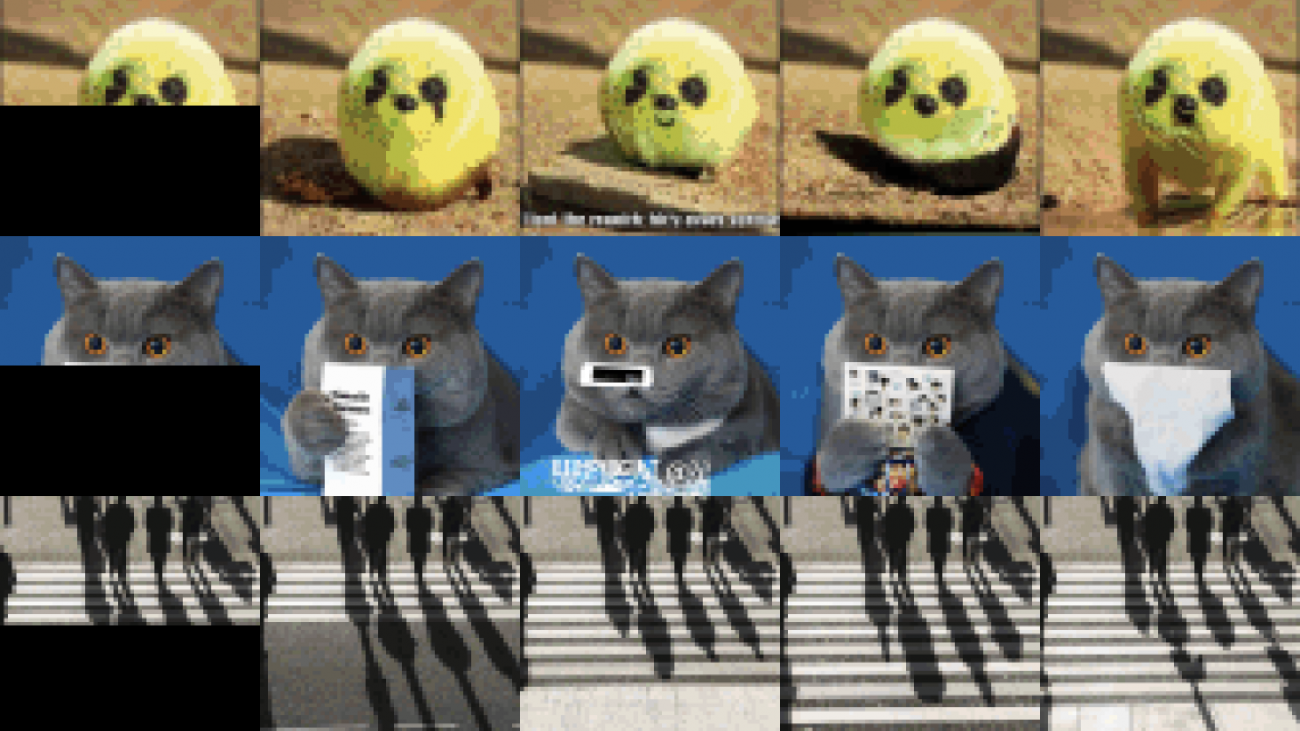
Completions

Favorites
Animals
Painted Landscapes
Sports
Architecture
ImageNet-R
Movie Posters
Famous Artworks
Popular Memes
Landscapes
Album Covers
Common English Words
US & State Flags
OpenAI Research Covers
OpenAI Pets
OpenAI Cooking

navigateleft
navigateright

Model Input

Completions right
Original

Image GPT
Image GPT
Image GPT
Image GPT
Image GPT
Image GPT

Image GPT
Image GPT
Image GPT
Image GPT
Image GPT
Image GPT

Image GPT
Image GPT
Image GPT
Image GPT
Image GPT
Image GPT

Image GPT
Image GPT
Image GPT
Image GPT
Image GPT
Image GPT

Image GPT
Image GPT
Image GPT
Image GPT
Image GPT
Image GPT

Image GPT
Image GPT
Image GPT
Image GPT
Image GPT
Image GPT

Image GPT
Image GPT
Image GPT
Image GPT
Image GPT
Image GPT

Image GPT
Image GPT
Image GPT
Image GPT
Image GPT
Image GPT

Model-generated completions of human-provided half-images. We sample the remaining halves with temperature 1 and without tricks like beam search or nucleus sampling. While we showcase our favorite completions in the first panel, we do not cherry-pick images or completions in all following panels.

Samples

Image GPT
Image GPT
Image GPT
Image GPT
Image GPT
Image GPT
Image GPT
Image GPT
Image GPT
Image GPT
Image GPT
Image GPT
Image GPT
Image GPT
Image GPT
Image GPT
Image GPT
Image GPT
Image GPT
Image GPT
Image GPT
Image GPT
Image GPT
Image GPT

Model-generated image samples. We sample these images with temperature 1 and without tricks like beam search or nucleus sampling. All of our samples are shown, with no cherry-picking. Nearly all generated images contain clearly recognizable objects.


From language GPT to image GPT

In language, unsupervised learning algorithms that rely on word prediction (like GPT-2 and BERT) have been extremely successful, achieving top performance on a wide array of language tasks. One possible reason for this success is that instances of downstream language tasks appear naturally in text: questions are often followed by answers (which could help with question-answering) and passages are often followed by summaries (which could help with summarization). In contrast, sequences of pixels do not clearly contain labels for the images they belong to.

Even without this explicit supervision, there is still a reason why GPT-2 on images might work: a sufficiently large transformer trained on next pixel prediction might eventually learn to generate diverse[2] samples with clearly recognizable objects. Once it learns to do so, an idea known as “Analysis by Synthesis”[3] suggests that the model will also know about object categories. Many early generative models were motivated by this idea, and more recently, BigBiGAN was an example which produced encouraging samples and features. In our work, we first show that better generative models achieve stronger classification performance. Then, through optimizing GPT-2 for generative capabilities, we achieve top-level classification performance in many settings, providing further evidence for analysis by synthesis.

Towards general unsupervised learning

Generative sequence modeling is a universal unsupervised learning algorithm: since all data types can be represented as sequences of bytes, a transformer can be directly applied to any data type without additional engineering. Our work tests the power of this generality by directly applying the architecture used to train GPT-2 on natural language to image generation. We deliberately chose to forgo hand coding any image specific knowledge in the form of convolutions or techniques like relative attention, sparse attention, and 2-D position embeddings.

As a consequence of its generality, our method requires significantly more compute to achieve competitive performance in the unsupervised setting. Indeed, contrastive methods are still the most computationally efficient methods for producing high quality features from images. However, in showing that an unsupervised transformer model is competitive with the best unsupervised convolutional nets, we provide evidence that it is possible to trade off hand coded domain knowledge for compute. In new domains, where there isn’t much knowledge to hand code, scaling compute seems an appropriate technique to test.

Approach

We train iGPT-S, iGPT-M, and iGPT-L, transformers containing 76M, 455M, and 1.4B parameters respectively, on ImageNet. We also train iGPT-XL[4], a 6.8 billion parameter transformer, on a mix of ImageNet and images from the web. Due to the large computational cost of modeling long sequences with dense attention, we train at the low resolutions of 32×32, 48×48, and 64×64.

While it is tempting to work at even lower resolutions to further reduce compute cost, prior work has demonstrated that human performance on image classification begins to drop rapidly below these sizes. Instead, motivated by early color display palettes, we create our own 9-bit color palette to represent pixels. Using this palette yields an input sequence length 3 times shorter than the standard (R, G, B) palette, while still encoding color faithfully.

Experimental results

There are two methods we use to assess model performance, both of which involve a downstream classification task. The first, which we refer to as a linear probe, uses the trained model to extract features[5] from the images in the downstream dataset, and then fits a logistic regression to the labels. The second method fine-tunes[6] the entire model on the downstream dataset.

Since next pixel prediction is not obviously relevant to image classification, features from the final layer may not be the most predictive of the object category. Our first result shows that feature quality is a sharply increasing, then mildly decreasing function of depth. This behavior suggests that a transformer generative model operates in two phases: in the first phase, each position gathers information from its surrounding context in order to build a contextualized image feature. In the second phase, this contextualized feature is used to solve the conditional next pixel prediction task. The observed two stage performance of our linear probes is reminiscent of another unsupervised neural net, the bottleneck autoencoder, which is manually designed so that features in the middle are used.

Feature quality depends heavily on the layer we choose to evaluate. In contrast with supervised models, the best features for these generative models lie in the middle of the network.

Our next result establishes the link between generative performance and feature quality. We find that both increasing the scale of our models and training for more iterations result in better generative performance, which directly translates into better feature quality.

Hover to see sample images up
Each line tracks a model throughout generative pre-training: the dotted markers denote checkpoints at steps 131K, 262K, 524K, and 1000K. The positive slopes suggest a link between improved generative performance and improved feature quality. Larger models also produce better features than smaller models. iGPT-XL is not included because it was trained on a different dataset.

When we evaluate our features using linear probes on CIFAR-10, CIFAR-100, and STL-10, we outperform features from all supervised and unsupervised transfer algorithms. Our results are also compelling in the full fine-tuning setting.

Pre-trained on ImageNet
Evaluation Model Accuracy w/o labels w/ labels
CIFAR-10
Linear Probe
ResNet-152 94.0 check
SimCLR 95.3 check
iGPT-L 32×32 96.3 check
CIFAR-100
Linear Probe
ResNet-152 78.0 check
SimCLR 80.2 check
iGPT-L 32×32 82.8 check
STL-10
Linear Probe
AMDIM-L 94.2 check
iGPT-L 32×32 95.5 check
CIFAR-10
Fine-tune
AutoAugment 98.5
SimCLR 98.6 check
GPipe 99.0 check
iGPT-L 99.0 check
CIFAR-100
Fine-tune
iGPT-L 88.5 check
SimCLR 89.0 check
AutoAugment 89.3
EfficientNet 91.7 check
A comparison of linear probe and fine-tune accuracies between our models and top performing models which utilize either unsupervised or supervised ImageNet transfer. We also include AutoAugment, the best performing model trained end-to-end on CIFAR.

Given the resurgence of interest in unsupervised and self-supervised learning on ImageNet, we also evaluate the performance of our models using linear probes on ImageNet. This is an especially difficult setting, as we do not train at the standard ImageNet input resolution. Nevertheless, a linear probe on the 1536 features from the best layer of iGPT-L trained on 48×48 images yields 65.2% top-1 accuracy, outperforming AlexNet.

Contrastive methods typically report their best results on 8192 features, so we would ideally evaluate iGPT with an embedding dimension of 8192 for comparison. However, training such a model is prohibitively expensive, so we instead concatenate features from multiple layers as an approximation. Unfortunately, our features tend to be correlated across layers, so we need more of them to be competitive. Taking 15360 features from 5 layers in iGPT-XL yields 72.0% top-1 accuracy, outperforming AMDIM, MoCo, and CPC v2, but still underperforming SimCLR by a decent margin.

Method Input Resolution Features Parameters Accuracy
Rotation original 8192 86M 55.4
iGPT-L 32×32 1536 1362M 60.3
BigBiGAN original 16384 86M 61.3
iGPT-L 48×48 1536 1362M 65.2
AMDIM original 8192 626M 68.1
MoCo original 8192 375M 68.6
iGPT-XL 64×64 3072 6801M 68.7
SimCLR original 2048 24M 69.3
CPC v2 original 4096 303M 71.5
iGPT-XL 64×64 3072 x 5 6801M 72.0
SimCLR original 8192 375M 76.5
A comparison of linear probe accuracies between our models and state-of-the-art self-supervised models. We achieve competitive performance while training at much lower input resolutions, though our method requires more parameters and compute.

Because masked language models like BERT have outperformed generative models on most language tasks, we also evaluate the performance of BERT on our image models. Instead of training our model to predict the next pixel given all preceding pixels, we mask out 15% of the pixels and train our model to predict them from the unmasked ones. We find that though linear probe performance on BERT models is significantly worse, they excel during fine-tuning:

CIFAR-10
ImageNet
Comparison of generative pre-training with BERT pre-training using iGPT-L at an input resolution of 322 × 3. Bold colors show the performance boost from ensembling BERT masks. We see that generative models produce much better features than BERT models after pre-training, but BERT models catch up after fine-tuning.

While unsupervised learning promises excellent features without the need for human-labeled data, significant recent progress has been made under the more forgiving framework of semi-supervised learning, which allows for limited amounts of human-labeled data. Successful semi-supervised methods often rely on clever techniques such as consistency regularization, data augmentation, or pseudo-labeling, and purely generative-based approaches have not been competitive for years. We evaluate iGPT-L[7] on a competitive benchmark for this sub-field and find that a simple linear probe on features from non-augmented images outperforms Mean Teacher and MixMatch, though it underperforms FixMatch.

Model 40 labels 250 labels 4000 labels
Improved GAN 81.4 ± 2.3
Mean Teacher 67.7 ± 2.3 90.8 ± 0.2
MixMatch 52.5 ± 11.5 89.0 ± 0.9 93.6 ± 0.1
iGPT-L 73.2 ± 01.5 87.6 ± 0.6 94.3 ± 0.1
UDA 71.0 ± 05.9 91.2 ± 1.1 95.1 ± 0.2
FixMatch RA 86.2 ± 03.4 94.9 ± 0.7 95.7 ± 0.1
FixMatch CTA 88.6 ± 03.4 94.9 ± 0.3 95.7 ± 0.2

A comparison of performance on low-data CIFAR-10. By leveraging many unlabeled ImageNet images, iGPT-L is able to outperform methods such as Mean Teacher and MixMatch but still underperforms the state of the art methods. Our approach to semi-supervised learning is very simple since we only fit a logistic regression classifier on iGPT-L’s features without any data augmentation or fine-tuning—a significant difference from specially designed semi-supervised approaches.

Limitations

While we have shown that iGPT is capable of learning powerful image features, there are still significant limitations to our approach. Because we use the generic sequence transformer used for GPT-2 in language, our method requires large amounts of compute: iGPT-L was trained for roughly 2500 V100-days while a similarly performing MoCo model can be trained in roughly 70 V100-days.

Relatedly, we model low resolution inputs using a transformer, while most self-supervised results use convolutional-based encoders which can easily consume inputs at high resolution. A new architecture, such as a domain-agnostic multiscale transformer, might be needed to scale further. Given these limitations, our work primarily serves as a proof-of-concept demonstration of the ability of large transformer-based language models to learn excellent unsupervised representations in novel domains, without the need for hardcoded domain knowledge. However, the significant resource cost to train these models and the greater accuracy of convolutional neural-network based methods precludes these representations from practical real-world applications in the vision domain.

Finally, generative models can exhibit biases that are a consequence of the data they’ve been trained on. Many of these biases are useful, like assuming that a combination of brown and green pixels represents a branch covered in leaves, then using this bias to continue the image. But some of these biases will be harmful, when considered through a lens of fairness and representation. For instance, if the model develops a visual notion of a scientist that skews male, then it might consistently complete images of scientists with male-presenting people, rather than a mix of genders. We expect that developers will need to pay increasing attention to the data that they feed into their systems and to better understand how it relates to biases in trained models.

Conclusion

We have shown that by trading off 2-D knowledge for scale and by choosing predictive features from the middle of the network, a sequence transformer can be competitive with top convolutional nets for unsupervised image classification. Notably, we achieved our results by directly applying the GPT-2 language model to image generation. Our results suggest that due to its simplicity and generality, a sequence transformer given sufficient compute might ultimately be an effective way to learn excellent features in many domains.

If you’re excited to work with us on this area of research, we’re hiring!

OpenAI

Detecting and visualizing telecom network outages from tweets with Amazon Comprehend

Detecting and visualizing telecom network outages from tweets with Amazon Comprehend

In today’s world, social media has become a place where customers share their experiences with services that they consume. Every telecom provider wants to have the ability to understand their customer pain points as soon as possible and to do this carriers frequently establish a social media team within their NOC (network operation center). This team manually reviews social media messages, such as tweets, trying to identify patterns of customer complaints or issues that might suggest that there is a specific problem in the carrier’s network .

Unhappy customers are more likely to change provider, so operators look to improve their customers’ experience and proactively approach dissatisfied customers who are reporting issues with their services .

Of course, social media operates at a vast scale and our telecom customers are telling us that trying to uncover customer issues from social media data manually is extremely challenging.

This post shows how to classify tweets in real time so telecom companies can identify outages and proactively engage with customers by using Amazon Comprehend custom multi-class classification.

Solution overview

Telecom customers not only post about outages on social media, but also comment on the service they get or compare the company to a competitor.

Your company can benefit from targeting those types of tweets separately. One option is customer feedback, in which care agents respond to the customer. For outages, you need to collect information and open a ticket in an external system so an engineer can specify the problem.

The solution for this post extends the AI-Driven Social Media Dashboard solution. The following diagram illustrates the solution architecture.

AI-Driven Social Media Dashboard Solutions Implementation architecture

This solution deploys an Amazon Elastic Compute Cloud (Amazon EC2) instance running in an Amazon Virtual Private Cloud (Amazon VPC) that ingests tweets from Twitter. An Amazon Kinesis Data Firehose delivery stream loads the streaming tweets into the raw prefix in the solution’s Amazon Simple Storage Service (Amazon S3) bucket. Amazon S3 invokes an AWS Lambda function to analyze the raw tweets using Amazon Translate to translate non-English tweets into English, and Amazon Comprehend to use natural-language-processing (NLP) to perform entity extraction and sentiment analysis.

A second Kinesis Data Firehose delivery stream loads the translated tweets and sentiment values into the sentiment prefix in the Amazon S3 bucket. A third delivery stream loads entities in the entities prefix using in the Amazon S3 bucket.

The solution also deploys a data lake that includes AWS Glue for data transformation, Amazon Athena for data analysis, and Amazon QuickSight for data visualization. AWS Glue Data Catalog contains a logical database which is used to organize the tables for the data on Amazon S3. Athena uses these table definitions to query the data stored on Amazon S3 and return the information to an Amazon QuickSight dashboard.

You can extend this solution by building Amazon Comprehend custom classification to detect outages, customer feedback, and comparisons to competitors.

Creating the dataset

The solution uses raw data from tweets. In the original solution, you deploy an AWS CloudFormation template that defines a comma-delimited list of terms for the solution to monitor. As an example, this post focuses on tweets that contain the word “BT” (BT Group in the UK), but equally this could be any network provider.

To get started, launch the AI-driven Social Media Dashboard solution. On the Specify Stack Details page, replace the default TwitterTermList with your terms. For this example, 'BT','bt'. After you click on Create Stack, wait 15 minutes for the deployment to complete. You will now begin capturing tweets.

For more information about available attributes and data types, see Appendix B: Auto-generated Data Model.

The tweet data is stored in Amazon Simple Storage Service (Amazon S3), which you can query with Amazon Athena. The following screenshot shows an example query.

SELECT id,text FROM "ai_driven_social_media_dashboard"."tweets" limit 10;

Because you captured every tweet that contains the keyword BT or bt, you have a lot of tweets that aren’t referring to British Telecom; for example, tweets that misspell the word “but.”

Additionally, the tweets in your dataset are global, but for this post, you want to focus on the United Kingdom, so the tweets are even more likely to refer to British Telecom (and therefore your dataset is more accurate). You can modify this solution for use cases in other countries, for example, defining the keyword as KPN and narrowing the dataset to focus only on the Netherlands.

In the existing solution, the coordinates and geo types look relevant, but those usually aren’t populated—tweets don’t include the poster’s location by default due to privacy requirements, unless the user allows it.

The user type contains relevant user data that comes from the user profile. You can use the location data from the user profile to narrow down tweets to your target country or region.

To look at the user type, you can use the Athena CREATE TABLE AS SELECT (CTAS) query. For more information, see Creating a Table from Query Results (CTAS). The following screenshot shows the Create table from query option in the Create drop-down menu.

SELECT text,user.location from tweets

You can create a table that consists of the tweet text and the user location, which gives you the ability to look only at tweets that originated in the UK. The following screenshot shows the query results.

SELECT * FROM "ai_driven_social_media_dashboard"."location_text_02"
WHERE location like '%UK%' or location like '%England%' or location like '%Scotland%' or location like '%Wales%'

Now that you have a dataset with your target location and tweet keywords, you can train your custom classifier.

Amazon Comprehend custom classification

You train your model in multi-class mode. For this post, you label three different classes:

  • Outage – People who are experiencing or reporting an outage in their provider network
  • Customer feedback – Feedback regarding the service they have received from the provider
  • Competition – Tweets about the competition and the provider itself

You can export the dataset from Athena and train it to use the custom classifier.

You first look at the dataset and start labeling the different tweets. Because you have a large number of tweets, it can take manual effort and perhaps several hours to review the data and label it. We recommend that you train the model with at least 50 documents per label.

In the dataset, customers reported an outage, which resulted in 71 documents with the outage label. Competition and customer feedback had under 50 labels.

After you gather sufficient data, you can always improve your accuracy by training a new model.

The following screenshot shows some of the entries in the final training CSV file.

As a future enhancement to remove the manual effort of labeling tweets, you can automate the process with Amazon SageMaker Ground Truth. Ground Truth offers easy access to labelers through Amazon Mechanical Turk and provides built-in workflows and interfaces for common labeling tasks.

When the labeling work is complete, upload the CSV file to your S3 bucket.

Now that the training data is in Amazon S3, you can train your custom classifier. Complete the following steps:

  1. On the Amazon Comprehend console, choose Custom classification.
  2. Choose Train classifier.
  3. For Name, enter a name for your classifier; for example, TweetsBT.
  4. For Classifier mode, select Using multi-class mode.
  5. For S3 location, enter the location of your CSV file.
  6. Choose Train classifier.

The status of the classifier changes from Submitted to Training. When the job is finished, the status changes to Trained.

After you train the custom classifier, you can analyze documents in either asynchronous or synchronous operations. You can analyze a large number of documents at the same time by using the asynchronous operation. The resulting analysis returns in a separate file. When you use the synchronous operation, you can only analyze a single document, but you can get results in real time.

For this use case, you want to analyze tweets in real time. When a tweet lands in Amazon S3 via Amazon Kinesis Data Firehose, it triggers an AWS Lambda function. The function triggers the custom classifier endpoint to run an analysis on the tweet and determine if it’s in regards to an outage, customer feedback, or referring to a competitor.

Testing the training data

After you train the model, Amazon Comprehend uses approximately 10% of the training documents to test the custom classifier model. Testing the model provides you with metrics that you can use to determine if the model is trained well enough for your purposes. These metrics are displayed in the Classifier performance section of the Classifier details page on the Amazon Comprehend console. See the following screenshot.

They’re also returned in the Metrics fields returned by the DescribeDocumentClassifier operation.

Creating an endpoint

To create an endpoint, complete the following steps:

  1. On the Amazon Comprehend console, choose Custom classification.
  2. From the Actions drop-down menu, choose Create endpoint.
  3. For Endpoint name, enter a name; for example, BTtweetsEndpoint.
  4. For Inference units¸ enter the number to assign to an endpoint.

Each unit represents a throughput of 100 characters per second for up to two documents per second. You can assign up to 10 inference units per endpoint. This post assigns 1.

  1. Choose Create endpoint.

When the endpoint is ready, the status changes to Ready.

Triggering the endpoint and customizing the existing Lambda function

You can use the existing Lambda function from the original solution and extend it to do the following:

  • Trigger the Amazon Comprehend custom classifier endpoint per tweet
  • Determine which class has the highest confidence score
  • Create an additional Firehose delivery stream so the results land back in Amazon S3

For more information about the original Lambda function, see the GitHub repo.

To make the necessary changes to the function, complete the following steps:

  1. On the Lambda console, select the function that contains the string Tweet-SocialMediaAnalyticsLambda.

Before you start adding code, make sure you understand how the function reads the tweets coming in, calls the Amazon Comprehend API, and stores the responses on a Firehose delivery stream so it writes the data to Amazon S3.

  1. Call the custom classifier endpoint (see the following code example).

The first two calls use the API on the tweet text to detect sentiment and entities; those both come out-of-the-box with the officinal solution.

The following code uses the ClassifyDocument API:

 sentiment_response = comprehend.detect_sentiment(
                    Text=comprehend_text,
                    LanguageCode='en'
                )
            #print(sentiment_response)
            
            entities_response = comprehend.detect_entities(
                    Text=comprehend_text,
                    LanguageCode='en'
                )
                
            #we will create a 'custom_response' using the ClassifyDocument API call
            custom_response = comprehend.classify_document(
                     #point to the relevant Custom classifier endpoint ARN
                     EndpointArn= "arn:aws:comprehend:us-east-1:12xxxxxxx91:document-classifier-endpoint/BTtweets-endpoint",
                     #this is where we use comprehend_text which is the original tweet text
                     Text=comprehend_text
                   
                )

The following code is the returned result:

{"File": "all_tweets.csv", "Line": "23", "Classes": [{"Name": "outage", "Score": 0.9985}, {"Name": "Competition", "Score": 0.0005}, {"Name": "Customer feedback", "Score": 0.0005}]}

You now need to iterate over to the array, which contains the classes and confidence scores. For more information, see DocumentClass.

Because you’re using the multi-class approach, you can pick the class with the highest score and add some simple code that iterates over the array and takes the biggest score and class.

You also take tweet[‘id’] because you can join it with the other tables that the solution generates to relate the results to the original tweet.

  1. Enter the following code:
    score=0
            for classs in custom_response['Classes']:
             if score<classs['Score']:
                 score=classs['Score']
                 custom_record = {
                    
                    'tweetid': tweet['id'],
                    'classname':classs['Name'],
                    'classscore':classs['Score']
                 }

After you create the custom_record, you can decide if you want to define a certain threshold for your class score (the level of confidence for the results you want to store in Amazon S3). For this use case, you choose to only define classes with a confidence score of at least 70%.

To put the result on a Firehose delivery stream (which you need to create in advance), use the PutRecord API. See the following code:

if custom_record['classscore']>0.7:
         print('we are in')
         response = firehose.put_record(
                        DeliveryStreamName=os.environ['CUSTOM_STREAM'],
                        Record={
                            'Data': json.dumps(custom_record) + 'n'
                        }
                    )

You now have a dataset in Amazon S3 based on your Amazon Comprehend custom classifier output.

Exploring the output

You can now explore the output from your custom classifier in Athena. Complete the following steps:

  1. On the Athena console, run a SELECT query to see the following:
    1. tweetid – You can use this to join the original tweet table to get the tweet text and additional attributes.
    2. classname – This is the class that the custom classifier identified the tweet as with the highest level of confidence.
    3. classscore – This is the level of confidence.
    4. Stream partitions – These help you know the time when the data was written to Amazon S3:
      1. Partition_0 (month)
      2. Partition_1 (day)
      3. Partition_2 (hour)

The following screenshot shows your query results.

SELECT * FROM "ai_driven_social_media_dashboard"."custom2020" where classscore>0.7 limit 10;

  1. Join your table using the tweetid with the following:
    1. The original tweet table to get the actual tweet text.
    2. A sentiment table that Amazon Comprehend generated in the original solution.

The following screenshot shows your results. One of the tweets contains negative feedback, and other tweets identify potential outages.

SELECT classname,classscore,tweets.text,sentiment FROM "ai_driven_social_media_dashboard"."custom2020"
left outer join tweets on custom2020.tweetid=tweets.id 
left outer join tweet_sentiments on custom2020.tweetid=tweet_sentiments.tweetid
where classscore>0.7 
limit 10;

Preparing the data for visualization

To prepare the data for visualization, first create a timestamp field by concatenating the partition fields.

You can use timestamp field for various visualizations, such as outages in a certain period or customer feedback on a specific day. To do so, use AWS Glue notebooks and write a piece of code in PySpark.

You can use the PySpark code to not only prepare your data but also transform the data from CSV to Apache Parquet format. For more information, see the GitHub repo.

You should now have a new dataset that contains a timestamp field in Parquet format, which is more efficient and cost-effective to query.

For this use case, you can determine the outages reported on a map using geospacial charts in Amazon QuickSight. To get the location of the tweet, you can use the following:

  • Longitude and latitude coordinates in the original tweets dataset. Unfortunately, coordinates aren’t usually present due to privacy defaults.
  • Amazon Comprehend entity dataset, which can identify locations as entities within the tweet text.

For this use case, you can create a new dataset combining the tweets, custom2020 (your new dataset based on the custom classifier output, and tweetsEntities datasets.

The following screenshot shows the query results, which returned tweets with locations that also identify outages.

SELECT distinct classname,final,text,entity FROM "ai_driven_social_media_dashb
oard"."custom2020"."quicksight_with_lat_lang"
where type='LOCATION' and classname='outage'
order by final asc 

You have successfully identified outages in a specific window and determined their location.

To get the geolocation of a specific location, you could choose from a variety of publicly available datasets to upload to Amazon S3 and join with your data. This post uses the World Cities Database, which has a free option. You can join it with your existing data to get the location coordinates.

Visualizing outage locations in Amazon QuickSight

To visualize your outage locations in Amazon QuickSight, complete the following steps:

  1. To add the dataset you created in Athena, on the Amazon QuickSight console, choose Manage data.
  2. Choose New dataset.
  3. Choose Athena.
  4. Select your database or table.
  5. Choose Save & Visualize.
  6. Under Visual types, choose the Points on map
  7. Drag the lng and lat fields to the field wells.

The following screenshot shows the outages on a UK map.

To see the text of a specific tweet, hover over one of the dots on the map.

You have many different options when analyzing your data and can further enhance this solution. For example, you can enrich your dataset with potential contributors and drill down on a specific outage location for more details.

Conclusion

We have now the ability to detect outages which customers are reporting upon, we can also leverage the solution to look on customer feedback and competition. We are now able to identify key trends on the social media at scale. In the blog post we have showed an example which is relevant for telecom companies, but this solution can be customized and leveraged by every company that has customers using the social media.

In the near feature, we would like to extend this solution, and create an end to end flow , where the customer reporting an outage ,will automatically receive a reply in tweeter from an Amazon Lex chat bot, which can ask for more information from the customer who complained via a secured channel and send this info to a call center agent via an integration with Amazon Connect or create a ticket in an external ticket system for an engineer to work on the problem .

Give the solution a try, see if you can extend it further, and share your feedback and questions in the comments.


About the Author

Guy Ben-Baruch is a Senior solution architect in the news & communications team in AWS UKIR. Since Guy joined AWS in March 2016, he has worked closely with enterprise customers, focusing on the telecom vertical, supporting their digital transformation and their cloud adoption. Outside of work, Guy likes doing BBQ and playing football with his kids in the park when the British weather allows it.


Read More

Amazon Polly launches a child US English NTTS voice

Amazon Polly launches a child US English NTTS voice

Amazon Polly turns text into lifelike speech, allowing you to create voice-enabled applications. We’re excited to announce the general availability of a new US English child voice—Kevin. Kevin’s voice was developed using the latest Neural Text-to-Speech (NTTS) technology, making it sound natural and human-like. This voice imitates the voice of a male child. Have a listen to the Kevin voice:

Kevin sample 1

Listen now

Voiced by Amazon Polly

Kevin sample 2

Listen now

Voiced by Amazon Polly

Amazon Polly has 14 neural voices to choose from:

  • US English (en-US): Ivy, Joey, Justin, Kendra, Kevin, Kimberly, Joanna, Matthew, Salli
  • British English (en-GB): Amy, Brian, Emma
  • Brazilian Portuguese (pt-BR): Camila
  • US Spanish (es-US): Lupe

Neural voices are supported in the following Regions:

  • US East (N. Virginia)
  • US West (Oregon)
  • Asia Pacific (Sydney)
  • EU (Ireland)

For the full list of text-to-speech voices, see Voices in Amazon Polly.

Our customers are using Amazon Polly voices to build new categories of speech-enabled products, including (but not limited to) voicing news content, games, eLearning platforms, telephony applications, accessibility applications, and Internet of Things (IoT). Amazon Polly voices are high quality, cost-effective, and ensure fast responses, which makes it a viable option for low-latency use cases. Amazon Polly also supports SSML tags, which give you additional control over speech output.

For more information, see What Is Amazon Polly? and log in to the Amazon Polly console to try it out!


About the Author

Ankit Dhawan is a Senior Product Manager for Amazon Polly, technology enthusiast, and huge Liverpool FC fan. When not working on delighting our customers, you will find him exploring the Pacific Northwest with his wife and dog. He is an eternal optimist, and loves reading biographies and playing poker. You can indulge him in a conversation on technology, entrepreneurship, or soccer any time of the day.


Read More

Machine Learning-based Damage Assessment for Disaster Relief

Machine Learning-based Damage Assessment for Disaster Relief

Posted by Joseph Xu, Senior Software Engineer and Pranav Khaitan, Engineering Lead, Google Research

Natural disasters, such as earthquakes, hurricanes, and floods, affect large areas and millions of people, but responding to such disasters is a massive logistical challenge. Crisis responders, including governments, NGOs, and UN organizations, need fast access to comprehensive and accurate assessments in the aftermath of disasters to plan how best to allocate limited resources.To this end, very high resolution (VHR) satellite imagery, with up to 0.3 meter resolution, is becoming an increasingly important tool for crisis response, giving responders an unprecedented breadth of visual information about how terrain, infrastructure, and populations are changed by disasters.

However, intensive manual labor is still required to extract operationally-relevant information — collapsed buildings, cracks in bridges, where people have set up temporary shelters — from the raw satellite imagery. As an example, for the 2010 Haiti earthquake, analysts manually examined over 90,000 buildings in the Port-au-Prince area alone, rating the damage each one incurred on a five point scale. Many of these manual analyses take teams of experts many weeks to complete, whereas they are most needed within 48-72 hours after the disaster, when the most urgent decisions are made.

To help mitigate the impact of such disasters, we present “Building Damage Detection in Satellite Imagery Using Convolutional Neural Networks“, which details a machine learning (ML) approach to automatically process satellite data to generate building damage assessments. Developed in partnership with the United Nations World Food Program (WFP) Innovation Accelerator, we believe this work has the potential to drastically reduce the time and effort required for crisis workers to produce damage assessment reports. In turn, this would reduce the turnaround times needed to deliver timely disaster aid to the most severely affected areas, while increasing the overall coverage of such critical services.

The Approach
The automatic damage assessment process is split into two steps: building detection and damage classification. In the building detection step, our approach uses an object detection model to draw bounding boxes around each building in the image. We then extract pre-disaster and post-disaster images centered on each detected building and use a classification model to determine whether the building is damaged.

The classification model consists of a convolutional neural network to which is input two 161 pixel x 161 pixel RGB images, corresponding to a 50 m x 50 m ground footprint, centered on a given building. One image is from before the disaster event, and the other image is from after the disaster event. The model analyzes differences in the two images and outputs a score from 0.0 to 1.0, where 0.0 means the building was not damaged, and 1.0 means the building was damaged.

Because the before and after images are taken on different dates, at different times of day, and in some cases by different satellites altogether, there can be a host of different problems that arise. For example, the brightness, contrast, color saturation, and lighting conditions of the images may differ significantly, and the pixels in the image may be misaligned.

To correct for differences in color and illumination, we use histogram equalization to normalize the colors in the before and after images. We also make the model more robust to insignificant color differences by using standard data augmentation techniques, such as randomly perturbing the contrast and saturation of the images, during training.

Training Data
One of the main challenges of this work is assembling a training data set. Data availability in this application is inherently limited because there are only a handful of disasters that have high resolution satellite images and an even smaller number that have existing damage assessments. For labels, we use publicly available damage assessments manually generated by humanitarian organizations operating in this space, such as UNOSAT and REACH. We obtain the original satellite images on which the manual assessments are performed and then use Google Earth Engine to spatially join the damage assessment labels with the satellite images in order to produce the final training examples. All images used to train the model were sourced from commercially available sources.

Examples of individual image patches that capture before and after images of damaged and undamaged buildings from different disasters.

Results
We evaluated this technology for 3 major past earthquakes: the 2010 earthquake in Haiti (magnitude 7.0), the 2017 event in Mexico City (magnitude 7.1), and the series of earthquakes occuring in Indonesia in 2018 (magnitudes 5.9 – 7.5). For each event, we trained the model on buildings in one part of the region affected by the quake and tested it on buildings in another part of the region. We used human expert damage assessments performed by UNOSAT and REACH as the ground truth for evaluation. We measure the model’s quality using both true accuracy (compared to expert assessment) and the area under the ROC curve (AUROC), which captures the trade-off between the model’s true positive and false positive rates of detection, and is a common way to measure quality when the number of positive and negative examples in the test dataset is imbalanced. An AUROC value of 0.5 means that the model’s predictions are random, while a value of 1.0 means the model is perfectly accurate. According to crisis responder feedback, 70% accuracy is the threshold needed for making high-level decisions in the first 72 hours after the disaster.

Area under the
Event Accuracy ROC curve
2010 Haiti earthquake 77% 0.83
2017 Mexico City earthquake 71% 0.79
2018 Indonesia earthquake 78% 0.86
Evaluation of model predictions against human expert assessments (higher is better).
Example model predictions from the 2010 Haiti earthquake. Prediction values closer to 1.0 means the model is more confident that the building is damaged. Values closer to 0.0 means the building is not damaged. A threshold value of 0.5 is typically used to distinguish between damaged/undamaged predictions, but this can be tuned to make the predictions more or less sensitive.

Future Work
While the current model works reasonably well when trained and tested on buildings from the same regions (e.g., same city or country), the ultimate goal is to have a model that can accurately assess building damage for disasters that happen anywhere in the world, and not just those that look similar to the ones the model has been trained on. This is challenging because the variety of the available training data for past disasters is inherently limited to a handful of events that occurred in a few geographic locations. Generalizing to future disasters that will likely occur in new locations is therefore still a challenge for our model and is the focus of ongoing work. We envision a system that can be interactively trained, validated, and deployed by expert analysts so that important aid distribution decisions are always verified by experienced crisis responders. Our hope is that this technology can help communities get the aid that they need in times of most critical need in a timely fashion.

Acknowledgements
This post reflects the work of our co-authors Wenhan Lu and Zebo Li. We would also like to thank Maolin Zuo for his contributions to the project. In tackling this problem, we have had a very productive partnership with the United Nations World Food Programme (WFP) Innovation Accelerator, an organization that identifies, funds, and supports startups and innovative projects to disrupt world hunger.

A competition to identify bird calls using machine learning

A competition to identify bird calls using machine learning

Do you hear the birds chirping outside your window? There are more than 10,000 bird species in the world, and they can be found in nearly every environment, from untouched rainforests to suburbs and cities. Birds play an essential role in nature. They are high up in the food chain and integrate changes occurring at low levels. As such, birds are excellent indicators of deteriorating habitat quality and environmental pollution. However, it’s often easier to hear birds than see them. With proper sound detection and classification, researchers could automatically intuit factors about an area’s quality of life based on a changing bird population.

There are already many projects underway to extensively monitor birds by recording natural soundscapes over long periods. However the analysis of these datasets is often done manually, is painstakingly slow, and results are incomplete. Data science may be able to assist, so researchers have turned to large crowdsourced databases of vocal recordings of birds to train AI models.

To fully take advantage of these extensive and information-rich sound archives, researchers need good machine listeners to reliably extract as much information as possible to aid data-driven conservation.

In partnership with the Cornell Lab of Ornithology, Google’s bioacoustics team—part of ourAI for Social Good initiative—is announcing a competition to use machine learning to identify bird calls. In this competition, data scientists will identify a wide variety of bird vocalizations in soundscape recordings. Training audio comes from the Xeno-Canto project, a crowd-sourced collection of thousands of hours of bird sounds from around the world. We’re offering $25,000 in prizes for the best entries, and hosting the competition on Kaggle, the world’s largest data science competition community with more than 4 million members from 194 countries. The competition kicks off today and will last until September 2—check out the competition page for more details.

If successful, winners of this competition will help researchers better understand changes in habitat quality, levels of pollution, and the effectiveness of restoration efforts. The eventual conservation outcomes could greatly improve the quality of life for many living organisms—birds and human beings included.

Attribution for image at the top of the post: Red-winged Blackbird © Drew Weber / Macaulay Library at the Cornell Lab of Ornithology (ML227768151)

Read More

How The Trevor Project is using AI to help prevent suicide

How The Trevor Project is using AI to help prevent suicide

Suicide disproportionately affects LGBTQ+ youth. In the U.S. alone, more than 1.8 million LGBTQ+ youth between the ages of 13 and 24 seriously consider suicide or experience a significant crisis each year. Additionally, LGBTQ+ youth are over four times more likely to attempt suicide than their peers, while up to 50 percent of all trans people have made a suicide attempt—most before the age of 25. Black LGBTQ+ young people are even more impacted as they hold multiple marginalized identities, and research shows that Black youth ages five to 12 are dying by suicide at roughly twice the rate of their white peers. 

To support this particularly vulnerable and diverse community, The Trevor Project takes an intersectional approach to crisis intervention and suicide prevention. The organization offers free and confidential crisis services that they provide 24/7 via phone, chat, and text. In this time of emotional stress, isolation and civil unrest, these services offer much needed support to LGBTQ youth experiencing fear, hopelessness, confusion, and race-based trauma. Sadly, the volume of callers sometimes outnumbers the available crisis counselors who are trained to assist. With support from Google.org, The Trevor Project is incorporating artificial intelligence into its crisis services to connect more people to the resources they need.  

Last year, Google.org provided The Trevor Project with $1.5 million and 11 Googlers from the Google.org Fellowship, a pro-bono program that matches teams of Googlers with Google.org grantees and civic entities for up to six months to work full-time on technical projects. Google.org Fellows assisted The Trevor Project in building an artificial intelligence system that could identify and prioritize high-risk contacts while simultaneously reaching more people. 

Here’s how it works. When someone first contacts The Trevor Project, they’re asked a few intake questions like: “What’s going on?” After that, they talk to a crisis counselor who assesses their risk using a clinical assessment model. Looking at anonymized historical data, the team used natural language processing (NLP) to train the system to learn which types of responses on the intake form were most likely linked to a particular diagnosis risk level. While some specific words or phrases are known to correlate with high risk, the NLP model interprets the entire sentence to determine risk level. Now if a person is identified as a high or imminent risk based on their initial intake questions, they are automatically placed in a priority queue and connected to a counselor sooner. 

To help accelerate this work, Google.org has committed an additional $1.2 million in grant funding and is planning to engage a new cohort of Google.org Fellows set to start in July to expand Trevor’s application of NLP to new contexts. This will include developing a conversation simulator to enhance and scale Trevor’s virtual counselor training program, and automating the moderation of TrevorSpace, the organization’s affirming international online community, to flag and address unsafe content. At the same time, Google.org is partnering with Google’s LGBTQ+ employee groups to build a pool of volunteer digital crisis counselors to help respond to Trevor’s increased need for crisis services due to COVID-19 impacts. More than fifty Googlers have signed up already. 

The Trevor Project is the world’s largest suicide prevention and crisis intervention organization for LGBTQ+ youth. We’re honored to support their critical mission and stand with LGBTQ+ people of color, trans and non-binary communities, LGBTQ+ families, and so many more

Read More

Google at CVPR 2020

Google at CVPR 2020

Posted by Emily Knapp, Program Manager and Benjamin Hütteroth, Program Specialist

This week marks the start of the fully virtual 2020 Conference on Computer Vision and Pattern Recognition (CVPR 2020), the premier annual computer vision event consisting of the main conference, workshops and tutorials. As a leader in computer vision research and a Supporter Level Virtual Sponsor, Google will have a strong presence at CVPR 2020, with nearly 70 publications accepted, along with the organization of, and participation in, multiple workshops/tutorials.

If you are participating in CVPR this year, please visit our virtual booth to learn about what Google is actively pursuing for the next generation of intelligent systems that utilize the latest machine learning techniques applied to various areas of machine perception.

You can also learn more about our research being presented at CVPR 2020 in the list below (Google affiliations are bolded).

Organizing Committee

General Chairs: Terry Boult, Gerard Medioni, Ramin Zabih
Program Chairs: Ce Liu, Greg Mori, Kate Saenko, Silvio Savarese
Workshop Chairs: Tal Hassner, Tali Dekel
Website Chairs: Tianfan Xue, Tian Lan
Technical Chair: Daniel Vlasic
Area Chairs include: Alexander Toshev, Alexey Dosovitskiy, Boqing Gong, Caroline Pantofaru, Chen Sun, Deqing Sun, Dilip Krishnan, Feng Yang, Liang-Chieh Chen, Michael Rubinstein, Rodrigo Benenson, Timnit Gebru, Thomas Funkhouser, Varun Jampani, Vittorio Ferrari, William Freeman

Oral Presentations

Evolving Losses for Unsupervised Video Representation Learning
AJ Piergiovanni, Anelia Angelova, Michael Ryoo

CvxNet: Learnable Convex Decomposition
Boyang Deng, Kyle Genova, Soroosh Yazdani, Sofien Bouaziz, Geoffrey Hinton, Andrea Tagliasacchi

Neural SDE: Stabilizing Neural ODE Networks with Stochastic Noise
Xuanqing Liu, Tesi Xiao, Si Si, Qin Cao, Sanjiv Kumar, Cho-Jui Hsieh

Scalability in Perception for Autonomous Driving: Waymo Open Dataset
Pei Sun, Henrik Kretzschmar, Xerxes Dotiwalla‎, Aurélien Chouard, Vijaysai Patnaik, Paul Tsui, James Guo, Yin Zhou, Yuning Chai, Benjamin Caine, Vijay Vasudevan, Wei Han, Jiquan Ngiam, Hang Zhao, Aleksei Timofeev‎, Scott Ettinger, Maxim Krivokon, Amy Gao, Aditya Joshi‎, Sheng Zhao, Shuyang Chen, Yu Zhang, Jon Shlens, Zhifeng Chen, Dragomir Anguelov

Deep Implicit Volume Compression
Saurabh Singh, Danhang Tang, Cem Keskin, Philip Chou, Christian Haene, Mingsong Dou, Sean Fanello, Jonathan Taylor, Andrea Tagliasacchi, Philip Davidson, Yinda Zhang, Onur Guleryuz, Shahram Izadi, Sofien Bouaziz

Neural Networks Are More Productive Teachers Than Human Raters: Active Mixup for Data-Efficient Knowledge Distillation from a Blackbox Model
Dongdong Wan, Yandong Li, Liqiang Wang, and Boqing Gong

Google Landmarks Dataset v2 – A Large-Scale Benchmark for Instance-Level Recognition and Retrieval (see the blog post)
Tobias Weyand, Andre Araujo, Jack Sim, Bingyi Cao

CycleISP: Real Image Restoration via Improved Data Synthesis
Syed Waqas Zamir, Aditya Arora, Salman Khan, Munawar Hayat, Fahad Shahbaz Khan, Ming-Hsuan Yang, Ling Shao

Dynamic Graph Message Passing Networks
Li Zhang, Dan Xu, Anurag Arnab, Philip Torr

Local Deep Implicit Functions for 3D Shape
Kyle Genova, Forrester Cole, Avneesh Sud, Aaron Sarna, Thomas Funkhouser

GHUM & GHUML: Generative 3D Human Shape and Articulated Pose Models
Hongyi Xu, Eduard Gabriel Bazavan, Andrei Zanfir, William Freeman, Rahul Sukthankar, Cristian Sminchisescu

Search to Distill: Pearls are Everywhere but not the Eyes
Yu Liu, Xuhui Jia, Mingxing Tan, Raviteja Vemulapalli, Yukun Zhu, Bradley Green, Xiaogang Wang

Semantic Pyramid for Image Generation
Assaf Shocher, Yossi Gandelsman, Inbar Mosseri, Michal Yarom, Michal Irani, William Freeman, Tali Dekel

Flow Contrastive Estimation of Energy-Based Models
Ruiqi Gao, Erik Nijkamp, Diederik Kingma, Zhen Xu, Andrew Dai, Ying Nian Wu

Rethinking Class-Balanced Methods for Long-Tailed Visual Recognition from A Domain Adaptation Perspective
Muhammad Abdullah Jamal, Matthew Brown, Ming-Hsuan Yang, Liqiang Wang, Boqing Gong

Category-Level Articulated Object Pose Estimation
Xiaolong Li, He Wang, Li Yi, Leonidas Guibas, Amos Abbott, Shuran Song

AdaCoSeg: Adaptive Shape Co-Segmentation with Group Consistency Loss
Chenyang Zhu, Kai Xu, Siddhartha Chaudhuri, Li Yi, Leonidas Guibas, Hao Zhang

SpeedNet: Learning the Speediness in Videos
Sagie Benaim, Ariel Ephrat, Oran Lang, Inbar Mosseri, William Freeman, Michael Rubinstein, Michal Irani, Tali Dekel

BSP-Net: Generating Compact Meshes via Binary Space Partitioning
Zhiqin Chen, Andrea Tagliasacchi, Hao Zhang

SAPIEN: A SimulAted Part-based Interactive ENvironment
Fanbo Xiang, Yuzhe Qin, Kaichun Mo, Yikuan Xia, Hao Zhu, Fangchen Liu, Minghua Liu, Hanxiao Jiang, Yifu Yuan, He Wang, Li Yi, Angel Chang, Leonidas Guibas, Hao Su

SurfelGAN: Synthesizing Realistic Sensor Data for Autonomous Driving
Zhenpei Yang, Yuning Chai, Dragomir Anguelov, Yin Zhou, Pei Sun, Dumitru Erhan, Sean Rafferty, Henrik Kretzschmar

Filter Response Normalization Layer: Eliminating Batch Dependence in the Training of Deep Neural Networks
Saurabh Singh, Shankar Krishnan

RL-CycleGAN: Reinforcement Learning Aware Simulation-To-Real
Kanishka Rao, Chris Harris, Alex Irpan, Sergey Levine, Julian Ibarz, Mohi Khansari

Open Compound Domain Adaptation
Ziwei Liu, Zhongqi Miao, Xingang Pan, Xiaohang Zhan, Dahua Lin, Stella X.Yu, and Boqing Gong

Posters
Single-view view synthesis with multiplane images
Richard Tucker, Noah Snavely

Adversarial Examples Improve Image Recognition
Cihang Xie, Mingxing Tan, Boqing Gong, Jiang Wang, Alan Yuille, Quoc V. Le

Adversarial Texture Optimization from RGB-D Scans
Jingwei Huang, Justus Thies, Angela Dai, Abhijit Kundu, Chiyu “Max” Jiang,Leonidas Guibas, Matthias Niessner, Thomas Funkhouser

Single-Image HDR Reconstruction by Learning to Reverse the Camera Pipeline
Yu-Lun Liu, Wei-Sheng Lai, Yu-Sheng Chen, Yi-Lung Kao, Ming-Hsuan Yang,Yung-Yu Chuang, Jia-Bin Huang

Collaborative Distillation for Ultra-Resolution Universal Style Transfer
Huan Wang, Yijun Li, Yuehai Wang, Haoji Hu, Ming-Hsuan Yang

Learning to Autofocus
Charles Herrmann, Richard Strong Bowen, Neal Wadhwa, Rahul Garg, Qiurui He, Jonathan T. Barron, Ramin Zabih

Multi-Scale Boosted Dehazing Network with Dense Feature Fusion
Hang Dong, Jinshan Pan, Lei Xiang, Zhe Hu, Xinyi Zhang, Fei Wang, Ming-Hsuan Yang

Composing Good Shots by Exploiting Mutual Relations
Debang Li, Junge Zhang, Kaiqi Huang, Ming-Hsuan Yang

PatchVAE: Learning Local Latent Codes for Recognition
Kamal Gupta, Saurabh Singh, Abhinav Shrivastava

Neural Voxel Renderer: Learning an Accurate and Controllable Rendering Tool
Konstantinos Rematas, Vittorio Ferrari

Local Implicit Grid Representations for 3D Scenes
Chiyu “Max” Jiang, Avneesh Sud, Ameesh Makadia, Jingwei Huang, Matthias Niessner, Thomas Funkhouser

Large Scale Video Representation Learning via Relational Graph Clustering
Hyodong Lee, Joonseok Lee, Joe Yue-Hei Ng, Apostol (Paul) Natsev

Deep Homography Estimation for Dynamic Scenes
Hoang Le, Feng Liu, Shu Zhang, Aseem Agarwala

C-Flow: Conditional Generative Flow Models for Images and 3D Point Clouds
Albert Pumarola, Stefan Popov, Francesc Moreno-Noguer, Vittorio Ferrari

Lighthouse: Predicting Lighting Volumes for Spatially-Coherent Illumination
Pratul Srinivasan, Ben Mildenhall, Matthew Tancik, Jonathan T. Barron, Richard Tucker, Noah Snavely

Scale-space flow for end-to-end optimized video compression
Eirikur Agustsson, David Minnen, Nick Johnston, Johannes Ballé, Sung Jin Hwang, George Toderici

StructEdit: Learning Structural Shape Variations
Kaichun Mo, Paul Guerrero, Li Yi, Hao Su, Peter Wonka, Niloy Mitra, Leonidas Guibas

3D-MPA: Multi Proposal Aggregation for 3D Semantic Instance Segmentation
Francis Engelmann, Martin Bokeloh, Alireza Fathi, Bastian Leibe, Matthias Niessner

Sequential mastery of multiple tasks: Networks naturally learn to learn and forget to forget
Guy Davidson, Michael C. Mozer

Distilling Effective Supervision from Severe Label Noise
Zizhao Zhang, Han Zhang, Sercan Ö. Arik, Honglak Lee, Tomas Pfister

ViewAL: Active Learning With Viewpoint Entropy for Semantic Segmentation
Yawar Siddiqui, Julien Valentin, Matthias Niessner

Attribution in Scale and Space
Shawn Xu, Subhashini Venugopalan, Mukund Sundararajan

Weakly-Supervised Semantic Segmentation via Sub-category Exploration
Yu-Ting Chang, Qiaosong Wang, Wei-Chih Hung, Robinson Piramuthu, Yi-Hsuan Tsai, Ming-Hsuan Yang

Speech2Action: Cross-modal Supervision for Action Recognition
Arsha Nagrani, Chen Sun, David Ross, Rahul Sukthankar, Cordelia Schmid, Andrew Zisserman

Counting Out Time: Class Agnostic Video Repetition Counting in the Wild
Debidatta Dwibedi, Yusuf Aytar, Jonathan Tompson, Pierre Sermanet, Andrew Zisserman

The Garden of Forking Paths: Towards Multi-Future Trajectory Prediction
Junwei Liang, Lu Jiang, Kevin Murphy, Ting Yu, Alexander Hauptmann

Self-training with Noisy Student improves ImageNet classification
Qizhe Xie, Minh-Thang Luong, Eduard Hovy, Quoc V. Le

EfficientDet: Scalable and Efficient Object Detection (see the blog post)
Mingxing Tan, Ruoming Pang, Quoc Le

ACNe: Attentive Context Normalization for Robust Permutation-Equivariant Learning
Weiwei Sun, Wei Jiang, Eduard Trulls, Andrea Tagliasacchi, Kwang Moo Yi

VectorNet: Encoding HD Maps and Agent Dynamics from Vectorized Representation
Jiyang Gao, Chen Sun, Hang Zhao, Yi Shen, Dragomir Anguelov, Cordelia Schmid, Congcong Li

SpineNet: Learning Scale-Permuted Backbone for Recognition and Localization
Xianzhi Du, Tsung-Yi Lin, Pengchong Jin, Golnaz Ghiasi, Mingxing Tan, Yin Cui, Quoc Le, Xiaodan Song

KeyPose: Multi-View 3D Labeling and Keypoint Estimation for Transparent Objects
Xingyu Liu, Rico Jonschkowski, Anelia Angelova, Kurt Konolige

Structured Multi-Hashing for Model Compression
Elad Eban, Yair Movshovitz-Attias, Hao Wu, Mark Sandler, Andrew Poon, Yerlan Idelbayev, Miguel A. Carreira-Perpinan

DOPS: Learning to Detect 3D Objects and Predict their 3D Shapes
Mahyar Najibi, Guangda Lai, Abhijit Kundu, Zhichao Lu, Vivek Rathod, Tom Funkhouser, Caroline Pantofaru, David Ross, Larry Davis, Alireza Fathi

Panoptic-DeepLab: A Simple, Strong, and Fast Baseline for Bottom-Up Panoptic Segmentation
Bowen Cheng, Maxwell Collins, Yukun Zhu, Ting Liu, Thomas S. Huang, Hartwig Adam, Liang-Chieh Chen

Context R-CNN: Long Term Temporal Context for Per-Camera Object Detection
Sara Beery, Guanhang Wu, Vivek Rathod, Ronny Votel, Jonathan Huang

Distortion Agnostic Deep Watermarking
Xiyang Luo, Ruohan Zhan, Huiwen Chang, Feng Yang, Peyman Milanfar

Can weight sharing outperform random architecture search? An investigation with TuNAS
Gabriel Bender, Hanxiao Liu, Bo Chen, Grace Chu, Shuyang Cheng, Pieter-Jan Kindermans, Quoc Le

GIFnets: Differentiable GIF Encoding Framework
Innfarn Yoo, Xiyang Luo, Yilin Wang, Feng Yang, Peyman Milanfar

Your Local GAN: Designing Two Dimensional Local Attention Mechanisms for Generative Models
Giannis Daras, Augustus Odena, Han Zhang, Alex Dimakis

Fast Sparse ConvNets
Erich Elsen, Marat Dukhan, Trevor Gale, Karen Simonyan

RetinaTrack: Online Single Stage Joint Detection and Tracking
Zhichao Lu, Vivek Rathod, Ronny Votel, Jonathan Huang

Learning to See Through Obstructions
Yu-Lun Liu, Wei-Sheng Lai, Ming-Hsuan Yang,Yung-Yu Chuang, Jia-Bin Huang

Self-Supervised Learning of Video-Induced Visual Invariances
Michael Tschannen, Josip Djolonga, Marvin Ritter, Aravindh Mahendran, Neil Houlsby, Sylvain Gelly, Mario Lucic

Workshops

3rd Workshop and Challenge on Learned Image Compression
Organizers include: George Toderici, Eirikur Agustsson, Lucas Theis, Johannes Ballé, Nick Johnston

CLVISION 1st Workshop on Continual Learning in Computer Vision
Organizers include: Zhiyuan (Brett) Chen, Marc Pickett

Embodied AI
Organizers include: Alexander Toshev, Jie Tan, Aleksandra Faust, Anelia Angelova

The 1st International Workshop and Prize Challenge on Agriculture-Vision: Challenges & Opportunities for Computer Vision in Agriculture
Organizers include: Zhen Li, Jim Yuan

Embodied AI
Organizers include: Alexander Toshev, Jie Tan, Aleksandra Faust, Anelia Angelova

New Trends in Image Restoration and Enhancement workshop and challenges on image and video restoration and enhancement (NTIRE)
Talk: “Sky Optimization: Semantically aware image processing of skies in low-light photography”
Orly Liba, Longqi Cai, Yun-Ta Tsai, Elad Eban, Yair Movshovitz-Attias, Yael Pritch, Huizhong Chen, Jonathan Barron

The End-of-End-to-End A Video Understanding Pentathlon
Organizers include: Rahul Sukthankar

4th Workshop on Media Forensics
Organizers include: Christoph Bregler

4th Workshop on Visual Understanding by Learning from Web Data
Organizers include: Jesse Berent, Rahul Sukthankar

AI for Content Creation
Organizers include: Deqing Sun, Lu Jiang, Weilong Yang

Fourth Workshop on Computer Vision for AR/VR
Organizers include: Sofien Bouaziz

Low-Power Computer Vision Competition (LPCVC)
Organizers include: Bo Chen, Andrew Howard, Jaeyoun Kim

Sight and Sound
Organizers include: William Freeman

Workshop on Efficient Deep Learning for Computer Vision
Organizers include: Pete Warden

Extreme classification in computer vision
Organizers include: Ramin Zabih, Zhen Li

Image Matching: Local Features and Beyond (see the blog post)
Organizers include: Eduard Trulls

The DAVIS Challenge on Video Object Segmentation
Organizers include: Alberto Montes, Jordi Pont-Tuset, Kevis-Kokitsi Maninis

2nd Workshop on Precognition: Seeing through the Future
Organizers include: Utsav Prabhu

Computational Cameras and Displays (CCD)
Talk: Orly Liba

2nd Workshop on Learning from Unlabeled Videos (LUV)
Organizers include:Honglak Lee, Rahul Sukthankar

7th Workshop on Fine Grained Visual Categorization (FGVC7) (see the blog post)
Organizers include: Christine Kaeser-Chen, Serge Belongie

Language & Vision with applications to Video Understanding
Organizers include: Lu Jiang

Neural Architecture Search and Beyond for Representation Learning
Organizers include: Barret Zoph

Tutorials

Disentangled 3D Representations for Relightable Performance Capture of Humans
Organizers include: Sean Fanello, Christoph Rhemann, Jonathan Taylor, Sofien Bouaziz, Adarsh Kowdle, Rohit Pandey, Sergio Orts-Escolano, Paul Debevec, Shahram Izadi

Learning Representations via Graph-Structured Networks
Organizers include:Chen Sun, Ming-Hsuan Yang

Novel View Synthesis: From Depth-Based Warping to Multi-Plane Images and Beyond
Organizers include:Varun Jampani

How to Write a Good Review
Talks by:Vittorio Ferrari, Bill Freeman, Jordi Pont-Tuset

Neural Rendering
Organizers include:Ricardo Martin-Brualla, Rohit K. Pandey, Sean Fanello,Maneesh Agrawala, Dan B. Goldman

Fairness Accountability Transparency and Ethics and Computer Vision
Organizers: Timnit Gebru, Emily Denton

Stanford AI Lab Papers and Talks at CVPR 2020

Stanford AI Lab Papers and Talks at CVPR 2020

The Conference on Computer Vision and Pattern Recognition (CVPR) 2020 is being hosted virtually from June 14th – June 19th. We’re excited to share all the work from SAIL that’s being presented, and you’ll find links to papers, videos and blogs below. Feel free to reach out to the contact authors directly to learn more about the work that’s happening at Stanford!

List of Accepted Papers

Action Genome: Actions as Compositions of Spatio-temporal Scene Graphs


Authors: Jingwei Ji, Ranjay Krishna, Li Fei-Fei, Juan Carlos Niebles

Contact: jingweij@cs.stanford.edu

Links: Paper

Keywords: action recognition, scene graph, video understanding, relationships, composition, action, activity, video


AdaCoSeg: Adaptive Shape Co-Segmentation with Group Consistency Loss


Authors: Chenyang Zhu, Kai Xu, Siddhartha Chaudhuri, Li Yi, Leonidas J. Guibas, Hao Zhang

Contact: guibas@cs.stanford.edu

Links: Paper

Keywords: shape segmentation, consistency


Adversarial Texture Optimization from RGB-D Scans


Authors: Jingwei Huang, Justus Thies, Angela Dai, Abhijit Kundu, Chiyu Jiang, Leonidas Guibas, Matthias Nießner, Thomas Funkhouser

Contact: jingweih@stanford,edu

Links: Paper | Video

Keywords: texture; adversarial;


Bodies at Rest: 3D Human Pose and Shape Estimation from a Pressure Image using Synthetic Data


Authors: Henry M. Clever, Zackory Erickson, Ari Kapusta, Greg Turk, C.Karen Liu, and Charlie C. Kemp

Contact: karenliu@cs.stanford.edu

Links: Paper | Video

Keywords: human pose estimation;


Category-Level Articulated Object Pose Estimation


Authors: Xiaolong Li, He Wang, Li Yi, Leonidas Guibas, A. Lynn Abbott, Shuran Song

Contact: hewang@stanford.edu

Award nominations: Oral presentation

Links: Paper | Video

Keywords: category level pose estimation, articulated object, 3d vision, point cloud, object part, object joint, segmentation, kinematic constraints


Few-Shot Video Classification via Temporal Alignment


Authors: Kaidi Cao, Jingwei Ji, Zhangjie Cao, Chien-Yi Chang, Juan Carlos Niebles

Contact: kaidicao@cs.stanford.edu

Links: Paper | Video

Keywords: video classification, few-shot learning, action recognition, temporal alignment


ImVoteNet: Boosting 3D Object Detection in Point Clouds With Image Votes


Authors: Charles R. Qi, Xinlei Chen, Or Litany, Leonidas J. Guibas

Contact: or.litany@gmail.com

Links: Paper

Keywords: 3d object detection, rgb-d, voting, point clouds, multi-modality, fusion, deep learning, object recognition.


Learning multiview 3D point cloud registration


Authors: Zan Gojcic, Caifa Zhou, Jan D. Wegner, Leonidas J. Guibas, Tolga Birdal

Contact: tbirdal@stanford.edu

Links: Paper | Video

Keywords: registration, multiview, 3d reconstruction, point clouds, global alignment, synchronization, 3d, local features, end to end, 3d matching


Robust Learning Through Cross-Task Consistency


Authors: Amir R. Zamir, Alexander Sax, Nikhil Cheerla, Rohan Suri, Zhangjie Cao, Jitendra Malik, Leonidas J. Guibas;

Contact: guibas@cs.stanford.edu

Links: Paper | Video

Keywords: multi-task learning, transfer learning, cycle consistency


SAPIEN: A SimulAted Part-based Interactive ENvironment


Authors: Fanbo Xiang, Yuzhe Qin, Kaichun Mo, Yikuan Xia, Hao Zhu, Fangchen Liu, Minghua Liu, Hanxiao Jiang, Yifu Yuan, He Wang, Li Yi, Angel X.Chang, Leonidas J. Guibas, Hao Su

Contact: kaichunm@stanford.edu

Award nominations: Oral presentation

Links: Paper | Video

Keywords: robotic simulator, 3d shape parts, robotic manipulation, 3d vision and robotics


Spatio-Temporal Graph for Video Captioning with Knowledge Distillation


Authors: Boxiao Pan, Haoye Cai, De-An Huang, Kuan-Hui Lee, Adrien Gaidon, Ehsan Adeli, Juan Carlos Niebles

Contact: bxpan@stanford.edu

Links: Paper | Video

Keywords: video captioning, spatio-temporal graph, knowledge distillation, video understanding, vision and language.


StructEdit: Learning Structural Shape Variations


Authors: Kaichun Mo, Paul Guerrero, Li Yi, Hao Su, Peter Wonka, Niloy Mitra, Leonidas J. Guibas

Contact: kaichunm@stanford.edu

Links: Paper

Keywords: shape editing; shape structure; 3d vision and graphics


Synchronizing Probability Measures on Rotations via Optimal Transport


Authors: Tolga Birdal, Michael Arbel, Umut Şimşekli, Leonidas Guibas

Contact: tbirdal@stanford.edu

Links: Paper | Video

Keywords: synchronization, optimal transport, rotation averaging, slam, sfm, probability measure, riemannian, gradient descent, pose estimation


Unsupervised Learning From Video With Deep Neural Embeddings


Authors: Chengxu Zhuang, Tianwei She, Alex Andonian, Max Sobol Mark, Daniel Yamins

Contact: chengxuz@stanford.edu

Links: Paper

Keywords: unsupervised learning, self-supervised learning, video learning, contrastive learning, deep neural networks, action recognition, object recognition, two-pathway models


We look forward to seeing you at CVPR!

Read More