Amazon SageMaker provides a suite of built-in algorithms, pre-trained models, and pre-built solution templates to help data scientists and machine learning (ML) practitioners get started on training and deploying ML models quickly. You can use these algorithms and models for both supervised and unsupervised learning. They can process various types of input data, including tabular, image, and text.
Starting today, the SageMaker LightGBM algorithm offers distributed training using the Dask framework for both tabular classification and regression tasks. They’re available through the SageMaker Python SDK. The supported data format can be either CSV or Parquet. Extensive benchmarking experiments on four publicly available datasets with various settings are conducted to validate its performance.
Customers are increasingly interested in training models on large datasets with SageMaker LightGBM, which can take a day or even longer. In these cases, you might be able to speed up the process by distributing training over multiple machines or processes in a cluster. This post discusses how SageMaker LightGBM helps you set up and launch distributed training, without the expense and difficulty of directly managing your training clusters.
Problem statement
Machine learning has become an essential tool for extracting insights from large amounts of data. From image and speech recognition to natural language processing and predictive analytics, ML models have been applied to a wide range of problems. As datasets continue to grow in size and complexity, traditional training methods can become increasingly time-consuming and resource-intensive. This is where distributed training comes into play.
Distributed training is a technique that allows for the parallel processing of large amounts of data across multiple machines or devices. By splitting the data and training multiple models in parallel, distributed training can significantly reduce training time and improve the performance of models on big data. In recent years, distributed training has been a popular mechanism in training deep neural networks for use cases such as large language models (LLMs), image generation and classification, and text generation tasks using frameworks like PyTorch, TensorFlow, and MXNet. In this post, we discuss how distributed training can be applied to tabular data (a common type of data found in many industries such as finance, healthcare, and retail) using Dask and the LightGBM algorithm for tasks such as regression and classification.
Dask is an open-source parallel computing library that allows for distributed parallel processing of large datasets in Python. It’s designed to work with the existing Python and data science ecosystem such as NumPy and Pandas. When it comes to distributed training, Dask can be used to parallelize the data loading, preprocessing, and model training tasks, and it integrates well with popular ML algorithms like LightGBM. LightGBM is a gradient boosting framework that uses tree-based learning algorithms, which is designed to be efficient and scalable for training large models on big data. Combining these two powerful libraries, LightGBM v3.2.0 is now integrated with Dask to allow distributed learning across multiple machines to produce a single model.
How distributed training works
Distributed training for tree-based algorithms is a technique that is used when the dataset is too large to be processed on a single instance or when the computational resources of a single instance are not sufficient to train the tree-based model in a reasonable amount of time. It allows a model to be trained across multiple instances or machines, rather than on a single machine. This is done by dividing the dataset into smaller subsets, called chunks, and distributing them among the available instances. Each instance then trains a model on its assigned chunk of data, and the results are later combined using aggregation algorithms to form a single model.
In tree-based models like LightGBM, the main computational cost is in the building of the tree structure. This is typically done by sorting and selecting subsets of the data.
Now, let’s explore how LightGBM does the parallel training. LightGBM can use three types of parallelism:
- Data parallelism – This is the most basic form of data parallelism. The data is divided horizontally into smaller subsets and distributed among multiple instances. Each instance constructs its local histogram, and all histograms are merged, then a split is performed using a reduce scatter algorithm. A histogram in local instances is constructed by dividing the subset of the local data into discrete bins, and counting the number of data points in each bin. This histogram-based algorithm helps speed up the training and reduces memory usage.
- Feature parallelism – In feature parallelism, each machine is responsible for training a subset of the features of the model, rather than a subset of the data. This can be useful when working with datasets that have a large number of features, because it allows for more efficient use of resources. It works by finding the best local split point in each instance, then communicates the best split with the other instances. LightGBM implementation maintains all features of the data in every machine to reduce the cost of communicating the best splits.
- Voting parallelism – In voting parallelism, the data is divided into smaller subsets and distributed among multiple machines. Each machine trains a model on its assigned subset of data, and the results are later combined to form a single, larger model. However, instead of using the gradients from all the machines to update the model parameters, a voting mechanism is used to decide which gradients to use. This can be useful when working with datasets that have a lot of noise or outliers, because it can help reduce the impact of these on the final model. At the time of writing this post, LightGBM integration with Dask only supports data and voting parallelism types.
SageMaker will automatically set up and manage a Dask cluster when using multiple instances with the LightGBM built-in container.
Solution overview
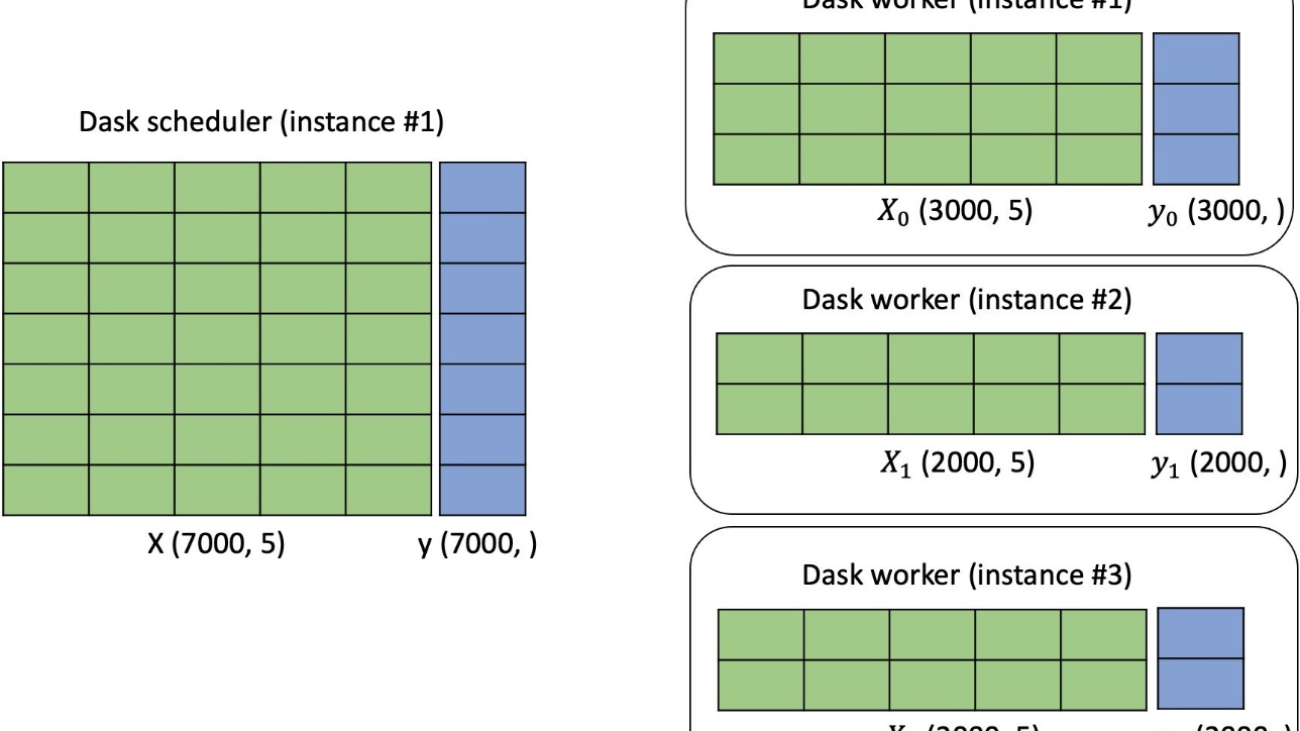
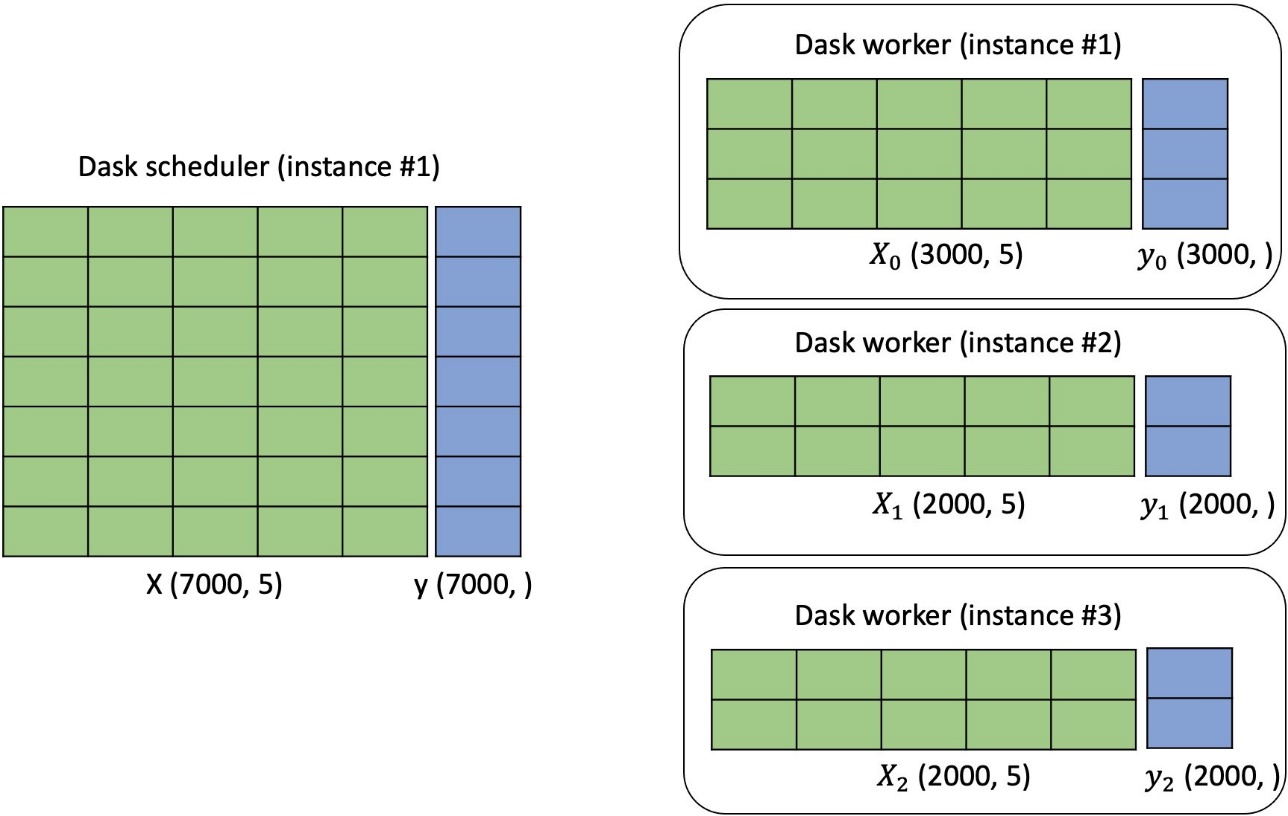
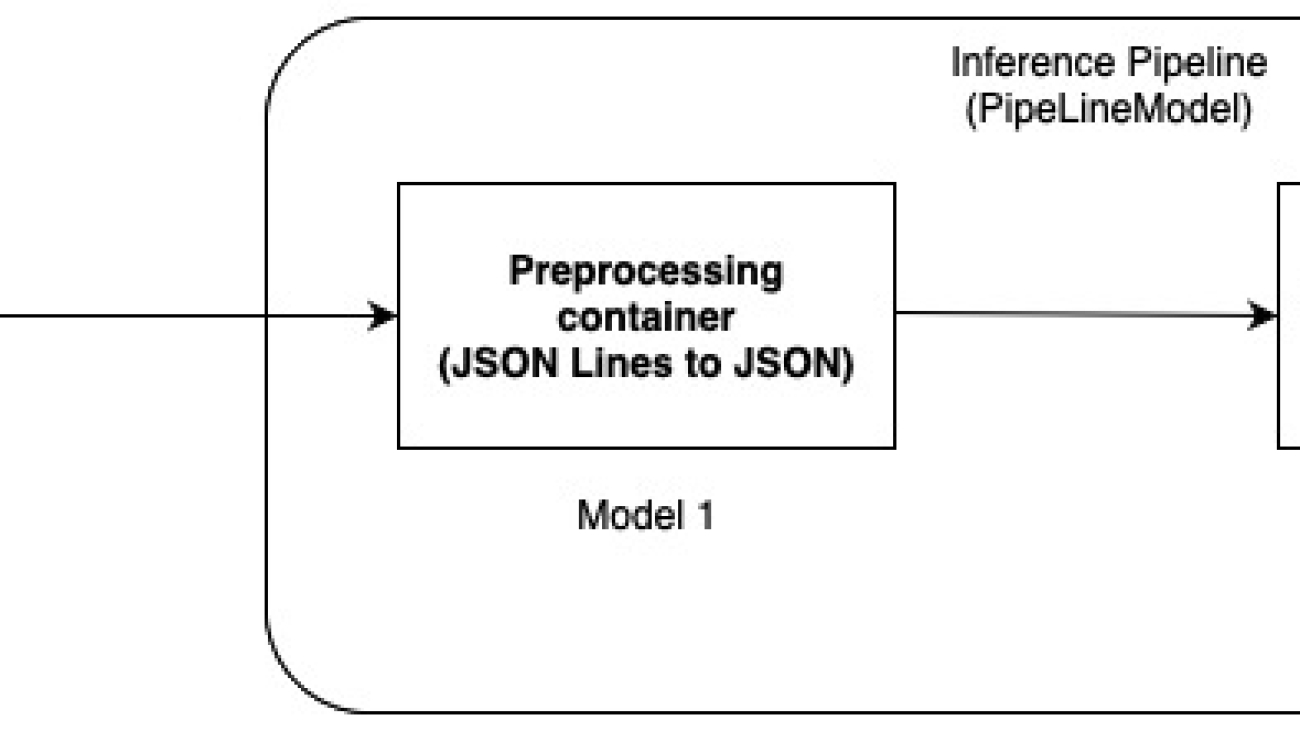
When a training job using LightGBM is started with multiple instances, we first create a Dask cluster. One instance acts as the Dask scheduler, and the remaining instances have Dask workers, where each worker has multiple threads. Each worker in the cluster has part of the data to perform the distributed computations, as illustrated in the following figure.
Enable distributed training
The requirements for the input data are as follows:
- The supported input data format for training can be either CSV or Parquet. You are allowed to put more than one data file under both train and validation channels. If multiple files are identified, the algorithm will concatenate all of them as the training or validation data. The name of the data file can be any string as long as it ends with .csv or .parquet.
- For each data file, the algorithm requires that the target variable is in the first column and that it should not have a header record. This follows the convention of the SageMaker XGBoost algorithm.
- If your predictors include categorical features, you can provide a JSON file named
cat_index.jsonin the same location as your training data. This file should contain a Python dictionary, where the key can be any string and the value is a list of unique integers. Each integer in the value list should indicate the column index of the corresponding categorical features in your data file. The index starts with value 1, because value 0 corresponds to the target variable. Thecat_index.jsonfile should be put under the training data directory, as shown in the following example. - The instance type supported by distributed training is CPU.
Let’s use data in CSV format as an example. The train and validation data can be structured as follows:
You can specify the input type to be either text/csv or application/x-parquet:
Before distributed training, you can retrieve the default hyperparameters of LightGBM and override them with custom values:
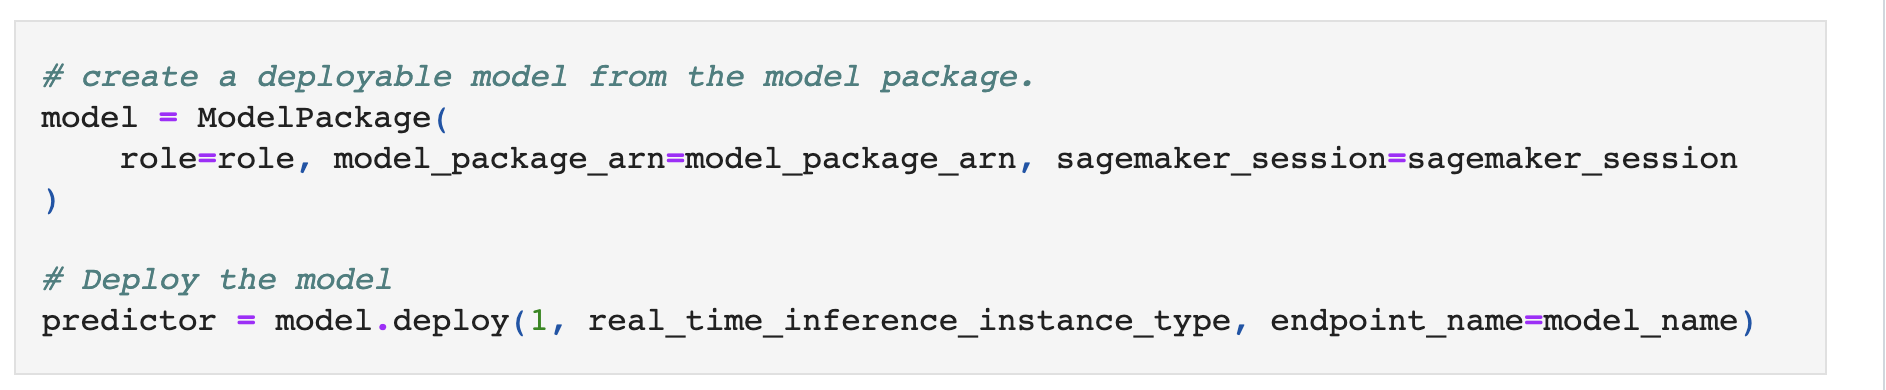
To enable distributed training, you can simply specify the argument instance_count in the class sagemaker.estimator.Estimator to be more than 1. The rest of work is taken care of under the hood. See the following example code:
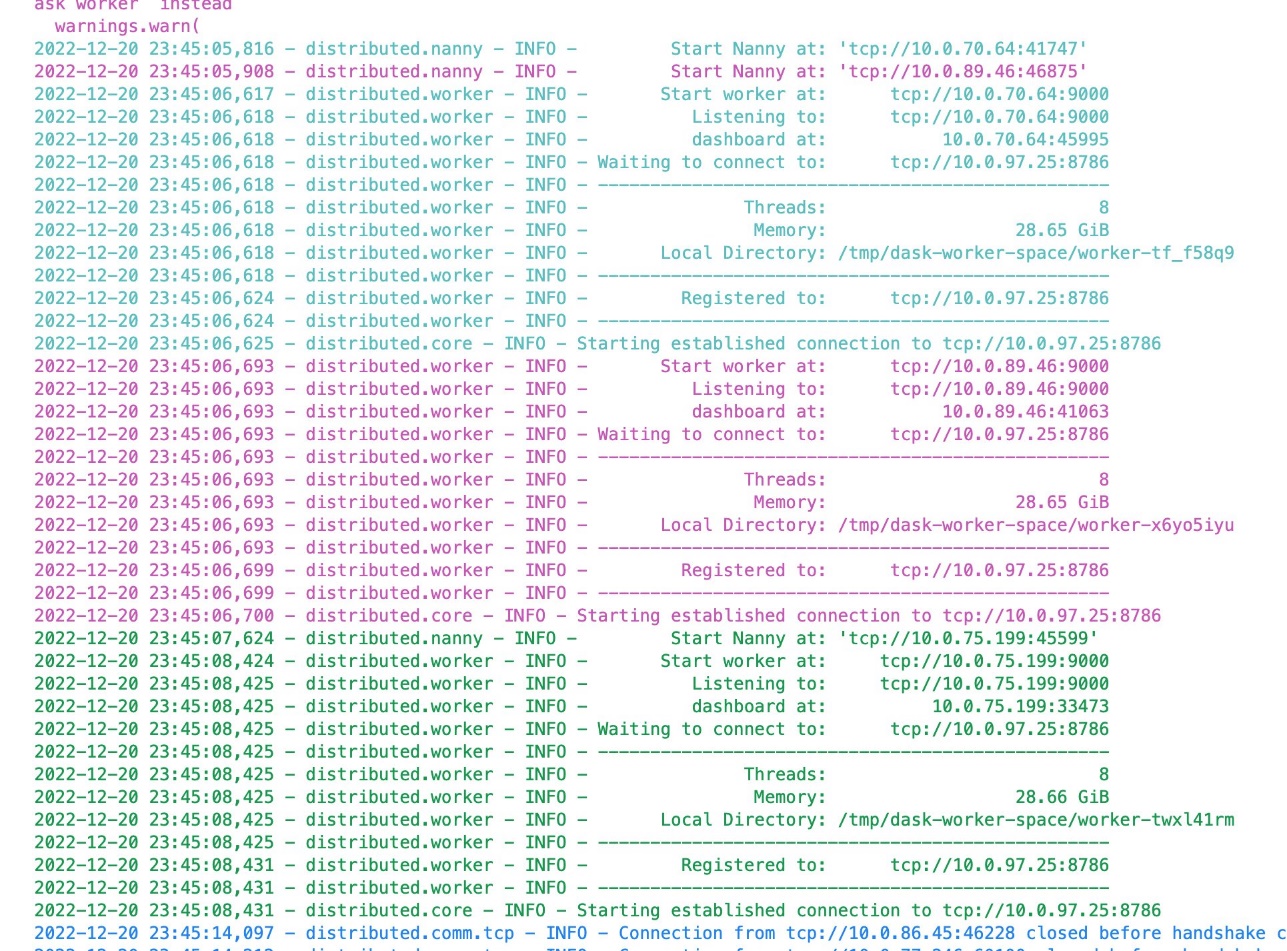
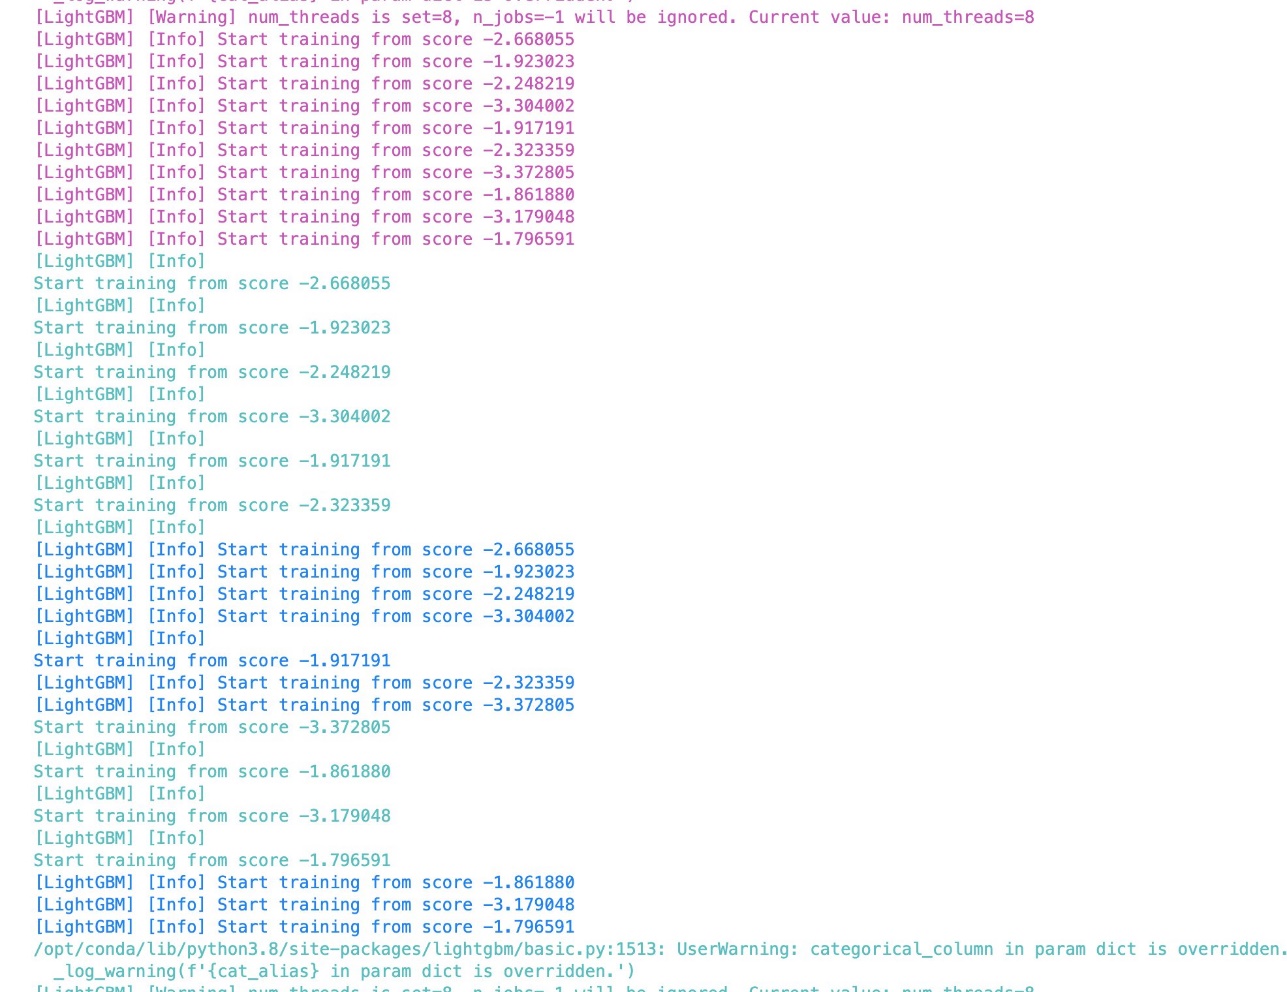
The following screenshots show a successful training job log from the notebook. The logs from different Amazon Elastic Compute Cloud (Amazon EC2) machines are marked by different colors.
The distributed training is also compatible with SageMaker automatic model tuning. For details, see the example notebook.
Benchmarking
We conducted benchmarking experiments to validate the performance of distributed training in SageMaker LightGBM on four different publicly available datasets for regression, binary, and multi-class classification tasks. The experiment details are as follows:
- Each dataset is split into training, validation, and test data following the 80/20/10 split rule. For each dataset and instance type and count, we train LightGBM on the training data; record metrics such as billable time (per instance), total runtime, average training loss at the end of the last built tree over all instances, and validation loss at the end of the last built tree; and evaluate its performance on the hold-out test data.
- For each trial, we use the exact same set of hyperparameter values, with the number of trees being 500 except for the lending dataset. For the lending dataset, we use 100 as the number of trees because it’s sufficient to get optimal results on the hold-out test data.
- Each number presented in the table is averaged over three trials.
- Because each model is trained with one fixed set of hyperparameter values, the evaluation metric numbers on the hold-out test data can be further improved with hyperparameter optimization.
Billable time refers to the absolute wall-clock time. The total runtime is the elastic time running the distributed training, which includes the billable time and time to spin up instances and install dependencies. For the validation loss at the end of the last built tree, we didn’t do the average over all the instances as the training loss because all of the validation data is assigned to a single instance and therefore only that instance has the validation loss metric. Out of Memory (OOM) means the dataset hit the out of memory error during training. The loss function and evaluation metrics used are binary and multi-class logloss, L2, accuracy, F1, ROC AUC, F1 macro, F1 micro, R2, MAE, and MSE.
The expectation is that as the instance count increases, the billable time (per instance) and total runtime decreases, while the average training loss and validation loss at the end of the last built tree and evaluation scores on the hold-out test data remain the same.
We conducted three experiments:
- Benchmark on three publicly available datasets using CSV as the input data format
- Benchmark on a different dataset using Parquet as the input data format
- Compare the model performance on different instance types given a certain instance count
The datasets we used are lending club loan data, ad-tracking fraud detection data, code data, and NYC taxi data. The data statistics are presented as follows.
| Dataset | Size | Number of Examples | Number of Features | Problem Type |
| lending club loan | ~10 G | 1, 439, 141 | 955 | Binary classification |
| ad-tracking fraud detection | ~10 G | 145, 716, 493 | 9 | Binary classification |
| code | ~10 G | 18, 268, 221 | 9 | Multi-class classification (number of classes in target: 10) |
| NYC taxi | ~0.5 G | 83, 601, 440 | 8 | Regression |
The following table contains the benchmarking results for the first three datasets using CSV as the data input format. For demonstration purposes, we removed the categorical features for the lending club loan data. The data statistics are shown in the table. The experiment results matched our expectations.
| Dataset | Instance Count (m5.2xlarge) | Billable Time per Instance (seconds) | Total Runtime (seconds) | Average Training Loss over all Instances at the End of the Last Built Tree | Validation Loss at the End of the Last Built Tree | Evaluation Metrics on Hold-Out Test Data | ||
| lending club loan | . | . | . | Binary logloss | Binary logloss | Accuracy (%) | F1 (%) | ROC AUC (%) |
| . | 1 | Out of Memory | ||||||
| . | 2 | Out of Memory | ||||||
| . | 4 | 461 | 614 | 0.034 | 0.039 | 98.9 | 96.6 | 99.7 |
| . | 6 | 375 | 561 | 0.034 | 0.039 | 98.9 | 96.6 | 99.7 |
| . | 8 | 359 | 549 | 0.034 | 0.039 | 98.9 | 96.7 | 99.7 |
| . | 10 | 338 | 522 | 0.036 | 0.037 | 98.9 | 96.6 | 99.7 |
| . | ||||||||
| ad-tracking fraud detection | . | . | . | Binary logloss | Binary logloss | Accuracy (%) | F1 (%) | ROC AUC (%) |
| . | 1 | Out of Memory | ||||||
| . | 2 | Out of Memory | ||||||
| . | 4 | 2649 | 2773 | 0.038 | 0.039 | 99.8 | 43.2 | 80.4 |
| . | 6 | 1926 | 2047 | 0.039 | 0.04 | 99.8 | 44.5 | 79.7 |
| . | 8 | 1677 | 1780 | 0.04 | 0.04 | 99.8 | 45.3 | 79.2 |
| . | 10 | 1595 | 1744 | 0.04 | 0.041 | 99.8 | 43 | 79.3 |
| . | ||||||||
| code | . | . | . | Multiclass logloss | Multiclass logloss | Accuracy (%) | F1 Macro (%) | F1 Micro (%) |
| . | 1 | 5329 | 5414 | 0.937 | 0.947 | 65.6 | 59.3 | 65.6 |
| . | 2 | 3175 | 3294 | 0.94 | 0.942 | 65.5 | 59 | 65.5 |
| . | 4 | 2593 | 2695 | 0.937 | 0.942 | 65.6 | 59.3 | 65.6 |
| . | 8 | 2253 | 2377 | 0.938 | 0.943 | 65.6 | 59.3 | 65.6 |
| . | 10 | 2160 | 2285 | 0.937 | 0.942 | 65.6 | 59.3 | 65.6 |
The following table contains the benchmarking results using NYC taxi data with Parquet as the input data format. For the NYC taxi data, we use the yellow trip taxi records from 2009–2022. We follow the example notebook to conduct feature processing. The processed data takes 8.5 G of disk memory when saved as CSV format, and only 0.55 G when saved as Parquet format.
A similar pattern shown in the preceding table is observed. As the instance count increases, the billable time (per instance) and total runtime decreases, while the average training loss and validation loss at the end of the last built tree and evaluation scores on the hold-out test data remain the same.
| Dataset | Instance Count (m5.4xlarge) | Billable Time per Instance (seconds) | Total Runtime (seconds) | Average Training Loss over all Instances at the End of the Last Built Tree | Validation Loss at the End of the Last Built Tree | Evaluation Metrics on Hold-Out Test Data | ||
| NYC taxi | . | . | . | L2 | L2 | R2 (%) | MSE | MAE |
| . | 1 | 951 | 1036 | 6.543 | 6.543 | 54.7 | 42.8 | 2.7 |
| . | 2 | 635 | 727 | 6.545 | 6.545 | 54.7 | 42.8 | 2.7 |
| . | 4 | 501 | 628 | 6.637 | 6.639 | 53.4 | 44.1 | 2.8 |
| . | 6 | 435 | 552 | 6.74 | 6.74 | 52 | 45.4 | 2.8 |
| . | 8 | 410 | 510 | 6.919 | 6.924 | 52.3 | 44.9 | 2.9 |
We also conduct benchmarking experiments and compare the performance under different instance types using the code dataset. For a certain instance count, as the instance type becomes larger, the billable time and total runtime decrease.
| . | ml.m5.2xlarge | ml.m5.4xlarge | ml.m5.12xlarge | |||
| Instance Count | Billable Time per Instance (seconds) | Total Runtime (seconds) | Billable Time per Instance (seconds) | Total Runtime (seconds) | Billable Time per Instance (seconds) | Total Runtime (seconds) |
| 1 | 5329 | 5414 | 2793 | 2904 | 1302 | 1394 |
| 2 | 3175 | 3294 | 1911 | 2000 | 1006 | 1098 |
| 4 | 2593 | 2695 | 1451 | 1557 | 891 | 973 |
Conclusion
With the power of Dask’s distributed computing framework and LightGBM’s efficient gradient boosting algorithm, data scientists and developers can train models on large datasets faster and more efficiently than using traditional single-node methods. The SageMaker LightGBM algorithm makes the process of setting up distributed training using the Dask framework for both tabular classification and regression tasks much easier. The algorithm is now available through the SageMaker Python SDK. The supported data format can be either CSV or Parquet. Extensive benchmarking experiments were conducted on four publicly available datasets with various settings to validate its performance.
You can bring your own dataset and try these new algorithms on SageMaker, and check out the example notebook to use the built-in algorithms available on GitHub.
About the authors
 Dr. Xin Huang is an Applied Scientist for Amazon SageMaker JumpStart and Amazon SageMaker built-in algorithms. He focuses on developing scalable machine learning algorithms. His research interests are in the area of natural language processing, explainable deep learning on tabular data, and robust analysis of non-parametric space-time clustering. He has published many papers in ACL, ICDM, KDD conferences, and Royal Statistical Society: Series A journal.
 Will Badr is a Principal AI/ML Specialist SA who works as part of the global Amazon Machine Learning team. Will is passionate about using technology in innovative ways to positively impact the community. In his spare time, he likes to go diving, play soccer and explore the Pacific Islands.
 Dr. Li Zhang is a Principal Product Manager-Technical for Amazon SageMaker JumpStart and Amazon SageMaker built-in algorithms, a service that helps data scientists and machine learning practitioners get started with training and deploying their models, and uses reinforcement learning with Amazon SageMaker. His past work as a principal research staff member and master inventor at IBM Research has won the test of time paper award at IEEE INFOCOM.


 Dhiraj Thakur is a Solutions Architect with Amazon Web Services. He works with AWS customers and partners to provide guidance on enterprise cloud adoption, migration, and strategy. He is passionate about technology and enjoys building and experimenting in the analytics and AI/ML space.
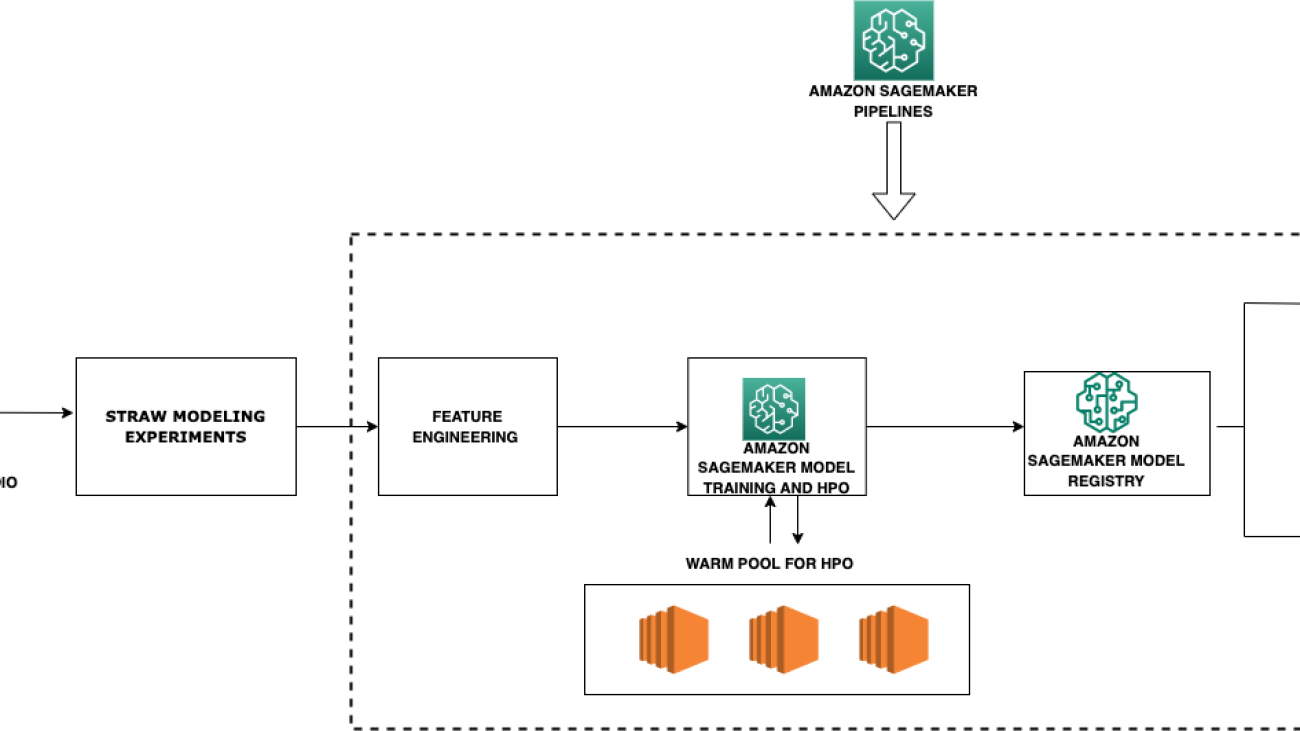


 Tristan Miller is a Lead Data Scientist at Best Egg. He builds and deploys ML models to make important underwriting and marketing decisions. He develops bespoke solutions to address specific problems, as well as automation to increase efficiency and scale. He is also a skilled origamist.

 Ajjay Govindaram is a Sr. Solutions Architect at AWS. He works with strategic customers who are using AI/ML to solve complex business problems. His experience lies in providing technical direction as well as design assistance for modest to large-scale AI/ML application deployments. His knowledge ranges from application architecture to big data, analytics, and machine learning. He enjoys listening to music while resting, experiencing the outdoors, and spending time with his loved ones.


 Pinak Panigrahi works with customers to build machine learning driven solutions to solve strategic business problems on AWS. When not occupied with machine learning, he can be found taking a hike, reading a book or catching up with sports.
 Dhawal Patel is a Principal Machine Learning Architect at AWS. He has worked with organizations ranging from large enterprises to mid-sized startups on problems related to distributed computing, and Artificial Intelligence. He focuses on Deep learning including NLP and Computer Vision domains. He helps customers achieve high performance model inference on SageMaker.


 Dr. Vivek Madan is an Applied Scientist with the Amazon SageMaker JumpStart team. He got his PhD from University of Illinois at Urbana-Champaign and was a Post Doctoral Researcher at Georgia Tech. He is an active researcher in machine learning and algorithm design and has published papers in EMNLP, ICLR, COLT, FOCS, and SODA conferences.
 Heiko Hotz is a Senior Solutions Architect for AI & Machine Learning with a special focus on Natural Language Processing (NLP), Large Language Models (LLMs), and Generative AI. Prior to this role, he was the Head of Data Science for Amazon’s EU Customer Service. Heiko helps our customers being successful in their AI/ML journey on AWS and has worked with organizations in many industries, including Insurance, Financial Services, Media and Entertainment, Healthcare, Utilities, and Manufacturing. In his spare time Heiko travels as much as possible.

 Sudip Roy is Manager of Technical Staff at Cohere, a provider of cutting-edge natural language processing (NLP) technology. Sudip is an accomplished researcher who has published and served on program committees for top conferences like NeurIPS, MLSys, OOPSLA, SIGMOD, VLDB, and SIGKDD, and his work has earned Outstanding Paper awards from SIGMOD and MLSys.
 Karl Albertsen leads product, engineering, and science for Amazon SageMaker Algorithms and JumpStart, SageMaker’s machine learning hub. He is passionate about applying machine learning to unlock business value.