Announcing the 2020 Google PhD Fellows

Announcing the 2020 Google PhD Fellows

Posted by Susie Kim, Program Manager, University Relations

Google created the PhD Fellowship Program in 2009 to recognize and support outstanding graduate students who seek to influence the future of technology by pursuing exceptional research in computer science and related fields. Now in its twelfth year, these Fellowships have helped support approximately 500 graduate students globally in North America and Europe, Africa, Australia, East Asia, and India.

It is our ongoing goal to continue to support the academic community as a whole, and these Fellows as they make their mark on the world. We congratulate all of this year’s awardees!

Algorithms, Optimizations and Markets
Jan van den Brand, KTH Royal Institute of Technology
Mahsa Derakhshan, University of Maryland, College Park
Sidhanth Mohanty, University of California, Berkeley

Computational Neuroscience
Connor Brennan, University of Pennsylvania

Human Computer Interaction
Abdelkareem Bedri, Carnegie Mellon University
Brendan David-John, University of Florida
Hiromu Yakura, University of Tsukuba
Manaswi Saha, University of Washington
Muratcan Cicek, University of California, Santa Cruz
Prashan Madumal, University of Melbourne

Machine Learning
Alon Brutzkus, Tel Aviv University
Chin-Wei Huang, Universite de Montreal
Eli Sherman, Johns Hopkins University
Esther Rolf, University of California, Berkeley
Imke Mayer, Fondation Sciences Mathématique de Paris
Jean Michel Sarr, Cheikh Anta Diop University
Lei Bai, University of New South Wales
Nontawat Charoenphakdee, The University of Tokyo
Preetum Nakkiran, Harvard University
Sravanti Addepalli, Indian Institute of Science
Taesik Gong, Korea Advanced Institute of Science and Technology
Vihari Piratla, Indian Institute of Technology – Bombay
Vishakha Patil, Indian Institute of Science
Wilson Tsakane Mongwe, University of Johannesburg
Xinshi Chen, Georgia Institute of Technology
Yadan Luo, University of Queensland

Machine Perception, Speech Technology and Computer Vision
Benjamin van Niekerk, University of Stellenbosch
Eric Heiden, University of Southern California
Gyeongsik Moon, Seoul National University
Hou-Ning Hu, National Tsing Hua University
Nan Wu, New York University
Shaoshuai Shi, The Chinese University of Hong Kong
Yaman Kumar, Indraprastha Institute of Information Technology – Delhi
Yifan Liu, University of Adelaide
Yu Wu, University of Technology Sydney
Zhengqi Li, Cornell University

Mobile Computing
Xiaofan Zhang, University of Illinois at Urbana-Champaign

Natural Language Processing
Anjalie Field, Carnegie Mellon University
Mingda Chen, Toyota Technological Institute at Chicago
Shang-Yu Su, National Taiwan University
Yanai Elazar, Bar-Ilan

Privacy and Security
Julien Gamba, Universidad Carlos III de Madrid
Shuwen Deng, Yale University
Yunusa Simpa Abdulsalm, Mohammed VI Polytechnic University

Programming Technology and Software Engineering
Adriana Sejfia, University of Southern California
John Cyphert, University of Wisconsin-Madison

Quantum Computing
Amira Abbas, University of KwaZulu-Natal
Mozafari Ghoraba Fereshte, EPFL

Structured Data and Database Management
Yanqing Peng, University of Utah

Systems and Networking
Huynh Nguyen Van, University of Technology Sydney
Michael Sammler, Saarland University, MPI-SWS
Sihang Liu, University of Virginia
Yun-Zhan Cai, National Cheng Kung University

Read More

Why Retailers Are Investing in Edge Computing and AI

Why Retailers Are Investing in Edge Computing and AI

AI is a retailer’s automated helper, acting as a smart assistant to suggest the perfect position for products in stores, accurately predict consumer demand, automate order fulfillment in warehouses, and much more.

The technology can help retailers grow their top line, potentially improving net profit margins from 2 percent to 6 percent — and adding $1 trillion in profits to the industry globally — according to McKinsey Global Institute analysis.

It can also help them hold on to more of what they already have by reducing shrinkage — the loss of inventory due to theft, shoplifting, ticket switching at self-checkout lanes, etc. — which costs retailers $62 billion annually, according to the National Retail Federation.

For retailers, the ability to deploy, manage and scale AI across their entire distributed edge infrastructure using a single, unified platform is critical. Managing these many devices is no small feat for IT teams as the process can be time-consuming, expensive and complex.

NVIDIA is working with retailers, software providers and startups to create an ecosystem of AI applications for retail, such as intelligent stores, forecasting, conversational AI and recommendation systems, that help retailers pull real-time insights from their data to provide a better shopping experience for their customers.

Smart Retail Managed Remotely at the Edge

The NVIDIA EGX edge AI platform makes it easy to deploy and continuously update AI applications in distributed stores and warehouses. It combines GPU-accelerated edge servers, a cloud-native software stack and containerized applications in NVIDIA NGC, a software catalog that offers a range of industry-specific AI toolkits and pre-trained models.

To provide customers a unified control plane through which to manage their AI infrastructure, NVIDIA announced this week during the GPU Technology Conference a new hybrid-cloud platform called NVIDIA Fleet Command.

Fleet Command centralizes the management of servers spread across vast areas. It offers one-touch provisioning, over-the-air software updates, remote management and detailed monitoring dashboards to make it easier for operational teams to reduce the burden of IT to get the most out of their AI applications. Early access to Fleet Command is open now.

KION Group Pursues One-Touch Intelligent Warehouse Deployment

KION Group, a global supply chain solutions provider, is looking to use Fleet Command to securely deploy and update their applications through a unified control plane, from anywhere, at any time. They are using the NVIDIA EGX AI platform to develop AI applications for its intelligent warehouse systems, increasing the throughput and efficiency in its more than 6,000 retail distribution centers.

The following demo shows how Fleet Command helps KION Group simplify the deployment and management of AI at the edge — from material handling to autonomous forklifts to pick-and-place robotics.

Everseen Scales Asset Protection & Perpetual Inventory Accuracy with Edge AI

Everseen’s AI platform, deployed in many retail stores and distribution centers, uses advanced machine learning, computer vision and deep learning to bring real-time insights to retailers for asset protection and to streamline distribution system processes.

The platform is optimized on NVIDIA T4 Tensor Core GPUs using NVIDIA TensorRT software, resulting in 10x higher inference compute at the edge. This enables Everseen’s customers to reduce errors and shrinkage in real time for faster customer checkout and to optimize operations in distribution centers.

Everseen is using the EGX platform and Fleet Command to simplify and scale their deployment and to update their AI applications on servers across hundreds of retail stores and distribution centers. As AI algorithms retrain and improve accuracy with new metadata, updated applications can be securely updated and deployed over the air on hundreds of servers.

Deep North Delivers Transformative Insights with In-Store Analytics

Retailers use Deep North’s AI platform to digitize their shopping locations, analyze anonymous shopper behavior inside stores and conduct visual analytics. The platform gives retailers the ability to predict and adapt to consumer behavior in their commercial spaces and optimize store layout and staffing in high-traffic aisles

The company uses NVIDIA EGX to simplify AI deployment, server management and device orchestration. With EGX, AI computations are performed at the edge entirely in stores, delivering real-time notifications to store associates for better inventory management and optimized staffing.

By optimizing its intelligent video analytics applications on NVIDIA T4 GPUs with the NVIDIA Metropolis application framework, Deep North has seen orders-of-magnitude improvement in edge compute performance while delivering real-time insights to customers.

Growing AI Opportunities for Retailers

The NVIDIA EGX platform and Fleet Command deliver accelerated, secure AI computing to the edge for retailers today. And a growing number of them are applying GPU computing, AI, robotics and simulation technologies to reinvent their operations for maximum agility and profitability.

To learn more, check out my session on “Driving Agility in Retail with AI” at GTC. Explore how NVIDIA is leveraging AI in retail through GPU-accelerated containers, deep learning frameworks, software libraries and SDKs. And watch how NVIDIA AI is transforming everyday retail experiences:

Also watch NVIDIA CEO Jensen Huang recap all the news at GTC: 

The post Why Retailers Are Investing in Edge Computing and AI appeared first on The Official NVIDIA Blog.

Read More

From Content Creation to Collaboration, NVIDIA Omniverse Transforms Entertainment Industry

From Content Creation to Collaboration, NVIDIA Omniverse Transforms Entertainment Industry

There are major shifts happening in the media and entertainment industry.

With the rise of streaming services, there’s a growing demand for high-quality programming  and an increasing need for fresh content to satisfy hundreds of millions of subscribers.

At the same time, teams are often collaborating on complex assets using multiple applications while working from different geographic locations. New pipelines are emerging and post-production workflows are being integrated earlier into processes, boosting the need for real-time collaboration.

By extending our Omniverse 3D simulation and collaboration platform to run on the NVIDIA EGX AI platform, NVIDIA is making it even easier for artists, designers, technologists and other creative professionals to accelerate workflows for productions — from asset creation to live on-set collaboration.

The EGX platform leverages the power of NVIDIA RTX GPUs, NVIDIA Virtual Data Center Workstation software, and NVIDIA Omniverse to fundamentally transform the collaborative process during digital content creation and virtual production.

Professionals and studios around the world can use this combination to lower costs, boost creativity across applications and teams, and accelerate production workflows.

Driving Real-Time Collaboration, Increased Interactivity

The NVIDIA EGX platform delivers the power of the NVIDIA Ampere architecture on a range of validated servers and devices. A vast ecosystem of partners offer EGX through their products and services. Professional creatives can use these to achieve the most significant advancements in computer graphics to accelerate their film and television content creation pipelines.

To support third-party digital content creation applications, Omniverse Connect libraries are distributed as plugins that enable client applications to connect to Omniverse Nucleus and to publish and subscribe to individual assets and full worlds. Supported applications for common film and TV content creation pipelines include Epic Games Unreal Engine, Autodesk Maya, Autodesk 3ds Max, SideFX Houdini, Adobe Photoshop, Substance Painter by Adobe, and Unity.

NVIDIA Virtual Workstation software provides the most powerful virtual workstations from the data center or cloud to any device, anywhere. IT departments can virtualize any application from the data center with a native workstation user experience, while eliminating constrained workflows and flexibly scaling GPU resources.

Studios can optimize their infrastructure by efficiently centralizing applications and data. This dramatically reduces IT operating expenses and allows companies to focus IT resources on managing strategic projects instead of individual workstations — all while enabling a more flexible, remote real-time environment with stronger data security.

With NVIDIA Omniverse, creative teams have the ability to deliver real-time results by creating, iterating and collaborating on the same assets while using a variety of applications. Omniverse powered by the EGX platform and NVIDIA Virtual Workstation allows artists to focus on creating high-quality content without waiting for long render times.

“Real-time ray tracing massive datasets in a remote workstation environment is finally possible with the new RTX A6000, HP ZCentral and NVIDIA’s Omniverse,” said Chris Eckardt, creative director and CG supervisor at Framestore.

Elevating Content Creation Across the World

During content creation, artists need to design and iterate quickly on assets, while collaborating with remote teams and other studios working on the same productions. With Omniverse running on the NVIDIA EGX platform, users can access the power of a high-end virtual workstation to rapidly create, iterate and present compelling renders using their preferred application.

Creative professionals can quickly combine terrain from one shot with characters from another without removing any data, which drives more efficient collaboration. Teams can communicate their designs more effectively by sharing high-fidelity ray-traced models with one click, so colleagues or clients can view the assets on a phone, tablet or in a browser. Along with the ability to mark up models in Omniverse, this accelerates the decision-making process and reduces design review cycles to help keep projects on track.

Taking Virtual Productions to the Next Level

With more film and TV projects using new virtual production techniques, studios are under immense pressure to iterate as quickly as possible to keep the cameras rolling. With in-camera VFX, the concept of fixing it in post-production has moved to fixing it all on set.

With the NVIDIA EGX platform and NVIDIA Virtual Workstations running Omniverse, users gain access to secure, up-to-date datasets from any device, ensuring they maintain productivity when working live on set.

Artists achieve a smooth experience with Unreal Engine, Maya, Substance Painter and other apps to quickly create and iterate on scene files while the interoperability of these software tools in Omniverse improves collaboration. Teams can instantly view photorealistic renderings of their model with the RTX Renderer so that they rapidly assess options for the most compelling images.

Learn more at https://developer.nvidia.com/nvidia-omniverse-platform.

It’s not too late to get access to hundreds of live and on-demand talks at GTC. Register now through Oct. 9 using promo code CMB4KN to get 20 percent off.

The post From Content Creation to Collaboration, NVIDIA Omniverse Transforms Entertainment Industry appeared first on The Official NVIDIA Blog.

Read More

AI, 5G Will Energize U.S. Economy, Says FCC Chair at GTC

AI, 5G Will Energize U.S. Economy, Says FCC Chair at GTC

Ajit Pai recalls a cold February day, standing in a field at the Wind River reservation in central Wyoming with Arapaho Indian leaders, hearing how they used a Connecting America grant to link schools and homes to gigabit fiber Internet.

It was one of many technology transformations the chairman of the U.S. Federal Communications Commission witnessed in visits to 49 states.

“Those trips redouble my motivation to do everything we can to close the digital divide because I want to make sure every American can participate in the digital economy,” said Pai in an online talk at NVIDIA’s GTC event.

Technologies like 5G and AI promise to keep that economy vibrant across factories, hospitals, warehouses and farm fields.

“I visited a corn farmer in Idaho who wants his combine to upload data to the cloud as it goes through the field to determine what water and pesticide to apply … AI will be transformative,” Pai said.

“AI is definitely the next industrial revolution, and America can help lead it,” said Soma Velayutham, NVIDIA’s general manager for AI in telecoms and 5G and host of the online talk with Pai.

AI a Fundamental Part of 5G

Shining a light on machine learning and 5G, the FCC has hosted forums on AI and open radio-access networks that included participants from AT&T, Dell, IBM, Hewlett Packard Enterprise, Nokia, NVIDIA, Oracle, Qualcomm and Verizon.

“It was striking to see how many people think AI will be a fundamental part of 5G, making it a much smarter network with optimizations using powerful AI algorithms to look at spectrum allocations, consumer use cases and how networks can address them,” Pai said.

For example, devices can use machine learning to avoid interference and optimize use of unlicensed spectrum the FCC is opening up for Wi-Fi at 6 GHz. “Someone could hire a million people to work that out, but it’s much more powerful to use AI,” he said.

“AI is really good at resource optimization,” said Velayutham. “AI can efficiently manage 5G network resources, optimizing the way we use and monetize spectrum,” he added.

AI Saves Spectrum, 5G Delivers Cool Services

Telecom researchers in Asia, Europe and the U.S. are using NVIDIA technologies to build software-defined radio access networks that can modulate more services into less spectrum, enabling new graphics and AI services.

In the U.K. telecom provider BT is working with an NVIDIA partner on edge computing applications such as streaming over 5G coverage of sporting events with CloudXR, a mix of virtual and augmented reality.

In closing, Pai addressed developers in the GTC audience, thanking them and “all the innovators for doing this work. You have a friend at the FCC who recognizes your innovation and wants to be a partner with it,” he said.

To hear more about how AI will transform industries at the edge of the network, watch a portion of the GTC keynote below by NVIDIA’s  CEO, Jensen Huang.

The post AI, 5G Will Energize U.S. Economy, Says FCC Chair at GTC appeared first on The Official NVIDIA Blog.

Read More

AI Artist Pindar Van Arman’s Painting Robots Visit GTC 2020

AI Artist Pindar Van Arman’s Painting Robots Visit GTC 2020

Pindar Van Arman is a veritable triple threat — he can paint, he can program and he can program robots that paint.

Van Arman first started incorporating robots into his artistic method 15 years ago to save time. He coded a robot to paint the beginning stages of an art piece — like ”a printer that can pick up a brush” — to save time.

It wasn’t until Van Arman took part in the DARPA Grand Challenge, a prize competition for autonomous vehicles, that he was inspired to bring AI into his art.

Now, his robots are capable of creating artwork all on their own through the use of deep neural networks and feedback loops. Van Arman is never far away, though, sometimes pausing a robot to adjust its code and provide it some artistic guidance.

Van Arman’s work is on display in the AI Art Gallery at GTC 2020, and he’ll be giving conference attendees a virtual tour of his studio on Oct. 8 at 11 a.m. Pacific time.

Key Points From This Episode:

  • One of Van Arman’s most recent projects is artonomous, an artificially intelligent painting robot that is learning the subtleties of fine art. Anyone can submit their photo to be included in artonomous’ training set.
  • Van Arman predicts that AI will become even more creative, independent of its human creator. He predicts that AI artists will learn to program a variety of coexisting networks that give AI a greater understanding of what defines art.

Tweetables:

“I’m trying to understand myself better by exploring my own creativity — by trying to capture it in code, breaking it down and distilling it” — Pindar Van Arman [4:22]

“I’d say 50% of the paintings are completely autonomous, and 50% of the paintings are directed by me. 100% of them, though, are my art” — Pindar Van Arman [17:20]

You Might Also Like

How Tattoodo Uses AI to Help You Find Your Next Tattoo

Picture this, you find yourself in a tattoo parlor. But none of the dragons, flaming skulls, or gothic font lifestyle mottos you see on the wall seem like something you want on your body. So what do you do? You turn to AI, of course. We spoke to two members of the development team at Tattoodo.com, who created an app that uses deep learning to help you create the tattoo of your dreams.

UC Berkeley’s Pieter Abbeel on How Deep Learning Will Help Robots Learn

Robots can do amazing things. Compare even the most advanced robots to a three year old, however, and they can come up short. UC Berkeley Professor Pieter Abbeel has pioneered the idea that deep learning could be the key to bridging that gap: creating robots that can learn how to move through the world more fluidly and naturally.

How AI’s Storming the Fashion Industry

Costa Colbert — who holds degrees ranging from neural science to electrical engineering — is working at MAD Street Den to bring machine learning to fashion. He’ll explain how his team is using generative adversarial networks to create images of models wearing clothes.

Tune in to the AI Podcast

Get the AI Podcast through iTunes, Google Podcasts, Google Play, Castbox, DoggCatcher, Overcast, PlayerFM, Pocket Casts, Podbay, PodBean, PodCruncher, PodKicker, Soundcloud, Spotify, Stitcher and TuneIn. If your favorite isn’t listed here, drop us a note.

Tune in to the Apple Podcast Tune in to the Google Podcast Tune in to the Spotify Podcast

Make the AI Podcast Better

Have a few minutes to spare? Fill out this listener survey. Your answers will help us make a better podcast.

The post AI Artist Pindar Van Arman’s Painting Robots Visit GTC 2020 appeared first on The Official NVIDIA Blog.

Read More

Making cycling safer with AWS DeepLens and Amazon SageMaker object detection

Making cycling safer with AWS DeepLens and Amazon SageMaker object detection

According to the 2018 National Highway Traffic Safety Administration (NHTSA) Traffic Safety Facts, in 2018, there were 857 fatal bicycle and motor vehicle crashes and an additional estimated 47,000 cycling injuries in the US .

While motorists often accuse cyclists of being the cause of bike-car accidents, the analysis shows that this is not the case. The most common type of crash involved a motorist entering an intersection controlled by a stop sign or red light and either failing to stop properly or proceeding before it was safe to do so. The second most common crash type involved a motorist overtaking a cyclist unsafely. In fact, cyclists are the cause of less than 10% of bike-car accidents.  For more information, see Pedestrian and Bicycle Crash Types.

Many city cyclists are on the lookout for new ways to make cycling safer. In this post, you learn how to create a Smartcycle using two AWS DeepLens devices—one mounted on the front of your bicycle, the other mounted on the rear of the bicycle—to detect road hazards. You can visually highlight these hazards and play audio alerts corresponding to the road hazards detected. You can also track wireless sensor data about the ride, display metrics, and send that sensor data to the AWS Cloud using AWS IoT for reporting purposes.

This post discusses how the Smartcycle project turns an ordinary bicycle into an integrated platform capable of transforming raw sensor and video data into valuable insights by using AWS DeepLens, the Amazon SageMaker built-in object detection algorithm, and AWS Cloud technologies. This solution demonstrates the possibilities that machine learning solutions can bring to improve cycling safety and the overall ride experience for cyclists.

By the end of this post, you should have enough information to successfully deploy the hardware and software required to create your own Smartcycle implementation. The full instructions are available on the GitHub repo.

Smartcycle and AWS

AWS DeepLens is a deep learning-enabled video camera designed for developers to learn machine learning in a fun, hands-on way. You can order your own AWS DeepLens on Amazon.com (US), Amazon.ca (Canada), Amazon.co.jp (Japan), Amazon.de (Germany), Amazon.fr (France), Amazon.es (Spain), Amazon.it (Italy).

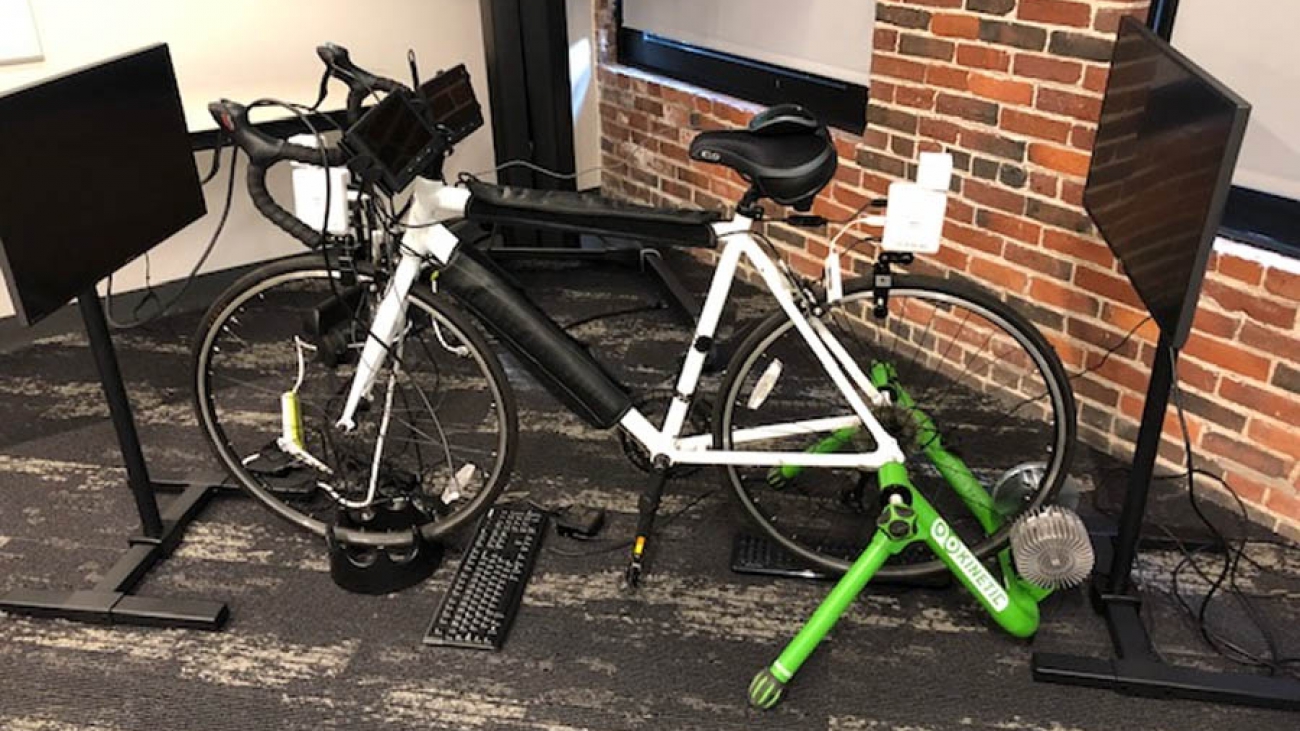
A Smartcycle has AWS DeepLens devices mounted on the front and back of the bike, which provide edge compute and inference capabilities, and wireless sensors mounted on the bike or worn by the cyclist to capture performance data that is sent back to the AWS Cloud for analysis.

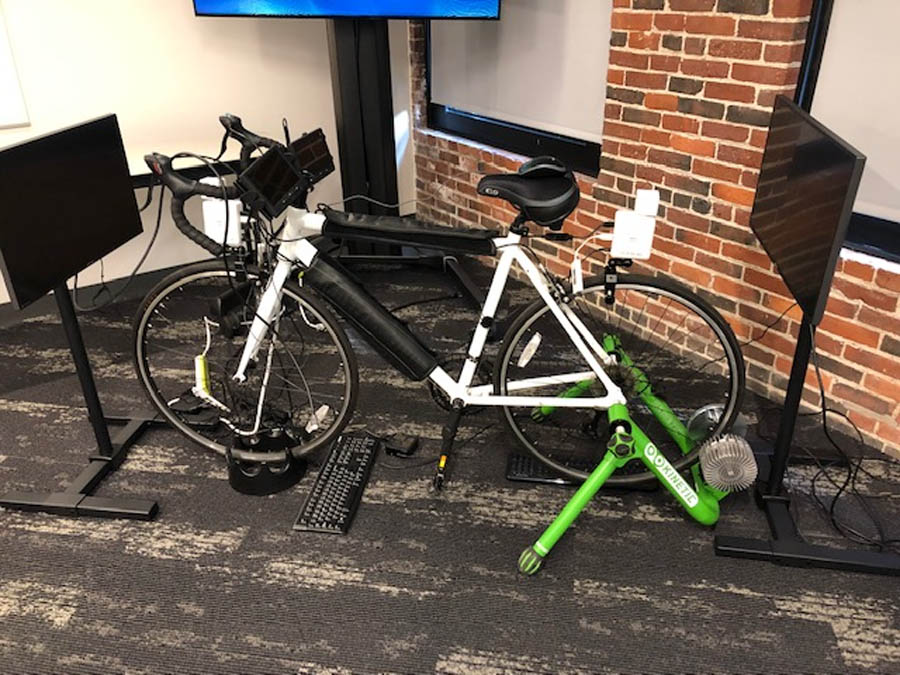
The following image is of the full Smartcycle bike setup.

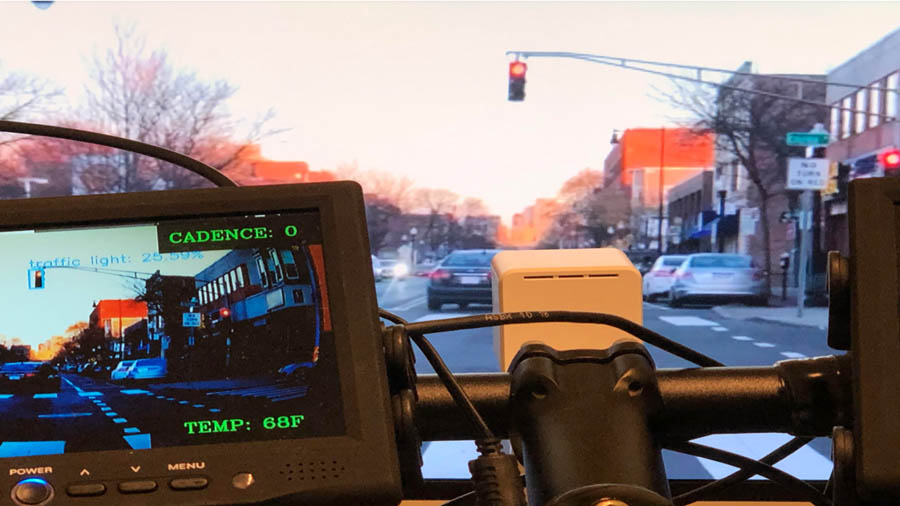
The following image is an example of AWS DeepLens rendered output from the demo video.

AWS IoT Greengrass seamlessly extends AWS to edge devices so they can act locally on the data they generate, while still using the AWS Cloud for management, analytics, and durable storage. With AWS IoT Greengrass, connected devices can run AWS Lambda functions, run predictions based on machine learning (ML) models, keep device data in sync, and communicate with other devices securely—even when not connected to the internet.

Amazon SageMaker is a fully managed ML service. With Amazon SageMaker, you can quickly and easily build and train ML models and directly deploy them into a production-ready hosted environment. Amazon SageMaker provides an integrated Jupyter notebook authoring environment for you to perform initial data exploration, analysis, and model building.

Amazon DynamoDB is a key-value and document database that delivers single-digit millisecond performance at any scale. It’s a fully managed, multi-Region, multi-master database with built-in security, backup and restore, and in-memory caching for internet-scale applications. Amazon DynamoDB is suitable for easily storing and querying the Smartcycle sensor data.

Solution overview

The following diagram illustrates the high-level architecture of the Smartcycle.

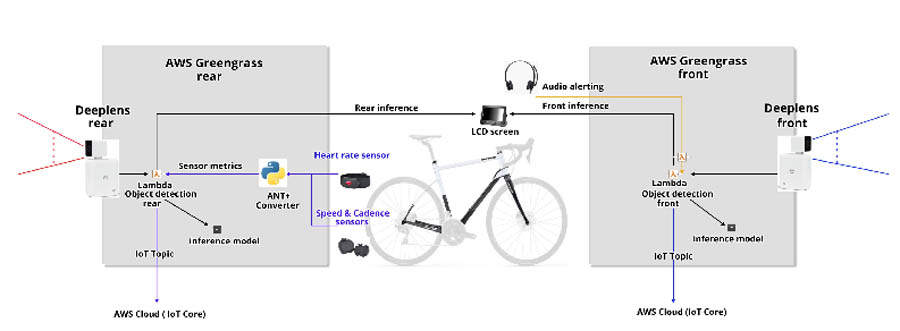
The architecture contains the following elements:

  • Two AWS DeepLens devices provide the compute, video cameras, and GPU-backed inference capabilities for the Smartcycle project, as well as a Linux-based operating system environment to work in.
  • A Python-based Lambda function (greengrassObjectDetector.py), running in the AWS IoT Greengrass container on each AWS DeepLens, takes the video stream input data from the built-in camera, splits the video into individual image frames, and references the custom object detection model artifact to perform the inference required to identify hazards using the doInference() function.
  • The doInference() function returns a probability score for each class of hazard object detected in an image frame; the object detection model is optimized for the GPU built into the AWS DeepLens device and the inference object detection happens locally.
  • The greengrassObjectDetector.py uses the object detection inference data to draw a graphical bounding box around each hazard detected and displays it back to the cyclist in the processed output video stream.
  • The Smartcycle has small LCD screens attached to display the processed video output.

The greengrassObjectDetector.py Lambda function running on both front and rear AWS DeepLens devices sends messages containing information about the detected hazards to the AWS IoT GreenGrass topic. Another Lambda function, called audio-service.py, subscribes to that IoT topic and plays an MP3 audio message for the type of object hazard detected (the MP3 files were created in advance using Amazon Polly). The audio-service.py function plays audio alerts for both front and rear AWS DeepLens devices (because both devices publish to a common IoT topic). Because of this, the audio-service.py function is usually run on the front-facing AWS DeepLens device only, which is plugged into a speaker or pair of headphones for audio output.

The Lambda functions and Python scripts running on the AWS DeepLens devices use a local Python database module called DiskCache to persist data and state information tracked by the Smartcycle. A Python script called multi_ant_demo.py runs on the front AWS DeepLens device from a terminal shell; this script listens for specific ANT+ wireless sensors (such as heart rate monitor, temperature, and speed) using a USB ANT+ receiver plugged into the AWS DeepLens. It processes and stores sensor metrics in the local DiskCache database using a unique key for each type of ANT+ sensor tracked. The greengrassObjectDetector.py function reads the sensor records from the local DiskCache database and renders that information as labels in the processed video stream (alongside the previously noted object detection bounding boxes).

With respect to sensor analytics, the greengrassObjectDetector.py function exchanges MQTT messages containing sensor data with AWS IoT Core. An AWS IoT rule created in AWS IoT Core inserts messages sent to the topic into the Amazon DynamoDB table. Amazon DynamoDB provides a persistence layer where data can be accessed using RESTful APIs. The solution uses a static webpage hosted on Amazon Simple Storage Service (Amazon S3) to aggregate sensor data for reporting. Javascript executed in your web browser sends and receives data from a public backend API built using Lambda and Amazon API Gateway. You can also use Amazon QuickSight to visualize hot data directly from Amazon S3.

Hazard object detection model

The Smartcycle project uses a deep learning object detection model built and trained using Amazon SageMaker to detect the following objects from two AWS DeepLens devices:

  • Front device – Stop signs, traffic lights, pedestrians, other bicycles, motorbikes, dogs, and construction sites
  • Rear device – Approaching pedestrians, cars, and heavy vehicles such as buses and trucks

The Object Detection AWS DeepLens Project serves as the basis for this solution, which is modified to work with the hazard detection model and sensor data.

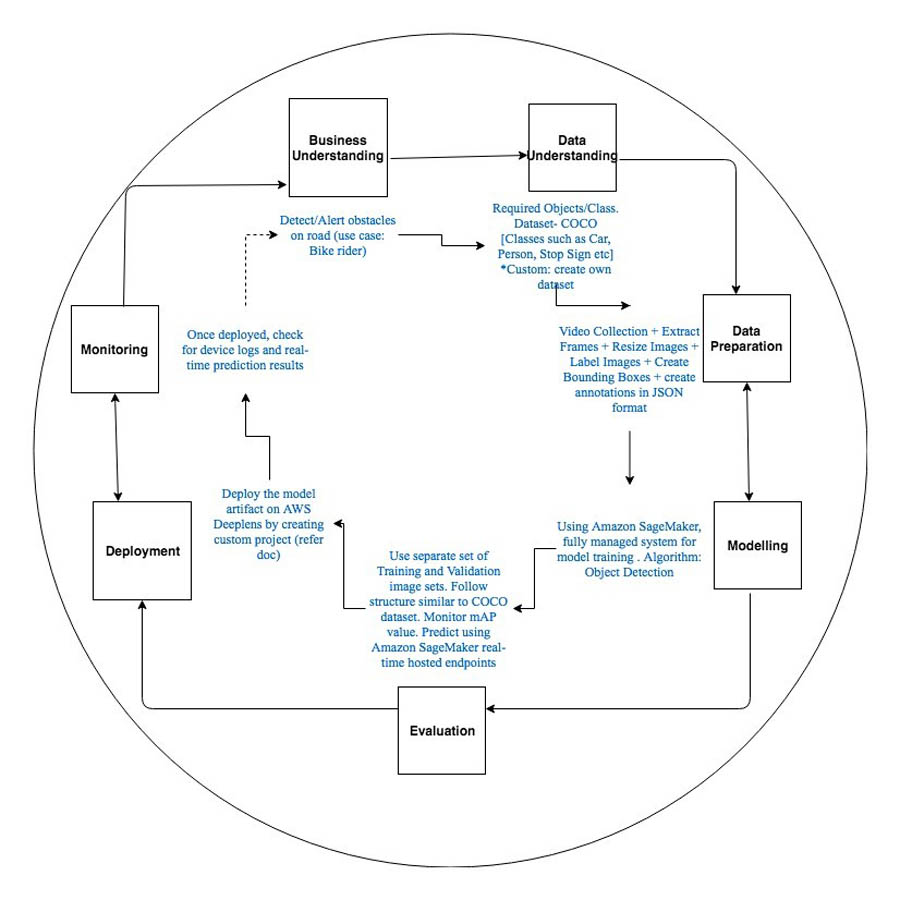
The Deep Learning Process for this solution includes the following:

  • Business understanding
  • Data understanding
  • Data preparation
  • Training the model
  • Evaluation
  • Model deployment
  • Monitoring

The following diagram illustrates the model development process.

Business Understanding

You use object detection to identify road hazards. You can localize objects such as stop signs, traffic lights, pedestrians, other bicycles, motorbikes, dogs, and more.

Understanding the Training Dataset

Object detection is the process of identifying and localizing objects in an image. The object detection algorithm takes image classification further by rendering a bounding box around the detected object in an image, while also identifying the type of object detected. Smartcycle uses the built-in Amazon SageMaker object detection algorithm to train the object detection model.

This solution uses the Microsoft Common Objects in Context (COCO) dataset. It’s a large-scale dataset for multiple computer vision tasks, including object detection, segmentation, and captioning. The training dataset train2017.zip includes 118,000 images (approximately 18 GB), and the validation dataset val2017.zip includes 5,000 images (approximately 1 GB).

To demonstrate the deep learning step using Amazon SageMaker, this post references the val2017.zip dataset  for training. However, with adequate infrastructure and time, you can also use the train2017.zip dataset and follow the same steps. If needed, you can also build and/or enhance on a custom dataset followed by data augmentation techniques or create a new class, such as construction or potholes, by collecting sufficient number of images representing that class. You can use Amazon SageMaker Ground Truth to provide the data annotation. Amazon SageMaker Ground Truth is a fully managed data labeling service that makes it easy to build highly accurate training datasets for machine learning. You can also label these images using image annotation tools such as RectLabel, preferably in PASCAL VOC format.

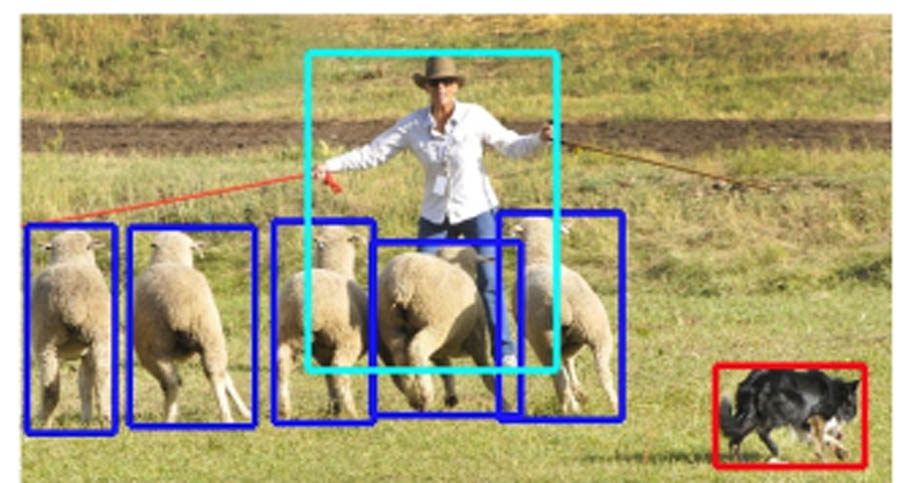
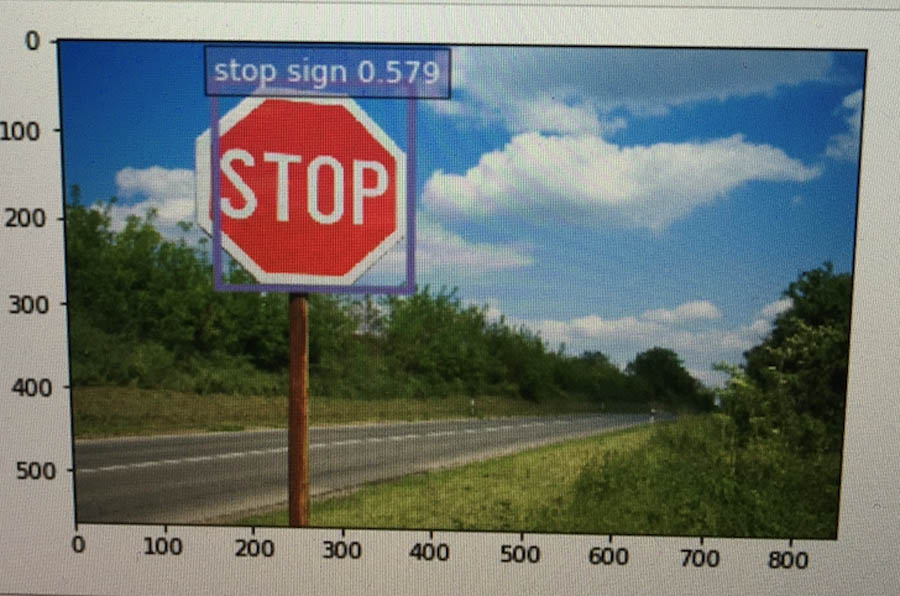
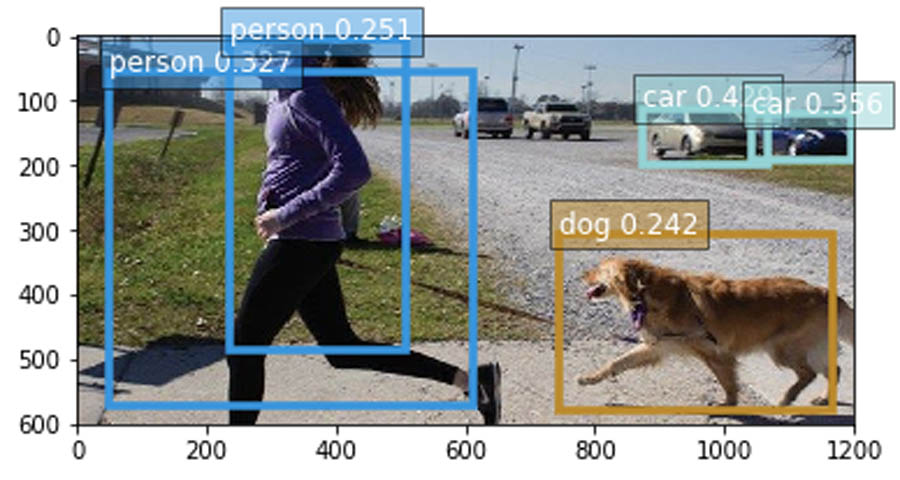
Here are some examples from Microsoft COCO: Common Objects in Context Study to help illustrate what object detection entails.

The following image is an example of object localization; there are bounding boxes over three different image classes.

The following image is an example of prediction results for a single detected object.

The following image is an example of prediction results for multiple objects.

Data Preparation

The sample notebook provides instructions on downloading the dataset (via the wget utility), followed by data preparation and training an object detection model using the Single Shot mlutibox Detector (SSD) algorithm.

Data preparation includes annotating each image within the training dataset, followed by a mapper job that can index the class from 0. The Amazon SageMaker object detection algorithm expects labels to be indexed from 0. You can use the fix_index_mapping function for this purpose. To avoid errors while training, you should also eliminate the images with no annotation files.

For validation purposes, you can split this dataset and create separate training and validation datasets. Use the following code:

train_jsons = jsons[:4452]
val_jsons = jsons[4452:]

Training the Model

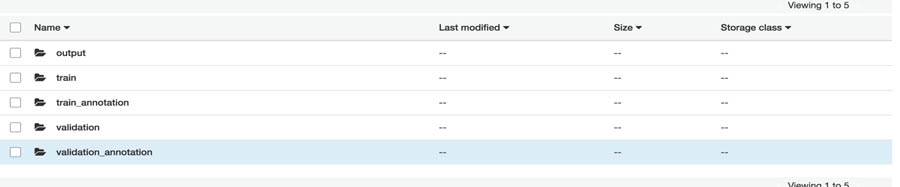
After you prepare the data, you need to host your dataset on Amazon S3. The built-in algorithm can read and write the dataset using multiple channels (for this use case, four channels). Channels are simply directories in the bucket that differentiate between training and validation data.

The following screenshot shows the Amazon S3 folder structure . It contains folders to hold the data and annotation files (the output folder stores the model artifacts).

When the data is available, you can train the object detector. The sageMaker.estimator.Estimator object can launch the training job for you. Use the following code:

od_model = sagemaker.estimator.Estimator(training_image,
role, train_instance_count=1, train_instance_type='ml.p3.16xlarge',
train_volume_size = 50,
train_max_run = 360000,
input_mode = 'File',
output_path=s3_output_location,
sagemaker_session=sess)

The Amazon SageMaker object detection algorithm requires you to train models on a GPU instance type such as ml.p3.2xlarge, ml.p3.8xlarge, or ml.p3.16xlarge.

The algorithm currently supports VGG-16 and ResNet-50 base neural nets. It also has multiple options for hyperparameters, such as base_network, learning_rate, epochs, lr_scheduler_step, lr_scheduler_factor, and num_training_samples, which help to configure the training job. The next step is to set up these hyperparameters and data channels to kick off the model training job. Use the following code:

od_model.set_hyperparameters(base_network=
'resnet-50',use_pretrained_model=1,
num_classes=80, mini_batch_size=16,
epochs=200, learning_rate=0.001,
lr_scheduler_step='10',
lr_scheduler_factor=0.1,
optimizer='sgd', momentum=0.9,
weight_decay=0.0005,
overlap_threshold=0.5,
nms_threshold=0.45,
image_shape=300, label_width=372,
num_training_samples=4452)

You can now create the sagemaker.session.s3_input objects from your data channels mentioned earlier, with content_type as image/jpeg for the image channels and the annotation channels. Use the following code:

train_data = sagemaker.session.s3_input(
s3_train_data, distribution='FullyReplicated', 
content_type='image/jpeg', s3_data_type='S3Prefix')

validation_data = sagemaker.session.s3_input(
s3_train_data, distribution='FullyReplicated', 
content_type='image/jpeg', s3_data_type='S3Prefix')

train_annotation =sagemaker.session.s3_input(
s3_train_annotation, distribution='FullyReplicated', 
content_type='image/jpeg', s3_data_type='S3Prefix')

validation_annotation = sagemaker.session
.s3_input(s3_train_annotation, distribution='FullyReplicated', 
content_type='image/jpeg', s3_data_type='S3Prefix')

data_channels = {'train': train_data, 'validation': validation_data, 'train_annotation': train_annotation, 'validation_annotation':validation_annotation} 

You can train the model with the data arranged in Amazon S3 as od_model.fit(inputs=data_channels, logs=True).

Model Evaluation

The displayed logs during training shows the mean average precision (mAP) on the validation data, among other metrics, and this metric can be used to infer the actual model performance. This metric is a proxy for the quality of the algorithm. Alternatively, you can also further evaluate the trained model on a separate set of test data.

Deploying the Model

When deploying an Amazon SageMaker-trained SSD model, you must first run deploy.py (available on GitHub) to convert the model artifact into a deployable format. After cloning or downloading the MXNet repository, enter the

git reset –hard 73d88974f8bca1e68441606fb0787a2cd17eb364 command before calling to convert the model, if the latest version doesn’t work.

To convert the model, execute the following command in your terminal:

python3 deploy.py --prefix <path> --data-shape 512 --num-class 80 --network resnet50 —epoch 500

After the model artifacts are converted, prepare to deploy the solution on AWS DeepLens. An AWS DeepLens project is a deep learning-based computer vision application. It consists of a trained, converted model and a Lambda function to perform inferences based on the model.

For more information, see Working with AWS DeepLens Custom Projects.

Monitoring

AWS DeepLens automatically configures AWS IoT Greengrass Logs. AWS IoT Greengrass Logs writes logs to Amazon CloudWatch Logs and to local file system of your device. For more information about CloudWatch and File Systems logs see AWS DeepLens Project Logs.

Sensor Integration and Analytics

In addition to detecting road hazards, the solution captures various forms of data from sensors attached to either the bicycle or the cyclist. Smartcycle uses ANT+ wireless sensors for this project for the following reasons:

  • The devices are widely available for cycling and other types of fitness equipment
  • The sensors themselves are inexpensive
  • ANT+ offers a mostly standardized non-proprietary approach for interpreting sensor data programmatically

For more information about ANT/ANT+ protocols, see the ANT+ website.

To capture the wireless sensor data, this solution uses a Python script that runs on an AWS DeepLens device, called multi_ant_demo.py. This script executes from a terminal shell on the AWS DeepLens device. For instructions on setting up and running this script, including dependencies, see the GitHub repo.

Each ANT+ sensor category has a specific configuration. For example, for heart rate sensors, you need to use a specific channel ID, period, and frequency (120, 57, and 8070, respectively). Use the following code:

#Channel 3  - Heartrate

self.channel3 = self.antnode.getFreeChannel()
self.channel3.name = 'C:HR'
self.channel3.assign('N:ANT+',
CHANNEL_TYPE_TWOWAY_RECEIVE)
self.channel3.setID(120, 0, 0)
self.channel3.setSearchTimeout(TIMEOUT_NEVER)
self.channel3.setPeriod(8070)
self.channel3.setFrequency(57)
self.channel3.open()

#Channel 4  - Temperature
self.channel4 = self.antnode.getFreeChannel()
self.channel4.name = 'C:TMP'
self.channel4.assign('N:ANT+',
CHANNEL_TYPE_TWOWAY_RECEIVE)
self.channel4.setID(25, 0, 0)
self.channel4.setSearchTimeout(TIMEOUT_NEVER)
self.channel4.setPeriod(8192)
self.channel4.setFrequency(57)
self.channel4.open()

As the multi_ant_demo.py function receives wireless sensor information, it interprets the raw data based on the sensor type the script recognizes to make it human-readable. The processed data is inserted into the local DiskCache database keyed on the sensor type. The greengrassObjectDetector.py function reads from the DiskCache database records to render those metrics on the AWS DeepLens video output stream. The function also sends the data to the IoT topic for further processing and persistence into Amazon DynamoDB for reporting.

Sensor Analytics

The AWS DeepLens devices that are registered for the project are associated with the AWS IoT cloud and authorized to publish messages to a unique IoT MQTT topic. In addition to showing the output video from the AWS DeepLens device, the solution also publishes sensor data to the MQTT topic. You also have a dynamic dashboard that makes use of Amazon DynamoDB, AWS Lambda, Amazon API Gateway, and a static webpage hosted in Amazon S3. In addition, you can query the hot data in Amazon S3 using pre-created Amazon Athena queries and visualize it in Amazon QuickSight.

The following diagram illustrates the analytics workflow.

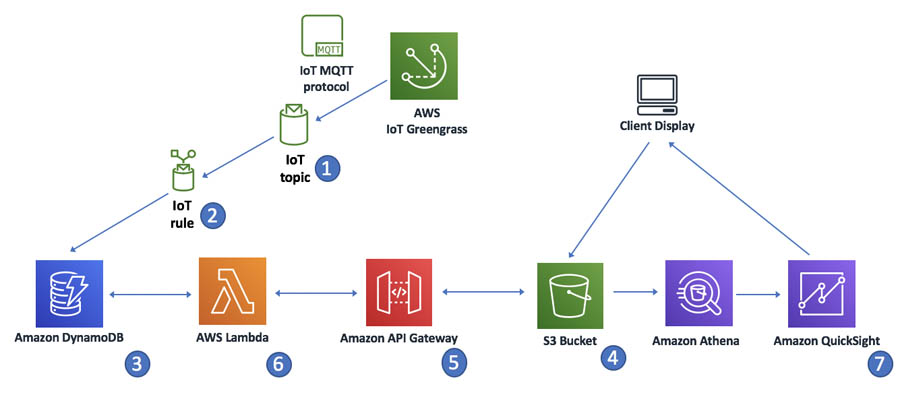
The workflow contains the following steps

  1. The Lambda function for AWS IoT Greengrass exchanges MQTT messages with AWS IoT Core.
  2. An IoT rule in AWS IoT Core listens for incoming messages from the MQTT topic. When the condition for the AWS IoT rule is met, it launches an action to send the message to the Amazon DynamoDB table.
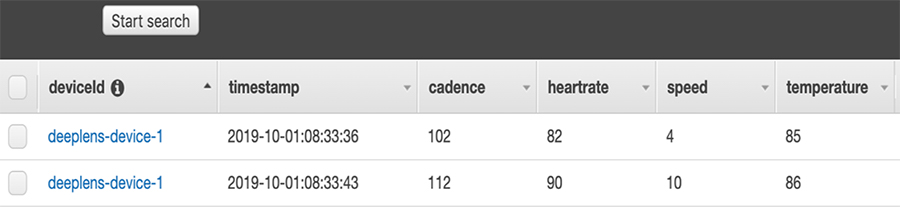
  3. Messages are sent to the Amazon DynamoDB table in a time-ordered sequence. The following screenshot shows an example of timestamped sensor data in Amazon DynamoDB.


  1. A static webpage on Amazon S3 displays the aggregated messages.
  2. The GET request triggers a Lambda function to select the most recent records in the Amazon DynamoDB table and cache them in the static website.
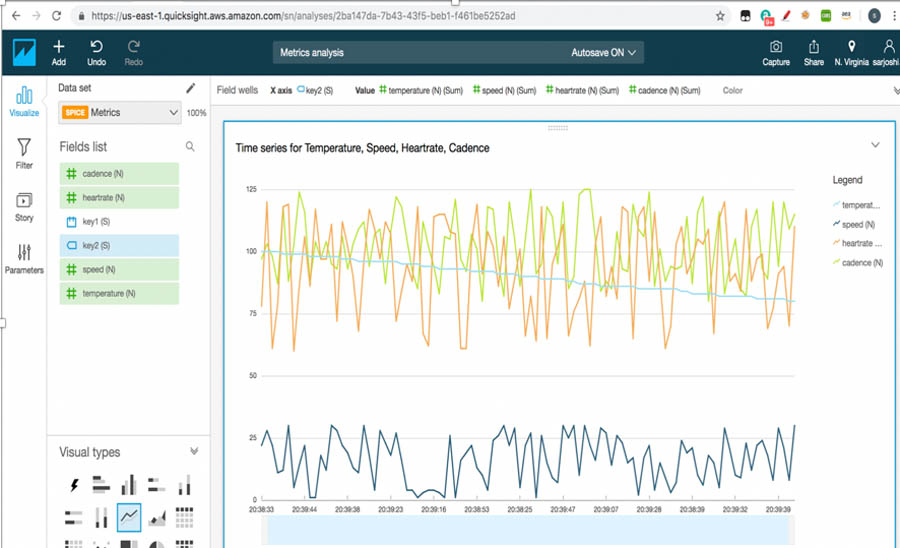
  3. Amazon QuickSight provides data visualizations and one-time queries from Amazon S3 directly. The following screenshot shows an example of a near-real time visualization using Amazon QuickSight.

Conclusion

This post explained how to use an AWS DeepLens and the Amazon SageMaker built-in object detection algorithm to detect and localize obstacles while riding a bicycle. For instructions on implementing this solution, see the GitHub repo. You can also clone and extend this solution with additional data sources for model training. Users that implement this solution should do so at their own risk. As with all cycling activities, remember to always obey all applicable laws when cycling.

References


About the Authors

Sarita Joshi is a AI/ML Architect with AWS Professional Services. She has a Master’s Degree in Computer Science, Specialty Data from Northeastern University and has several years of experience as a consultant advising clients across many industries and technical domain – AI, ML, Analytics, SAP. Today she is passionately working with customers to develop and implement machine learning and AI solutions on AWS.


David Simcik is an AWS Solutions Architect focused on supporting ISV customers and is based out of Boston. He has experience architecting solutions in the areas of analytics, IoT, containerization, and application modernization. He holds a M.S. in Software Engineering from Brandeis University and a B.S. in Information Technology from the Rochester Institute of Technology.


Andrea Sabet leads a team of solutions architects supporting customers across the New York Metro region. She holds a M.Sc. in Engineering Physics and a B.Sc in Electrical Engineering from Uppsala University, Sweden.


Read More

Predicting Defender Trajectories in NFL’s Next Gen Stats

Predicting Defender Trajectories in NFL’s Next Gen Stats

NFL’s Next Gen Stats (NGS) powered by AWS accurately captures player and ball data in real time for every play and every NFL game—over 300 million data points per season—through the extensive use of sensors in players’ pads and the ball. With this rich set of tracking data, NGS uses AWS machine learning (ML) technology to uncover deeper insights and develop a better understanding of various aspects and trends of the game. To date, NGS metrics have focused on helping fans better appreciate and understand the offense and defense in gameplay through the application of advanced analytics, particularly in the passing game. Thanks to tracking data, it’s possible to quantify the difficulty of passes, model expected yards after catch, and determine the value of various play outcomes. A logical next step with this analytical information is to evaluate quarterback decision-making, such as whether the quarterback has considered all eligible receivers and evaluated tradeoffs accurately.

To effectively model quarterback decision-making, we considered a few key metrics—mainly the probability of different events occurring on a pass, and the value of said events. A pass can result in three outcomes: completion, incompletion, or interception. NGS has already created models that provide probabilities of these outcomes, but these events rely on information that’s available at only two points during the play: when the ball is thrown (termed as pass-forward), and when the ball arrives to a receiver (pass-arrived). Because of this, creating accurate probabilities requires modeling the trajectory of players between those two points in time.

For these probabilities, the quarterback’s decision is heavily influenced by the quality of defensive coverage on various receivers, because a receiver with a closely covered defender has a lower likelihood of pass completion compared to a receiver who is wide open due to blown coverage. Furthermore, defenders are inherently reactive to how the play progresses. Defenses move in completely different ways depending on which receiver is targeted on the pass. This means that a trajectory model for defenders has to similarly be reactive to the specified targeted receiver in a believable manner.

The following diagram is a top-down view of a play, with the blue circles representing offensive players and red representing the defensive players. The dotted red lines are examples of projected player trajectories. For the highlighted defender, their trajectory depends on who the targeted receiver is (13 to the left or 81 to the right).

With the help of Amazon ML Solutions Lab, we have jointly developed a model that successfully uses this tracking data to provide league-average predictions of defender trajectories. Specifically, we predict the trajectories of defensive backs from when the pass is thrown to when the pass should arrive to the receiver. Our methodology for this is a deep-learning sequence model, which we call our Defender Ghosting model. In this post, we share how we developed an ML model to predict defender trajectories (first describing the data preprocessing and feature engineering, followed by a description of the model architecture), and metrics to evaluate the quality of these trajectory predictions.

Data and feature engineering

We primarily use data from recent seasons of 2018 and 2019 to train and test the ML models that predict the defender position (x, y) and speed (s). The sensors in the players’ shoulder pads provide information on every player on the field in increments of 0.1 second; tracking devices in the football provide additional information. This provides a relatively large feature set over multiple time steps compared to the number of observations, and we decided to also evaluate feature importance to guide modeling decisions. We didn’t consider any team-specific or player-specific features, in order to have a player-agnostic model. We evaluated information such as down number, yards to first down, and touchdown during the feature selection phase, but they weren’t particularly useful for our analysis.

The models predict location and speed up to 15 time steps ahead (t + 15 steps), or 1.5 seconds after the quarterback releases the ball, also known as pass-forward. For passes longer than 1.5 seconds, we use the same model to predict beyond (t + 15) location and speed with the starting time shifted forward and resultant predictions concatenated together. The input data contains player and ball information up to five-time steps prior (t, t-1, …, t-5). We randomly segmented the train-test split by plays to prevent information leak within a single play.

We used an XGBoost model to explore and sub-select a variety of raw and engineered features, such as acceleration, personnel on the field for each play, location of the player a few time steps prior, direction and orientation of the players in motion, and ball trajectory. Useful feature engineering steps include differencing (which stationarize the time series) and directional decomposition (which decomposes a player’s rotational direction into x and y, respectively).

We trained the XGBoost model using Amazon SageMaker, which allows developers to quickly build, train, and deploy ML models. You can quickly and easily achieve model training by uploading the training data to an Amazon Simple Storage Service (Amazon S3) bucket and launching an Amazon SageMaker notebook. See the following code:

# format dataframe, target then features
output_label = target + str(ts)
all_columns = [output_label]
all_columns.extend(feature_lst)

# write training data to file
prefix = main_foldername + '/' + output_label
train_df_tos3 = train_df.loc[:, all_columns]
print(train_df_tos3.head())

if not os.path.isdir('./tmp'):
    os.makedirs('./tmp')

train_df_tos3.to_csv('./tmp/cur_train_df.csv', index=False, header=False)
s3.upload_file('./tmp/cur_train_df.csv', bucketname, f'{prefix}/train/train.csv')

# get pointer to file
s3_input_train = sagemaker.s3_input(
    s3_data='s3://{}/{}/train'.format(bucketname, prefix), content_type='csv')

start_time = time.time()

# setup training
xgb = sagemaker.estimator.Estimator(
    container,
    role,
    train_instance_count=1,
    train_instance_type='ml.m5.12xlarge',
    output_path='s3://{}/{}/output'.format(bucketname, prefix),
    sagemaker_session=sess)

xgb.set_hyperparameters(max_depth=5, num_round=20, objective='reg:linear')
xgb.fit({'train': s3_input_train})

# find model name
model_name = xgb.latest_training_job.name
print(f'model_name:{model_name}')
model_path = 's3://{}/{}/output/{}/output/model.tar.gz'.format(
    bucketname, prefix, model_name)

You can easily achieve inferencing by deploying this model to an endpoint:

from sagemaker.predictor import csv_serializer
xgb_predictor = xgb.deploy(initial_instance_count = 1,
                           instance_type = 'ml.m4.xlarge')
xgb_predictor.content_type = 'text/csv'
xgb_predictor.serializer = csv_serializer
xgb_predictor.deserializer = None


## Function to chunk down test set into smaller increments
def predict(data, model, rows=500):
	split_array = np.array_split(data, int(data.shape[0] / float(rows) + 1))
	predictions = ''
	for array in split_array:
	     predictions = ','.join([predictions, model.predict(array).decode('utf-8')])

	return np.fromstring(predictions[1:], sep=',')

## Generate predictions on the test set for the difference models
predictions = predict(test_df[feature_lst].astype(float).values, xgb_predictor)

xgb_predictor.delete_endpoint()        
xgb.fit({'train': s3_input_train})

You can easily extract feature importance from the trained XGBoost model, which is by default saved in a tar.gz format, using the following code:

tar = tarfile.open(local_model_path)
tar.extractall(local_model_dir)
tar.close()

print(local_model_dir)
with open(local_model_dir + '/xgboost-model', 'rb') as f:
	model = pkl.load(f)

model.feature_names = all_columns[1:] #map names correctly

fig, ax = plt.subplots(figsize=(12,12))
xgboost.plot_importance(model, 
						importance_type='gain',
						max_num_features=10,
						height=0.8, 
						ax=ax, 
						show_values = False)
plt.title(f'Feature Importance: {target}')
plt.show()              

The following graph shows an example of the resultant feature importance plot.


Deep learning model for predicting defender trajectory

We used a multi-output XGBoost model as the baseline or benchmark model for comparison, with each target (x, y, speed) considered individually. In all three targets, we trained the models using Amazon SageMaker over 20–25 epochs with batch sizes of 256, using the Adam optimizer and mean squared error (MSE) loss, and achieved about two times better root mean squared error (RMSE) values compared to the baseline models.

The model architecture consists of a one-dimensional convolutional neural network (1D-CNN) and a long short-term memory (LSTM), as shown in the following diagram. The 1D-CNN block sizes extract time-dependent information from the features over different time scales, and dimensionality is subsequently reduced by max pooling. The concatenated vectors are then passed to an LSTM with a fully connected output layer to generate the output sequence.

The following diagram is a schematic of the Defender Ghosting deep learning model architecture. We evaluated models independently predicting each of the targets (x, y, speed) as well as jointly, and the model with independent targets slightly outperformed the joint model.


The code defining the model in Keras is as follows:

# define the model
def create_cnn_lstm_model_functional(n_filter=32, kw=1):
    """

    :param n_filter: number of filters to use in convolution layer
    :param kw: filter kernel size
    :return: compiled model
    """
    input_player = Input(shape=(4, 25))
    input_receiver = Input(shape=(19, 25))
    input_ball = Input(shape=(19, 13))

    submodel_player = Conv1D(filters=n_filter, kernel_size=kw, activation='relu')(input_player)
    submodel_player = GlobalMaxPooling1D()(submodel_player)

    submodel_receiver = Conv1D(filters=n_filter, kernel_size=kw, activation='relu')(input_receiver)
    submodel_receiver = GlobalMaxPooling1D()(submodel_receiver)

    submodel_ball = Conv1D(filters=n_filter, kernel_size=kw, activation='relu')(input_ball)
    submodel_ball = GlobalMaxPooling1D()(submodel_ball)

    x = Concatenate()([submodel_player, submodel_receiver, submodel_ball])
    x = RepeatVector(15)(x)
    x = LSTM(50, activation='relu', return_sequences=True)(x)
    x = TimeDistributed(Dense(10, activation='relu'))(x)
    x = TimeDistributed(Dense(1))(x)
    
    model = Model(inputs=[input_player, input_receiver, input_ball], outputs=x)
    model.compile(optimizer='adam', loss='mse')

    return model

Evaluating defender trajectory

We developed custom metrics to quantify performance of a defender’s trajectory relative to the targeted receiver. The typical ideal behavior of a defender, from the moment the ball leaves the quarterback’s hands, is to rush towards the targeted receiver and ball. With that knowledge, we define the positional convergence (PS) metric as the weighted average of the rate of change of distance between the two players. When equally weighted across all time steps, the PS metric indicates that the two players are:

  • Spatially converging when negative
  • Zero when running in parallel
  • Spatially diverging (moving away from each other) when positive

The following schematic shows the position of a targeted receiver and predicted defender trajectory at four time steps. The distance at each time step is denoted in arrows, and we use the average rate of change of this distance to compute the PS metric.

The PS metric alone is insufficient to evaluate the quality of a play, because a defender could be running too slowly towards the targeted receiver. The PS metric is thus modulated by another metric, termed the distance ratio (DR). The DR approximates the optimal distance that a defender should cover and rewards trajectories that indicate that the defender has covered close to optimal or humanly possible distances. This is approximated by calculating the distance between the defender’s location pass-forward and the position of the receiver at pass-arrived.

Putting this together, we can score every defender trajectory as a combination of PS and DR, and we apply a constraint for any predictions that exceed the maximum humanly possible distance, speed, and acceleration. The quality of a defensive play, called defensive play score, is a weighted average of every defender trajectory within the play. Defenders close to the targeted receiver are weighted higher than defenders positioned far away from the targeted receiver, because the close defenders’ actions have the most ability to influence the outcome of the play. Aggregating the scores of all the defensive plays provides a quantitative measure of how well models perform relative to each other, as well as compared to real plays. In the case of the deep learning model, the overall score was similar to the score computed from real plays and indicative that the model had captured realistic and desired defensive characteristics.

Evaluating a model’s performance after changing the targeted receiver from the actual events in the play proved to be more challenging, because there was no actual data to help determine the quality of our predictions. We shared the modified trajectories with football experts within NGS to determine the validity of the trajectory change; they deemed the trajectories reasonable. Features that were important to reasonable trajectory changes include ball information, the targeted receiver’s location relative to the defender, and the direction of the receiver. For both baseline and deep learning models, increasing the number of previous time steps in the inputs to the model beyond three time steps increased the model’s dependency on previous trajectories and made trajectory changes much harder.

Summary

The quarterback must very quickly scan the field during a play and determine the optimal receiver to target. The defensive backs are also observing and moving in response to the receivers’ and quarterback’s actions to put an end to the offensive play. Our Defender Ghosting model, which Amazon ML Solutions Lab and NFL NGS jointly developed, successfully uses tracking data from both players and the ball to provide league-wide predictions based on prior trajectory and the hypothetical receiver on the play.

You can find full, end-to-end examples of creating custom training jobs, training state-of-the-art object detection and tracking models, implementing hyperparameter optimization (HPO), and deploying models on Amazon SageMaker at the AWSLabs GitHub repo. If you’d like help accelerating your use of ML, please contact the Amazon ML Solutions Lab program.


About the Authors

Lin Lee Cheong is a Senior Scientist and Manager with the Amazon ML Solutions Lab team at Amazon Web Services. She works with strategic AWS customers to explore and apply artificial intelligence and machine learning to discover new insights and solve complex problems.  


Ankit Tyagi is a Senior Software Engineer with the NFL’s Next Gen Stats team. He focuses on backend data pipelines and machine learning for delivering stats to fans. Outside of work, you can find him playing tennis, experimenting with brewing beer, or playing guitar.


Xiangyu Zeng is an Applied Scientist with the Amazon ML Solution Lab team at Amazon Web Services. He leverages Machine Learning and Deep Learning to solve critical real-word problems for AWS customers. He loves sports, especially basketball and football in his spare time.


Michael Schaefer is the Director of Product and Analytics for NFL’s Next Gen Stats. His work focuses on the design and execution of statistics, applications, and content delivered to NFL Media, NFL Broadcaster Partners, and fans.


Michael Chi is the Director of Technology for NFL’s Next Gen Stats. He is responsible for all technical aspects of the platform which is used by all 32 clubs, NFL Media and Broadcast Partners. In his free time, he enjoys being outdoors and spending time with his family


Mehdi Noori is a Data Scientist at the Amazon ML Solutions Lab, where he works with customers across various verticals, and helps them to accelerate their cloud migration journey, and to solve their ML problems using state-of-the-art solutions and technologies.


Read More

Amazon SageMaker price reductions: Up to 18% lower prices on ml.p3 and ml.p2 instances

Amazon SageMaker price reductions: Up to 18% lower prices on ml.p3 and ml.p2 instances

Effective October 1st, 2020, we’re reducing the prices for ml.p3 and ml.p2 instances in Amazon SageMaker by up to 18% so you can maximize your machine learning (ML) budgets and innovate with deep learning using these accelerated compute instances. The new price reductions apply to ml.p3 and ml.p2 instances of all sizes for Amazon SageMaker Studio notebooks, on-demand notebooks, processing, training, real-time inference, and batch transform.

Customers including Intuit, Thompson Reuters, Cerner, and Zalando are already reducing their total cost of ownership (TCO) by at least 50% using Amazon SageMaker. Amazon SageMaker removes the heavy lifting from each step of the ML process and makes it easy to apply advanced deep learning techniques at scale. Amazon SageMaker provides lower TCO because it’s a fully managed service, so you don’t need to build, manage, or maintain any infrastructure and tooling for your ML workloads. Amazon SageMaker also has built-in security and compliance capabilities including end-to-end encryption, private network connectivity, AWS Identity and Access Management (IAM)-based access controls, and monitoring so you don’t have to build and maintain these capabilities, saving you time and cost.

We designed Amazon SageMaker to offer costs savings at each step of the ML workflow. For example, Amazon SageMaker Ground Truth customers are saving up to 70% in data labeling costs. When it’s time for model building, many cost optimizations are also built into the training process. For example, you can use Amazon SageMaker Studio notebooks, which enable you to change instances on the fly to scale the compute up and down as your demand changes to optimize costs.

When training ML models, you can take advantage of Amazon SageMaker Managed Spot Training, which uses spare compute capacity to save up to 90% in training costs. See how Cinnamon AI saved 70% in training costs with Managed Spot Training.

In addition, Amazon SageMaker Automatic Model Tuning uses ML to find the best model based on your objectives, which reduces the time needed to get to high-quality models. See how Infobox is using Amazon SageMaker Automatic Model Tuning to scale while also improving model accuracy by 96.9%.

When it’s time to deploy ML models in production, Amazon SageMaker multi-model endpoints (MME) enable you to deploy from tens to tens of thousands of models on a single endpoint to reduce model deployment costs and scale ML deployments. For more information, see Save on inference costs by using Amazon SageMaker multi-model endpoints.

Also, when running data processing jobs on Amazon SageMaker Processing, model training on Amazon SageMaker Training, and offline inference with batch transform, you don’t manage any clusters or have high utilization of your instances, and you only pay for the compute resources for the duration of the jobs.

Price reductions for ml.p3 and ml.p2 instances, optimized for deep learning

Customers are increasingly adopting deep learning techniques to accelerate their ML workloads. Amazon SageMaker offers built-in implementations of the most popular deep learning algorithms, such as object detection, image classification, semantic segmentation, and deep graph networks, in addition to the most popular ML frameworks such as TensorFlow, MxNet, and PyTorch. Whether you want to run single-node training or distributed training, you can use Amazon SageMaker Debugger to identifies complex issues developing in ML training jobs and use Managed Spot Training to lower deep learning costs by up to 90%.

Amazon SageMaker offers the best-in-class ml.p3 and ml.p2 instances for accelerated compute, which can significantly accelerate deep learning applications to reduce training and processing times from days to minutes. The ml.p3 instances offer up to eight of the most powerful GPU available in the cloud, with up to 64 vCPUs, 488 GB of RAM, and 25 Gbps networking throughput. The ml.p3dn.24xlarge instances provide up to 100 Gbps of networking throughput, significantly improving the throughput and scalability of deep learning training models, which leads to faster results.

Effective October 1st, 2020, we’re reducing the price up to 18% on all ml.p3 and ml.p2 instances in Amazon SageMaker, making them an even more cost-effective solution to meet your ML and deep learning needs. The new price reductions apply to ml.p3 and ml.p2 instances of all sizes for Amazon SageMaker Studio notebooks, on-demand notebooks, processing, training, real-time inference, and batch transform.

The price reductions for the specific instance types are as follows:

Instance Type Price Reduction
ml.p2.xlarge 11%
ml.p2.8xlarge 14%
ml.p2.16xlarge 18%
ml.p3.2xlarge 11%
ml.p3.8xlarge 14%
ml.p3.16xlarge 18%
ml.p3dn.24xlarge 18%

The price reductions are available in the following AWS Regions:

  • US East (Ohio)
  • US East (N. Virginia)
  • US West (Oregon)
  • Asia Pacific (Singapore)
  • Asia Pacific (Sydney)
  • Asia Pacific (Seoul)
  • Asia Pacific (Tokyo)
  • Asia Pacific (Mumbai)
  • Canada (Central)
  • EU (Frankfurt)
  • EU (Ireland)
  • EU (London)
  • AWS GovCloud (US-West)

Conclusion

We’re very excited to make ML more cost-effective and accessible. For more information about the latest pricing information for these instances in each Region, see Amazon SageMaker Pricing.


About the Author

Urvashi Chowdhary is a Principal Product Manager for Amazon SageMaker. She is passionate about working with customers and making machine learning more accessible. In her spare time, she loves sailing, paddle boarding, and kayaking.

Read More

Fernanda Viégas puts people at the heart of AI

Fernanda Viégas puts people at the heart of AI

When Fernanda Viégas was in college, it took three years with three different majors before she decided she wanted to study graphic design and art history. And even then, she couldn’t have imagined the job she has today: building artificial intelligence and machine learning with fairness and transparency in mind to help people in their daily lives.  

Today Fernanda, who grew up in Rio de Janeiro, Brazil, is a senior researcher at Google. She’s based in London, where she co-leads the global People + AI Research (PAIR) Initiative, which she co-founded with fellow senior research scientist Martin M. Wattenberg and Senior UX Researcher Jess Holbrook, and the Big Picture team. She and her colleagues make sure people at Google think about fairness and values–and putting Google’s AI Principlesinto practice–when they work on artificial intelligence. Her team recently launched a seriesof “AI Explorables,”a collection of interactive articles to better explain machine learning to everyone. 

When she’s not looking into the big questions around emerging technology, she’s also an artist, known for her artistic collaborations with Wattenberg. Their data visualization art is a part of the permanent collection of the Museum of Modern Art in New York.  

I recently sat down with Fernanda via Google Meet to talk about her role and the importance of putting people first when it comes to AI. 

How would you explain your job to someone who isn’t in tech?

As a research scientist, I try to make sure that machine learning (ML) systems can be better understood by people, to help people have the right level of trust in these systems. One of the main ways in which our work makes its way to the public is through the People + AI Guidebook, a set of principles and guidelines for user experience (UX) designers, product managers and engineering teams to create products that are easier to understand from a user’s perspective.

What is a key challenge that you’re focusing on in your research? 

My team builds data visualization tools that help people building AI systems to consider issues like fairness proactively, so that their products can work better for more people. Here’s a generic example: Let’s imagine it’s time for your coffee break and you use an app that uses machine learning for recommendations of coffee places near you at that moment. Your coffee app provides 10 recommendations for cafes in your area, and they’re all well-rated. From an accuracy perspective, the app performed its job: It offered information on a certain number of cafes near you. But it didn’t account for unintended unfair bias. For example: Did you get recommendations only for large businesses? Did the recommendations include only chain coffee shops? Or did they also include small, locally owned shops? How about places with international styles of coffee that might be nearby? 

The tools our team makes help ensure that the recommendations people get aren’t unfairly biased. By making these biases easy to spot with engaging visualizations of the data, we can help identify what might be improved. 

What inspired you to join Google? 

It’s so interesting to consider this because my story comes out of repeated failures, actually! When I was a student in Brazil, where I was born and grew up, I failed repeatedly in figuring out what I wanted to do. After spending three years studying for different things—chemical engineering, linguistics, education—someone said to me, “You should try to get a scholarship to go to the U.S.” I asked them why I should leave my country to study somewhere when I wasn’t even sure of my major. “That’s the thing,” they said. “In the U.S. you can be undecided and change majors.” I loved it! 

So I went to the U.S. and by the time I was graduating, I decided I loved design but I didn’t want to be a traditional graphic designer for the rest of my life. That’s when I heard about the Media Lab at MIT and ended up doing a master’s degree and PhD in data visualization there. That’s what led me to IBM, where I met Martin M. Wattenberg. Martin has been my working partner for 15 years now; we created a startup after IBM and then Google hired us. In joining, I knew it was our chance to work on products that have the possibility of affecting the world and regular people at scale. 

Two years ago, we shared our seven AI Principles to guide our work. How do you apply them to your everyday research?

One recent example is from our work with the Google Flights team. They offered users alerts about the “right time to buy tickets,” but users were asking themselves, Hmm, how do I trust this alert?  So the designers used our PAIR Guidebook to underscore the importance of AI explainability in their discussions with the engineering team. Together, they redesigned the feature to show users how the price for a flight has changed over the past few months and notify them when prices may go up or won’t get any lower. When it launched, people saw our price history graph and responded very well to it. By using our PAIR Guidebook, the team learned that how you explain your technology can significantly shape the user’s trust in your system. 

Historically, ML has been evaluated along the lines of mathematical metrics for accuracy—but that’s not enough. Once systems touch real lives, there’s so much more you have to think about, such as fairness, transparency, bias and explainability—making sure people understand why an algorithm does what it does. These are the challenges that inspire me to stay at Google after more than 10 years. 

What’s been one of the most rewarding moments of your career?

Whenever we talk to students and there are women and minorities who are excited about working in tech, that’s incredibly inspiring to me. I want them to know they belong in tech, they have a place here. 

Also, working with my team on a Google Doodle about the composer Johann Sebastian Bach last year was so rewarding. It was the very first time Google used AI for a Doodle and it was thrilling to tell my family in Brazil, look, there’s an AI Doodle that uses our tech! 

How should aspiring AI thinkers and future technologists prepare for a career in this field? 

Try to be deep in your field of interest. If it’s AI, there are so many different aspects to this technology, so try to make sure you learn about them. AI isn’t just about technology. It’s always useful to be looking at the applications of the technology, how it impacts real people in real situations.

Read More