By plotting nonlinear trajectories through a GAN’s latent space, the method enables certain image attributes to vary while others are held fixed.Read More
Automated exploratory data analysis and model operationalization framework with a human in the loop
Identifying, collecting, and transforming data is the foundation for machine learning (ML). According to a Forbes survey, there is widespread consensus among ML practitioners that data preparation accounts for approximately 80% of the time spent in developing a viable ML model.
In addition, many of our customers face several challenges during the model operationalization phase to accelerate the journey from model conceptualization to productionization. Quite often, models are built and deployed using poor-quality, under-representative data samples, which leads to more iterations and more manual effort in data inspection, which in turn makes the process more time consuming and cumbersome.
Because your models are only as good as your training data, expert data scientists and practitioners spend an enormous time understanding the data and generating valuable insights prior to building the models. If we view our ML models as an analogy to cooking a meal, the importance of high-quality data for an advanced ML system is similar to the relationship between high-quality ingredients and a successful meal. Therefore, before rushing into building the models, make sure you’re spending enough time getting high-quality data and extracting relevant insights.
The tools and technologies to assist with data preprocessing have been growing over the years. Now we have low-code and no-code tools like Amazon SageMaker Data Wrangler, AWS Glue DataBrew, and Amazon SageMaker Canvas to assist with data feature engineering.
However, a lot of these processes are still currently done manually by a data engineer or analyst who analyzes the data using these tools. If their the knowledge of the tools is limited, the insights generated prior to building the models won’t do justice to all the steps that can be performed. Additionally, we won’t be able to make an informed decision post-analysis of those insights prior to building the ML models. For instance, the models can turn out to be biased due to lack of detailed insights that you received using AWS Glue or Canvas, and you end up spending a lot of time and resources building the model training pipeline, to eventually receive an unsatisfactory prediction.
In this post, we introduce a novel intelligent framework for data and model operationalization that provides automated data transformations and optimal model deployment. This solution can accelerate accurate and timely inspection of data and model quality checks, and facilitate the productivity of distinguished data and ML teams across your organization.
Overview of solution
Our solution demonstrates an automated end-to-end approach to perform exploratory data analysis (EDA) with a human in the loop to determine the model quality thresholds and approve the optimal and qualified data to be pushed into Amazon SageMaker Pipelines in order to push the final data into Amazon SageMaker Feature Store, thereby speeding up the executional framework.
Furthermore, the approach includes deploying the best candidate model and creating the model endpoint on the transformed dataset that was automatically processed as new data arrives in the framework.
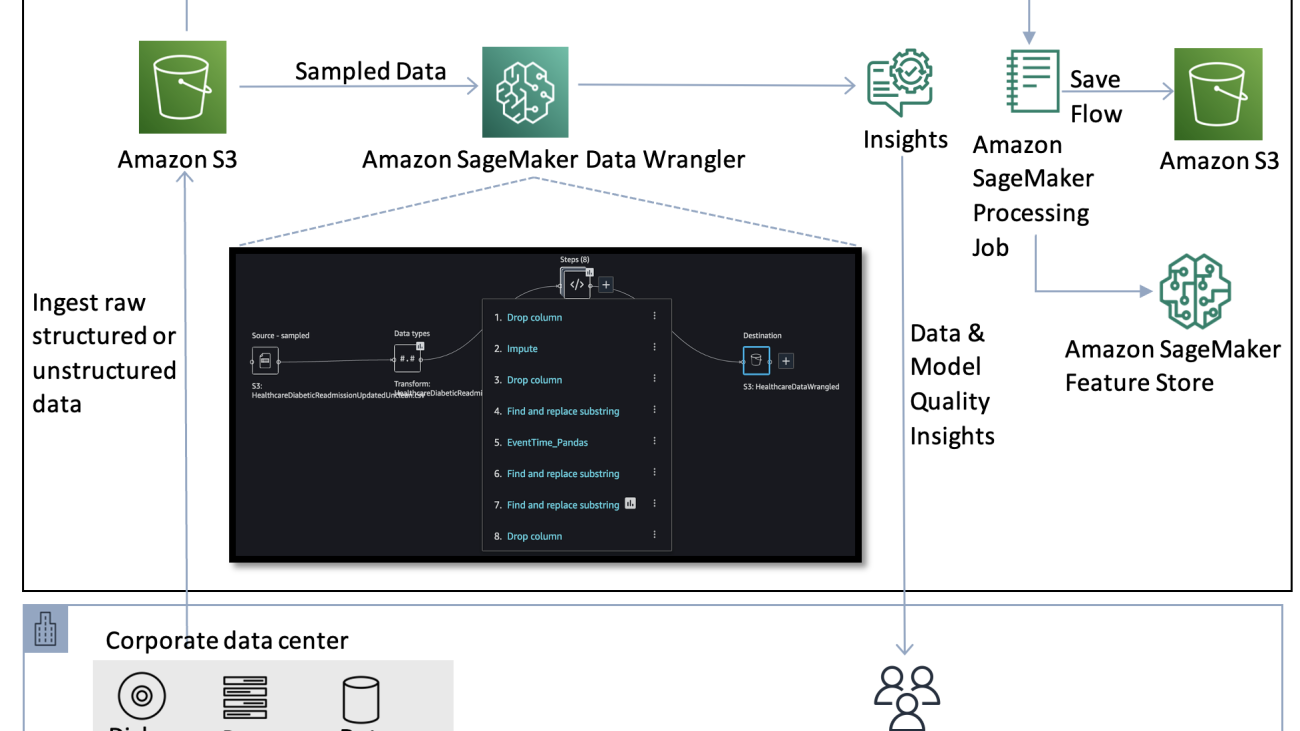
The following diagram illustrates the initial setup for the data preprocessing step prior to automating the workflow.

This step comprises the data flow initiation to process the raw data stored in an Amazon Simple Storage Service (Amazon S3) bucket. A sequence of steps in the Data Wrangler UI are created to perform feature engineering on the data (also referred to as a recipe). The data flow recipe consists of preprocessing steps along with a bias report, multicollinearity report, and model quality analysis.
Then, an Amazon SageMaker Processing job is run to save the flow to Amazon S3 and store the transformed features into Feature Store for reusable purposes.
After the flow has been created, which includes the recipe of instructions to be run on the data pertaining to the use case, the goal is to automate the process of creating the flow on any new incoming data, and initiate the process of extracting model quality insights using Data Wrangler. Then, the information regarding the transformations performed on the new data is parsed to an authorized user to inspect the data quality, and the pipeline waits for approval to run the model building and deployment step automatically.
The following architecture showcases the end-to-end automation of data transformation followed by human in the loop approval to facilitate the steps of model training and deployment.

The steps consist of an end-to-end orchestration for automated data transformation and optimal model deployment (with a human in the loop) using the following sequence of steps:
- A new object is uploaded into the S3 bucket (in our case, our training data).
- An AWS Lambda function is triggered when the object is uploaded in Amazon S3, which invokes AWS Step Functions and notifies the authorized user via a registered email.The following steps occur within the Step Functions orchestration:
- The Data Wrangler Flow Creation Lambda function fetches the Data Wrangler flow and processes the new data to be ingested into the Data Wrangler flow. It creates a new flow, which, when imported into the Data Wrangler UI, includes all the transformations, along with a model quality report and bias report. The function saves this latest flow in a new destination bucket.
- The User Callback Approval Lambda function sends a trigger notification via Amazon Simple Notification Service (Amazon SNS) to the registered persona via email to review the analyzed flow created on new unseen data information. In the email, the user has the option to accept or reject the data quality outcome and feature engineering flow.
- The next step is based on the approver’s decision:
- If the human in the loop approved the changes, the Lambda function initiates the SageMaker pipeline in the next state.
- If the human in the loop rejected the changes, the Lambda function doesn’t initiate the pipeline, and allows the user to look into the steps within the flow to perform additional feature engineering.
- The SageMaker Pipeline Execution Lambda function runs the SageMaker pipeline to create a SageMaker Processing job, which stores the feature engineered data in Feature Store. Another pipeline is created in parallel to save the transformed data to Amazon S3 as a CSV file.
- The AutoML Model Job Creation and Deployment Lambda function initiates an Amazon SageMaker Autopilot job to build and deploy the best candidate model and create a model endpoint, which authorized users can invoke for inference.
A Data Wrangler flow is available in our code repository that includes a sequence of steps to run on the dataset. We use Data Wrangler within our Amazon SageMaker Studio IDE, which can simplify the process of data preparation and feature engineering, and complete each step of the data preparation workflow, including data selection, cleansing, exploration, and visualization from a single visual interface.
Dataset
To demonstrate the orchestrated workflow, we use an example dataset regarding diabetic patient readmission. This data contains historical representations of patient and hospital outcomes, wherein the goal involves building an ML model to predict hospital readmission. The model has to predict whether the high-risk diabetic patients are likely to be readmitted to the hospital after a previous encounter within 30 days or after 30 days. Because this use case deals with multiple outcomes, this is a multi-class classification ML problem. You can try out the approach with this example and experiment with additional data transformations following similar steps with your own datasets.
The sample dataset we use in this post is a sampled version of the Diabetes 130-US hospitals for years 1999-2008 Data Set (Beata Strack, Jonathan P. DeShazo, Chris Gennings, Juan L. Olmo, Sebastian Ventura, Krzysztof J. Cios, and John N. Clore, “Impact of HbA1c Measurement on Hospital Readmission Rates: Analysis of 70,000 Clinical Database Patient Records,” BioMed Research International, vol. 2014, Article ID 781670, 11 pages, 2014.). It contains historical data including over 15 features with patient and hospital outcomes. The dataset contains approximately 69,500 rows. The following table summarizes the data schema.
| Column Name | Data Type | Data Description |
race |
STRING | Caucasian, Asian, African American, or Hispanic. |
time_in_hospital |
INT | Number of days between admission and discharge (length of stay). |
number_outpatient |
INT | Number of outpatient visits of the patient in a given year before the encounter. |
number_inpatient |
INT | Number of inpatient visits of the patient in a given year before the encounter. |
number_emergency |
INT | Number of emergency visits of the patient in a given year before the encounter. |
number_diagnoses |
INT | Number of diagnoses entered in the system. |
num_procedures |
INT | Number of procedures (other than lab tests) performed during the encounter. |
num_medications |
INT | Number of distinct generic medicines administrated during the encounter. |
num_lab_procedures |
INT | Number of lab tests performed during the encounter. |
max_glu_serum |
STRING | The range of result or if the test wasn’t taken. Values include >200, >300, normal, and none (if not measured). |
gender |
STRING | Values include Male, Female and Unknown/Invalid. |
diabetes_med |
INT | Indicates if any diabetes medication was prescribed. |
change |
STRING | Indicates if there was a change in diabetes medications (ether dosage or generic name). Values are change or no change. |
age |
INT | Age of patient at the time of encounter. |
a1c_result |
STRING | Indicates the range of the result of blood sugar levels. Values include >8, >7, normal, and none. |
readmitted |
STRING | Days to inpatient readmission. Values include <30 if patient was readmitted in less than 30 days, >30 if patient was readmitted after 30 days of encounter, and no for no record of readmission. |
Prerequisites
This walkthrough includes the following prerequisites:
- An AWS account
- A Studio domain managed policy attached to the AWS Identity and Access Management (IAM) execution role. For instructions on assigning permissions to the role, refer to Amazon SageMaker API Permissions: Actions, Permissions, and Resources Reference. In this case, you need to assign permissions as allocated to Amazon Augmented AI (Amazon A2I). For more information, refer to Amazon SageMaker Identity-Based Policy Examples.
- An S3 bucket. For instructions, refer to Creating a bucket.
- For this post, you use the AWS Cloud Development Kit (AWS CDK) using Python. Follow the instructions in Getting Started for AWS CDK to set up your local environment setup and bootstrap your development account.
Upload the historical dataset to Amazon S3
The first step is to download the sample dataset and upload it into an S3 bucket. In our case, our training data (diabetic-readmission.csv) is uploaded.
Data Wrangler initial flow
Prior to automating the Step Functions workflow, we need to perform a sequence of data transformations to create a data flow.
If you want to create the Data Wrangler steps manually, refer to the readme in the GitHub repo.
To import the flow to automate the Data Wrangler steps, complete the following steps:
- Download the flow from the GitHub repo and save it in your system.
- Open Studio and import the Data Wrangler flow.You need to update the location of where it needs to import the latest dataset. In your case, this is the bucket you defined with the respective prefix.
- Choose the plus sign next to Source and choose Edit dataset.

- Point to the S3 location of the dataset you downloaded.

- Inspect all the steps in the transformation and make sure they align with the sequence steps.


Save data flow to Feature Store
To save the data flow to Feature Store, complete the following steps:
- Choose the plus sign next to Steps and choose Export to.

- Choose SageMaker Feature Store (via Jupyter Notebook).
SageMaker generates a Jupyter notebook for you and opens it in a new tab in Studio. This notebook contains everything you need to run the transformations over our historical dataset and ingest the resulting features into Feature Store.This notebook uses Feature Store to create a feature group, runs your Data Wrangler flow on the entire dataset using a SageMaker processing job, and ingests the processed data to Feature Store.
- Choose the kernel Python 3 (Data Science) on the newly opened notebook tab.
- Read through and explore the Jupyter notebook.
- In the Create Feature Group section of the generated notebook, update the following fields for the event time and record identifier with the column names we created in the previous Data Wrangler step:
- Choose Run and then choose Run All Cells.

- Enter
flow_name = "HealthCareUncleanWrangler". - Run the following cells to create your feature group name.
 After running a few more cells in the code, the feature group is successfully created.
 - Now that the feature group is created, you use a processing job to process your data at scale and ingest the transformed data into this feature group.
If we keep the default bucket location, the flow will be saved in a SageMaker bucket located in the specific Region where you launched your SageMaker domain. With
With Feature_store_offline_S3_uri, Feature Store writes the data in theOfflineStoreof aFeatureGroupto an Amazon S3 location owned by you.Wait for the processing job to finish. If it finishes successfully, your feature group should be populated with the transformed feature values. In addition, the raw parameters used by the processing job are printed.It takes 10–15 minutes to run the processing job to create and run the Data Wrangler flow on the entire dataset and save the output flow in the respective bucket within the SageMaker session. - Next, run the
FeatureStoreAutomation.ipynbnotebook by importing it in Studio from GitHub and running all the cells. Follow the instructions in the notebook. - Copy the following variables from the Data Wrangler generated output from the previous step and add them to the cell in the notebook:
- Run the rest of the code following the instructions in the notebook to create a SageMaker pipeline to automate the storing of features to Feature Store in the feature group that you created.
- Next, similar to the previous step in the Data Wrangler export option, choose the plus sign and choose Export to.
- Choose SageMaker Pipelines (via Jupyter Notebook).
- Run all the cells to create a CSV flow as an output to be stored to Amazon S3.That pipeline name is invoked in a Lambda function later to automate the pipeline on a new flow.
- Within the code, whenever you see the following instance count, change
instance_countto 1: - Otherwise, your account may hit the service quota limits of running an m5.4x large instance for processing jobs being run within the notebook. You have to request an increase in service quota if you want more instances to run the job.
- As you walk through the pipeline code, navigate to Create SageMaker Pipeline, where you define the pipeline steps.
- In the Output Amazon S3 settings cell, change the location of the Amazon S3 output path to the following code (commenting the output prefix):
- Locate the following code:
- Replace it with the following:
- Remove the following cell:
- Continue running the next steps until you reach the Define a Pipeline of Parameters section with the following code. Append the last line
input_flowto the code segment: - Also, add the
input_flowas an additional parameter to the next cell: - In the section Submit the pipeline to SageMaker and start execution, locate the following cell:
- Replace it with the following code:
- Copy the name of the pipeline you just saved.
This will be yourS3_Pipeline_Namevalue that is added as the environment variable stored inDataWrangler Flow CreationLambda Function. - Replace
S3_Pipeline_Namewith the name of the pipeline that you just created after running the preceding notebook.
Now, when a new object is uploaded in Amazon S3, a SageMaker pipeline runs the processing job of creating the Data Wrangler flow on the entire dataset and stores the transformed dataset in Amazon S3 as a CSV file. This object is used in the next step (the Step Functions workflow) for model training and endpoint deployment.We have created and stored a transformed dataset in Amazon S3 by running the preceding notebook. We also created a feature group in Feature Store for storing the respective transformed features for later reuse. - Update both pipeline names in the Data Wrangler Flow Creation Lambda function (created with the AWS CDK) for the Amazon S3 pipeline and Feature Store pipeline.
Step Functions orchestration workflow
Now that we have created the processing job, we need to run these processing jobs on any incoming data that arrives in Amazon S3. We initiate the data transformation automatically, notify the authorized user of the new flow created, and wait for the approver to approve the changes based on data and model quality insights. Then, the Step Functions callback action is triggered to initiate the SageMaker pipeline and start the model training and optimal model deployment endpoint in the environment.
The Step Functions workflow includes a series of Lambda functions to run the overall orchestration. The Step Functions state machine, S3 bucket, Amazon API Gateway resources, and Lambda function codes are stored in the GitHub repo.
The following figure illustrates our Step Function workflow.

Run the AWS CDK code located in GitHub to automatically set up the stack containing the components needed to run the automated EDA and model operationalization framework. After setting up the AWS CDK environment, run the following command in the terminal:
Create a healthcare folder in the bucket you named via your AWS CDK script. Then upload flow-healthcarediabetesunclean.csv to the folder and let the automation happen!
In the following sections, we walk through each step in the Step Functions workflow in more detail.
Data Wrangler Flow Creation
As new data is uploaded into the S3 bucket, a Lambda function is invoked to trigger the Step Functions workflow. The Data Wrangler Flow Creation Lambda function fetches the Data Wrangler flow. It runs the processing job to create a new Data Wrangler flow (which includes data transformations, model quality report, bias report, and so on) on the ingested dataset and pushes the new flow to the designated S3 bucket.
This Lambda function parses the information to the User Callback Approval Lambda function and sends the trigger notification via Amazon SNS to the registered email with the location of the designated bucket where the flow has been saved.
User Callback Approval
The User Callback Approval step initiates the Lambda function that receives the updated flow information and sends a notification to the authorized user with the approval/rejection link to approve or reject the new flow. The user can review the analyzed flow created on the unseen data by downloading the flow from the S3 bucket and uploading it in the Data Wrangler UI.
After the user reviews the flow, they can go back to the email to approve the changes.
Manual Approval Choice
This Lambda function is waiting for the authorized user to approve or reject the flow.
If the answer received is yes (the user approved the flow), the SageMaker Pipeline Execution Lambda function initiates the SageMaker pipeline for storing the transformed features in Feature Store. Another SageMaker pipeline is initiated in parallel to save the transformed features CSV to Amazon S3, which is used by the next state (the AutoML Model Job Creation & Model Deployment Lambda function) for model training and deployment.
If the answer received is no (the user rejected the flow), the Lambda function doesn’t initiate the pipeline to run the flow. The user can look into the steps within the flow to perform additional feature engineering. Later, the user can rerun the entire sequence after adding additional data transformation steps in the flow.
SageMaker Pipeline Execution
This step initiates a Lambda function that runs the SageMaker pipeline to store the feature engineered data in Feature Store. Another pipeline in parallel saves the transformed data to Amazon S3.
You can monitor the two pipelines in Studio by navigating to the Pipelines page.

You can choose the graph to inspect the input, output, logs, and information.

Similarly, you can inspect the information of the other pipeline, which saves the transformed features CSV to Amazon S3.

AutoML Model Job Creation & Model Deployment
This step initiates a Lambda function that starts an Autopilot job to ingest the CSV from the previous Lambda function, and build and deploy the best candidate model. This step creates a model endpoint that can be invoked by authorized users. When the AutoML job is complete, you can navigate to Studio, choose Experiment and trials, and view the information associated with your job.

As all of these steps are run, the SageMaker dashboard reflects the processing job, batch transform job, training job, and hyperparameter tuning job that are being created in the process and the creation of the endpoint that can be invoked when the overall process is complete.

Clean up
To avoid ongoing charges, make sure to delete the SageMaker endpoint and stop all the notebooks running in Studio, including the Data Wrangler instances. Also, delete the output data in Amazon S3 you created while running the orchestration workflow via Step Functions. You have to delete the data in the S3 buckets before you can delete the buckets.
Conclusion
In this post, we demonstrated an end-to-end approach to perform automated data transformation with a human in the loop to determine model quality thresholds and approve the optimal qualified data to be pushed to a SageMaker pipeline to push the final data into Feature Store, thereby speeding up the executional framework. Furthermore, the approach includes deploying the best candidate model and creating the model endpoint on the final feature engineered data that was automatically processed when new data arrives.
References
For further information about Data Wrangler, Feature Store, SageMaker pipelines, Autopilot, and Step Functions, we recommend the following resources:
- Amazon SageMaker Pipelines Brings DevOps Capabilities to your Machine Learning Projects
- Step Functions for feature transformation
- Introducing SageMaker Data Wrangler, a Visual Interface to Prepare Data for Machine Learning
- Building machine learning workflows with Amazon SageMaker Processing jobs and AWS Step Functions
- Unified data preparation and model training with Amazon SageMaker Data Wrangler and Amazon SageMaker Autopilot
About the Author(s)
 Shikhar Kwatra is an AI/ML Specialist Solutions Architect at Amazon Web Services, working with a leading Global System Integrator. He has earned the title of one of the Youngest Indian Master Inventors with over 400 patents in the AI/ML and IoT domains. He has over 8 years of industry experience from startups to large-scale enterprises, from IoT Research Engineer, Data Scientist, to Data & AI Architect. Shikhar aids in architecting, building, and maintaining cost-efficient, scalable cloud environments for organizations and supports GSI partners in building strategic industry solutions on AWS.
 Sachin Thakkar is a Senior Solutions Architect at Amazon Web Services, working with a leading Global System Integrator (GSI). He brings over 22 years of experience as an IT Architect and as Technology Consultant for large institutions. His focus area is on data and analytics. Sachin provides architectural guidance and supports GSI partners in building strategic industry solutions on AWS.
Move Amazon SageMaker Autopilot ML models from experimentation to production using Amazon SageMaker Pipelines
Amazon SageMaker Autopilot automatically builds, trains, and tunes the best custom machine learning (ML) models based on your data. It’s an automated machine learning (AutoML) solution that eliminates the heavy lifting of handwritten ML models that requires ML expertise. Data scientists need to only provide a tabular dataset and select the target column to predict, and Autopilot automatically infers the problem type, performs data preprocessing and feature engineering, selects the algorithms and training mode, and explores different configurations to find the best ML model. Then you can directly deploy the model to an Amazon SageMaker endpoint or iterate on the recommended solutions to further improve the model quality.
Although Autopilot eliminates the heavy lifting of building ML models, MLOps engineers still have to create, automate, and manage end-to-end ML workflows. Amazon SageMaker Pipelines helps you automate the different steps of the ML lifecycle, including data preprocessing, training, tuning and evaluating ML models, and deploying them.
In this post, we show how to create an end-to-end ML workflow to train and evaluate an Autopilot generated ML model using Pipelines and register it in the SageMaker model registry. The ML model with the best performance can be deployed to a SageMaker endpoint.
Dataset overview
We use the publicly available hospital readmission dataset for diabetic patients to predict readmission of diabetic patients within 30 days after discharge. It is a sampled version of the “Diabetes 130-US hospitals for years 1999-2008 Data Set”. This is a multi-class classification problem because the readmission options are either < 30 if the patient is readmitted within 30 days, > 30 if the patient is readmitted after 30 days, or no for no record of readmission.
The dataset contains 50,000 rows and 15 columns. This includes demographic information about patients along with their hospital visit records and readmitted as the target column. The following table summarizes the column details.
| Column Name | Description |
| Race_Caucasian | Values: 0 for no, 1 for yes |
| Race_African_American | Values: 0 for no, 1 for yes |
| Race_Hispanic | Values: 0 for no, 1 for yes |
| Race_Asian | Values: 0 for no, 1 for yes |
| Race_Other | Values: 0 for no, 1 for yes |
| Age | 0–100 age range |
| Time in Hospital | Number of days between admission and discharge |
| Number of lab procedures | Number of lab tests performed during the encounter |
| Number of medications | Number of distinct generic names administered during the encounter |
| Number of emergency visits | Number of emergency visits of the patient in the year preceding the encounter |
| Number of inpatient visits | Number of inpatient visits of the patient in the year preceding the encounter |
| Number of diagnoses | Number of diagnoses entered to the system |
| Change of medications | Indicates if there was a change in diabetic medications (either dosage or generic name); values: 0 and 1 |
| Diabetic medications | Indicates if there was any diabetic medication prescribed; values: 0 for no changes in prescription and 1 for change in prescription |
| Readmitted | Days to inpatient readmission; values: <30 if the patient was readmitted in less than 30 days, >30 if the patient was readmitted in more than 30 days, and no for no record of readmission |
Solution overview
We use Pipelines in Amazon SageMaker Studio to orchestrate different pipeline steps required to train an Autopilot model. An Autopilot experiment is created and run using the AWS SDKs as described in this post. Autopilot training jobs start their own dedicated SageMaker backend processes, and dedicated SageMaker API calls are required to start new training jobs, monitor training job statuses, and invoke trained Autopilot models.
The following are the steps required for this end-to-end Autopilot training process:
- Create an Autopilot training job.
- Monitor the training job status.
- Evaluate performance of the trained model on a test dataset.
- Register the model in the model registry.
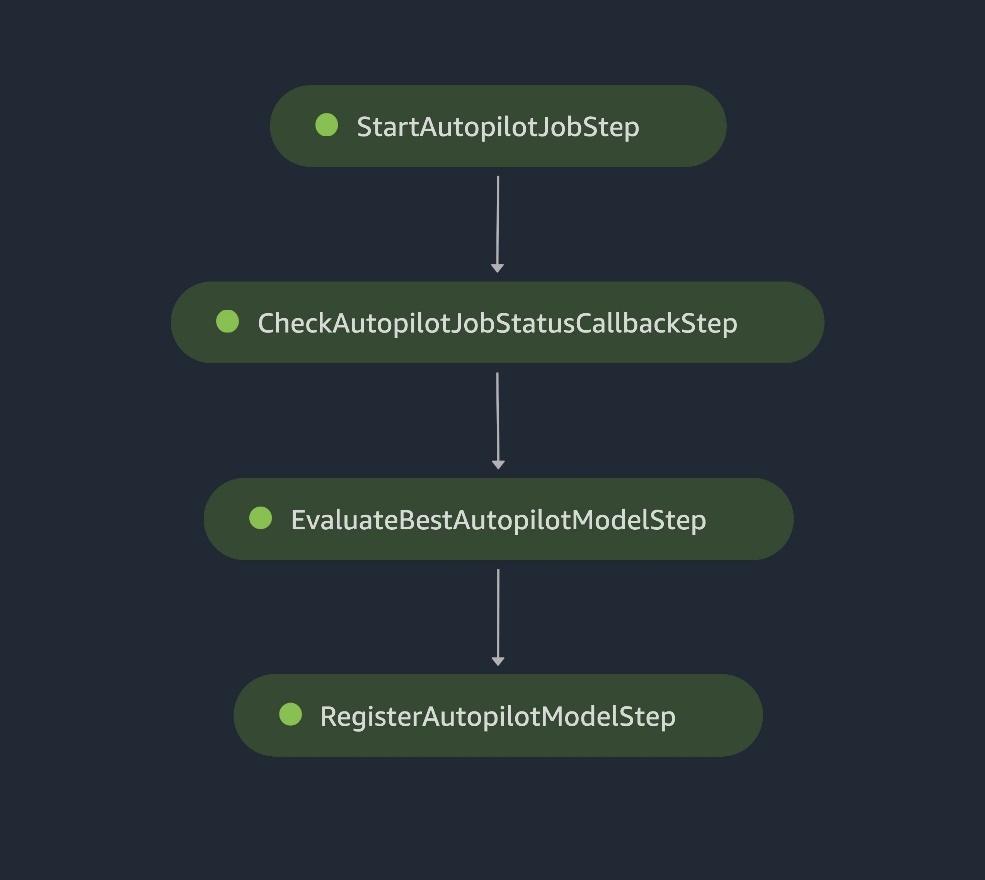
SageMaker pipeline steps
When the registered model meets the expected performance requirements after a manual review, you can deploy the model to a SageMaker endpoint using a standalone deployment script.
The following architecture diagram illustrates the different pipeline steps necessary to package all the steps in a reproducible, automated, and scalable Autopilot training pipeline. Each step is responsible for a specific task in the workflow:
- An AWS Lambda function starts the Autopilot training job.
- A Callback step continuously monitors that job status.
- When the training job status is complete, we use a SageMaker processing job to evaluate the model’s performance.
- Finally, we use another Lambda function to register the ML model and the performance metrics to the SageMaker model registry.
The data files are read from the Amazon Simple Storage Service (Amazon S3) bucket and the pipeline steps are called sequentially.
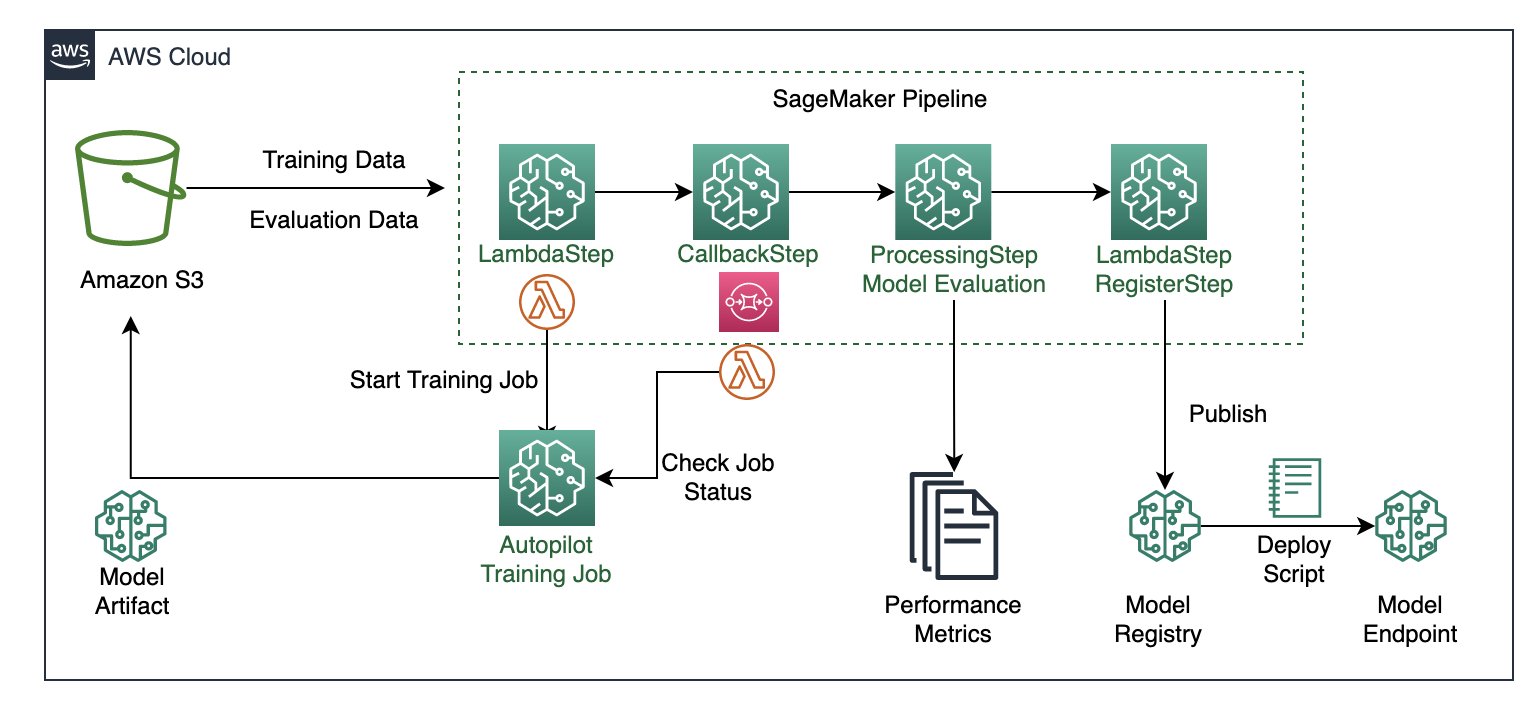
Architecture diagram of the SageMaker pipeline
In the following sections, we review the code and discuss the components of each step. To deploy the solution, reference the GitHub repo, which provides step-by-step instructions for implementing an Autopilot MLOps workflow using Pipelines.
Prerequisites
For this walkthrough, complete the following prerequisite steps:
- Set up an AWS account.
- Create a Studio environment.
- Create two AWS Identity and Access Management (IAM) roles:
LambdaExecutionRoleandSageMakerExecutionRole, with permissions as outlined in the SageMaker notebook. The managed policies should be scoped down further for improved security. For instructions, refer to Creating a role to delegate permissions to an IAM user. - On the Studio console, upload the code from the GitHub repo.
- Open the SageMaker notebook
autopilot_pipelines_demo_notebook.ipynband run the cells under Get dataset to download the data and upload it to your S3 bucket.- Download the data and unzip it to a folder named data:
- Split the data into train-val and test files and upload them to your S3 bucket. The train-val file is automatically split into training and validation datasets by Autopilot. The test file is split into two separate files: one file without the target column and another file with only the target column.
When the dataset is ready to use, we can now set up Pipelines to establish a repeatable process to build and train custom ML models using Autopilot. We use Boto3 and the SageMaker SDK to launch, track, and evaluate the AutoML jobs in an automated fashion.
Define the pipeline steps
In this section, we walk you through setting up the four steps in the pipeline.
Start the Autopilot job
This pipeline step uses a Lambda step, which runs a serverless Lambda function. We use a Lambda step because the API call to Autopilot is lightweight. Lambda functions are serverless and well suited for this task. For more information about Lambda steps, refer to Use a SageMaker Pipeline Lambda step for lightweight model deployments. The Lambda function in the start_autopilot_job.py script creates an Autopilot job.
We use the Boto3 Autopilot API call create_auto_ml_job to specify the Autopilot job configuration, with the following parameters:
- AutoMLJobName – The Autopilot job name.
- InputDataConfig – The training data, data location in Amazon S3, and S3 data type with valid values such as
S3Prefix,ManifestFile, andAugmentedManifestFile. - OutputDataConfig – The S3 output path where artifacts from the AutoML job are stored.
- ProblemType – The problem type (
MulticlassClassificationfor our use case). - AutoMLJobObjective –
F1macrois our objective metric for our use case. - AutoMLJobConfig – The training mode is specified here. We use the newly released ensemble training mode powered by AutoGluon.
See the following code:
Check Autopilot job status
A Callback step helps us keep track of the status of the Autopilot training job.
The step repeatedly keeps track of the training job status by using a separate Lambda function in check_autopilot_job_status.py until its completion.
The Callback step places a token in an Amazon Simple Queue Service (Amazon SQS) queue that triggers a Lambda function to check the training job status:
- If the job is still running, the Lambda function raises an exception and the message is placed back into the SQS queue
- If the job is complete, the Lambda function sends a success message back to the
Callbackstep and the pipeline continues with the next step
We use a combination of a Callback step and a Lambda function. There is an alternate option of using a SageMaker processing job instead.
Evaluate the best Autopilot model
The SageMaker processing step launches a SageMaker batch transform job to evaluate the trained Autopilot model against an evaluation dataset (the test set that was saved to the S3 bucket) and generates the performance metrics evaluation report and model explainability metrics. The evaluation script takes the Autopilot job name as an input argument and launches the batch transform job.
When the batch transform job is complete, we get output predictions for the test set. The output predictions are compared to the actual (ground truth) labels using Scikit-learn metrics functions. We evaluate our results based on the F1 score, precision, and recall. The performance metrics are saved to a JSON file, which is referenced when registering the model in the subsequent step.
Register the Autopilot model
We use another Lambda step, in which the Lambda function in register_autopilot_job.py registers the Autopilot model to the SageMaker model registry using the evaluation report obtained in the previous SageMaker processing step. A Lambda step is used here for cost efficiency and latency.
At this point, we have successfully registered our new Autopilot model to the SageMaker model registry. You can view the new model on Studio by choosing Model registry on the SageMaker resources menu and opening autopilot-demo-package. Choose any version of a training job to view the objective metrics under Model quality.

You can use the explainability report on the Explainability tab to understand your model’s predictions.

To view the experiments run for each model created, navigate to the Experiments and trials page. Choose (right-click) one of the listed experiments and choose Describe AutoML job to view the model leaderboard.

To view the pipeline steps on the Experiments and trials page, choose (right-click) the experiment and choose Open pipeline details.

Create and run the pipeline
After we define the pipeline steps, we combine them into a SageMaker pipeline. The steps are run sequentially. The pipeline runs all of the steps for an AutoML job, using Autopilot for training, model evaluation, and model registration. See the following code:
Deploy the model
After we have manually reviewed the ML model’s performance, we can deploy our newly created model to a SageMaker endpoint. For this, we can run the cell in the notebook that creates the model endpoint using the model configuration saved in the SageMaker model registry.
Note that this script is shared for demonstration purposes, but it’s recommended to follow a more robust CI/CD pipeline for production deployment. For more information, refer to Building, automating, managing, and scaling ML workflows using Amazon SageMaker Pipelines.
Conclusion
This post described an easy-to-use ML pipeline approach to automatically train tabular ML models (AutoML) using Autopilot, Pipelines, and Studio. AutoML improves ML practitioners’ efficiency, accelerating the path from ML experimentation to production without the need for extensive ML expertise. We outlined the respective pipeline steps needed for ML model creation, evaluation, and registration.
Get started by accessing the code on the GitHub repo to train and deploy your own custom AutoML models.
For more information on Pipelines and Autopilot, refer to Amazon SageMaker Pipelines and Automate model development with Amazon SageMaker Autopilot, respectively.
About the Authors
 Pierre de Malliard is a Full-Stack Data Scientist for AWS and is passionate about helping customers improve their business outcomes with machine learning. He has been building AI/ML solutions across the healthcare sector. He holds multiple AWS certifications. In his free time, Pierre enjoys backcountry skiing and spearfishing.
 Paavani Dua is an Applied Scientist in the AWS AI organization. At the Amazon ML Solutions Lab, she works with customers to solve their business problems using ML solutions. Outside of work, she enjoys hiking, reading, and baking.
 Marcelo Aberle is an ML Engineer in the AWS AI organization. He is leading MLOps efforts at the Amazon ML Solutions Lab, helping customers design and implement scalable ML systems. His mission is to guide customers on their enterprise ML journey and accelerate their ML path to production. He is an admirer of California nature and enjoys hiking and cycling around San Francisco.

Startups across AWS Accelerators use AI and ML to solve mission-critical customer challenges
Relentless advancement in technology is improving the decision-making capacity of humans and enterprises alike. Digitization of the physical world has accelerated the three dimensions of data: velocity, variety, and volume. This has made information more widely available than before, allowing for advancements in problem-solving. Now, with cloud-enabled democratized availability, technologies like artificial intelligence (AI) and machine learning (ML) are able to increase the speed and accuracy of decision-making by humans and machines.
Nowhere is this speed and accuracy of decisions more important than in the public sector, where organizations across defense, healthcare, aerospace, and sustainability are solving challenges that impact citizens around the world. Many public sector customers see the benefits of using AI/ML to address these challenges, but can be overwhelmed with the range of solutions. AWS launched AWS Accelerators to find and develop startups with technologies that meet public sector customers’ unique challenges. Read on to learn more about AI/ML use cases from startups in the AWS Accelerator that are making an impact for public sector customers.
Healthcare
Pieces: Healthcare providers want to spend more time caring for patients and less time on paperwork. Pieces, an AWS Healthcare Accelerator startup, uses AWS to make it easier to input, manage, store, organize, and gain insight from Electronic Health Record (EHR) data to address social determinants of health and improve patient care. With AI, natural language processing (NLP), and clinically reviewed algorithms, Pieces can provide projected hospital discharge dates, anticipated clinical and non-clinical barriers to discharge, and risk of readmission. Pieces services also provide insights to healthcare providers in plain language and optimize clarity of patients’ clinical issues to help care teams work more efficiently. According to Pieces, the software delivers a 95% positive prediction in identifying barriers to patient discharge, and at one hospital, has shown its ability to reduce patient hospital stays on average by 2 days.
Pieces uses Amazon Elastic Compute Cloud (Amazon EC2), Amazon Relational Database Service (Amazon RDS), and Amazon Managed Streaming for Apace Kafka (Amazon MSK) for collecting and processing streamed clinical data. Pieces uses Amazon Elastic Kubernetes Service (Amazon EKS), Amazon OpenSearch Service, and Amazon Managed Workflows for Apache Airflow (Amazon MWAA) to run multiple ML models on data in production at scale.
PEP Health: Patient experience is a key priority, but gathering patient feedback can be a challenge. PEP Health, a startup in the AWS Healthcare Accelerator’s UK cohort, uses NLP technology to analyze millions of online, publicly posted patient comments, generating scores that highlight areas for celebration or concern, and identifying the reasons for improving or declining patient satisfaction. This data can be used to improve experiences, drive better outcomes, and democratize the patient voice.
PEP Health uses AWS Lambda, AWS Fargate, and Amazon EC2 to ingest information in real time from hundreds of thousands of webpages. With proprietary NLP models built and run on Amazon SageMaker, PEP Health identifies and scores themes relevant to the quality of care. These results feed PEP Health’s Patient Experience Platform and ML algorithms built and powered by Lambda, Fargate, Amazon EC2, Amazon RDS, SageMaker, and Amazon Cognito, which enable relationship analysis and uncover patterns between people, places, and things that may otherwise seem disconnected.
“Through the accelerator, PEP Health was able to scale its operations significantly with the introduction of AWS Lambda to collect more comments faster and more affordably. Additionally, we’ve been able to use Amazon SageMaker to derive further insights for customers.”
– Mark Lomax, PEP Health CEO.
Defense and space
Lunar Outpost: Lunar Outpost was part of the AWS Space Accelerator’s inaugural cohort in 2021. The company is taking part in missions to the Moon and is developing Mobile Autonomous Platform (MAP) rovers that will be capable of surviving and navigating the extreme environments of other planetary bodies. To successfully navigate in conditions that can’t be found on Earth, Lunar Outpost makes extensive use of robotic simulations to validate AI navigation algorithms.
Lunar Outpost uses AWS RoboMaker, Amazon EC2, Amazon Elastic Container Registry (Amazon ECR), Amazon Simple Storage Service (Amazon S3), Amazon Virtual Private Cloud (Amazon VPC), Lambda, AWS CodeBuild, and Amazon QuickSight to test rovers by deploying lunar simulations. As Lunar Outpost develops navigation technologies for the lunar surface, simulation instances are spun up. These simulations will be used during lunar missions to assist human operators and decrease risk. Data streamed back from the lunar surface will be imported into their simulation, giving a real-time view of the rover’s activities. Simulation of digital MAP rovers allows for trial runs of navigation trajectories without moving the physical rover, dramatically reducing the risks of moving rovers in space.
Adarga: Adarga, part of the first AWS Defense Accelerator cohort, is delivering an AI-driven intelligence platform to rapidly understand risks and opportunities for theater entry preparation and deployment. Adarga uses AI to find insights buried within large volumes of unstructured data, such as news, presentations, reports, videos, and more.
Adarga uses Amazon EC2, OpenSearch Service, Amazon Aurora, Amazon DocumentDB (with MongoDB compatibility), Amazon Translate, and SageMaker. Adarga ingests information in real time, translates foreign language documents, and transcribes audio and video files into text. In addition to SageMaker, Adarga uses proprietary NLP models to extract and classify details, like people, places, and things, deploying disambiguation techniques to contextualize the information. These details are mapped into a dynamic intelligence picture for customers. Adarga’s ML algorithms, together with AWS AI/ML services, enable relationship analysis, uncovering patterns that may otherwise seem disconnected.
“We are proud to be part of this pioneering initiative as we continue to work closely with AWS and a wider ecosystem of tech players to deliver game-changing capabilities to defence, enabled by hyperscale cloud.”
– Robert Bassett-Cross, CEO, Adarga
Sustainable cities
SmartHelio: Within the commercial solar farm industry, it is critical to determine the health of installed solar infrastructure. SmartHelio combines physics and SageMaker to construct models that determine the current health of solar assets, build predictions on which assets will fail, and determine proactively which assets to service first.
SmartHelio’s solution, built on AWS, analyzes incredibly complex photovoltaic physics and power systems. A data lake on Amazon S3 stores billions of data points streamed on a real-time basis from Supervisory Control and Data Acquisition (SCADA) servers on solar farms, Internet of Things (IoT) devices, or third-party Content Management Systems (CMS) platforms. SmartHelio uses SageMaker to run deep learning models to recognize patterns, quantify solar farm health, and predict farm losses on a real-time basis, delivering intelligent insights instantly to its customers.
After being selected for the first AWS Sustainable Cities Accelerator cohort, SmartHelio secured several pilots with new customers. In CEO Govinda Upadhyay’s words, “the AWS Accelerator gave us global exposure to markets, mentors, potential customers, and investors.”
Automotus: Automotus uses computer vision technology to give drivers the ability to view in real time if curb space is available, significantly reducing time spent searching for parking. Automotus helps cities and airports manage and monetize their curbs using a fleet of computer vision sensors powered by AWS IoT Greengrass. Automotus’s sensors upload training data to Amazon S3, where a workflow powered by Lambda indexes sample data to create complex datasets for training new models and improving existing ones.
Automotus uses SageMaker to automate and containerize its computer vision model training process, the outputs of which are deployed back to the edge using a simple, automated process. Equipped with these trained models, Automotus sensors send metadata to the cloud using AWS IoT Core, uncovering granular insights about curb activity and enabling fully automated billing and enforcement at the curb. With one customer, Automotus increased enforcement efficiency and revenue by more than 500%, resulting in a 24% increase in parking turnover and a 20% reduction in traffic.
What’s next for AI/ML and startups
Customers have embraced AI/ML to solve a wide spectrum of challenges, which is a testament to the advancement of the technology and the increased confidence customers have in using data to improve decision-making. AWS Accelerators aim to continue the acceleration and adoption of AI/ML solutions by helping customers brainstorm and share critical problem statements, and finding and connecting startups with these customers.
Interested in advancing solutions for public good through your startup? Or have a challenge in need of a disruptive solution? Connect with the AWS Worldwide Public Sector Venture Capital and Startups team today to learn more about AWS Accelerators and other resources available to drive decision-making innovations.
About the authors
 Swami Sivasubramanian is Vice President of Data and Machine Learning at AWS. In this role, Swami oversees all AWS Database, Analytics, and AI & Machine Learning services. His team’s mission is to help organizations put their data to work with a complete, end-to-end data solution to store, access, analyze, and visualize, and predict.
 Manpreet Mattu is the Global Head for Venture Capital and Startups Business Development for the World Wide Public Sector at Amazon Web Services (AWS). He has 15 years of experience in venture Investments and acquisitions in leading-edge technology and non-tech segments. Beyond tech, Manpreet’s interest spans history, philosophy, and economics. He is also an endurance runner.

Stormy Weather? Scientist Sharpens Forecasts With AI
Editor’s note: This is the first in a series of blogs on researchers advancing science in the expanding universe of high performance computing.
A perpetual shower of random raindrops falls inside a three-foot metal ring Dale Durran erected outside his front door (shown above). It’s a symbol of his passion for finding order in the seeming chaos of the planet’s weather.
A part-time sculptor and full-time professor of atmospheric science at the University of Washington, Durran has co-authored dozens of papers describing patterns in Earth’s ever-changing skies. It’s a field for those who crave a confounding challenge trying to express with math the endless dance of air and water.

In 2019, Durran acquired a new tool, AI. He teamed up with a grad student and a Microsoft researcher to build the first model to demonstrate deep learning’s potential to predict the weather.
Though crude, the model outperformed the complex equations used for the first computer-based forecasts. The descendants of those equations now run on the world’s biggest supercomputers. In contrast, AI slashes the traditional load of required calculations and works faster on much smaller systems.
“It was a dramatic revelation that said we better jump into this with both feet,” Durran recalled.
Sunny Outlook for AI
Last year, the team took their work to the next level. Their latest neural network can process 320 six-week forecasts in less than a minute on the four NVIDIA A100 Tensor Core GPUs in an NVIDIA DGX Station. That’s more than 6x the 51 forecasts today’s supercomputers synthesize to make weather predictions.
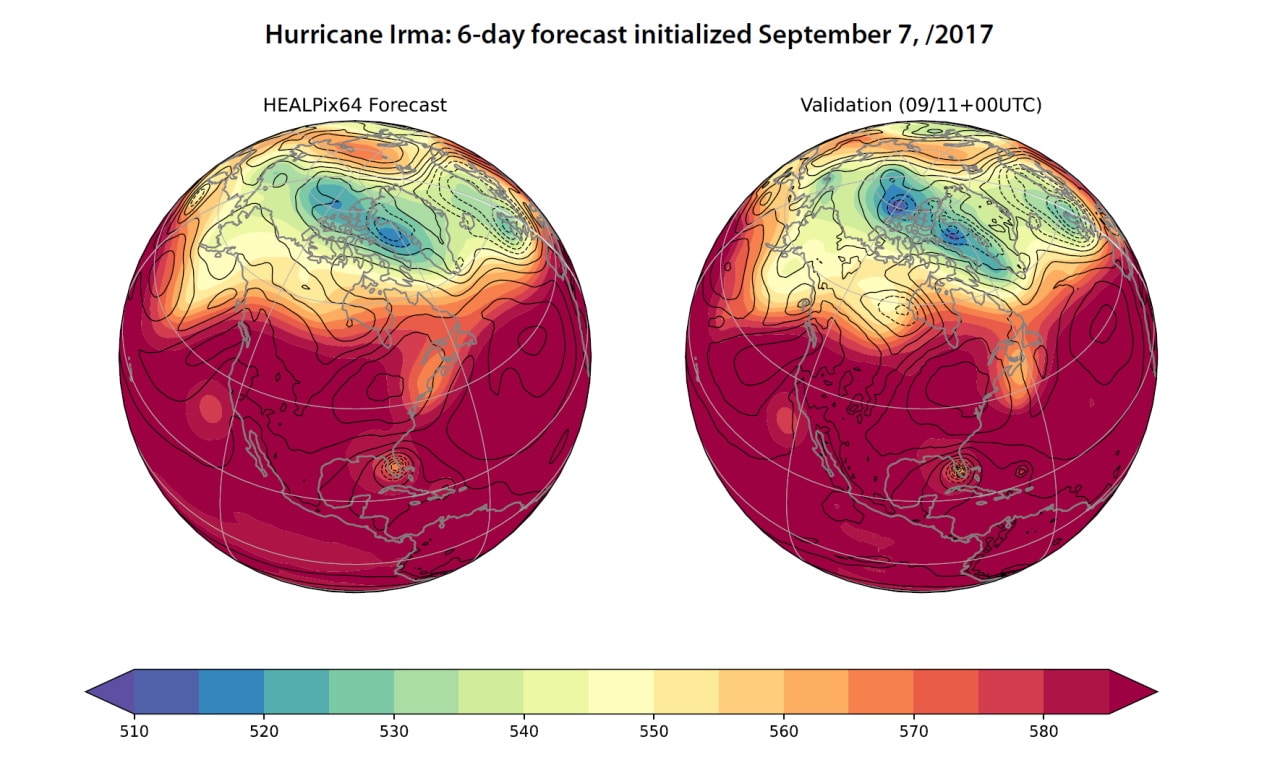
In a show of how rapidly the technology is evolving, the model was able to forecast, almost as well as traditional methods, what became the path of Hurricane Irma through the Caribbean in 2017. The same model also could crank out a week’s forecast in a tenth of a second on a single NVIDIA V100 Tensor Core GPU.
Durran foresees AI crunching thousands of forecasts simultaneously to deliver a clearer statistical picture with radically fewer resources than conventional equations. Some suggest the performance advances will be measured in as many as five orders of magnitude and use a fraction of the power.
AI Ingests Satellite Data
The next big step could radically widen the lens for weather watchers.
The complex equations today’s predictions use can’t readily handle the growing wealth of satellite data on details like cloud patterns, soil moisture and drought stress in plants. Durran believes AI models can.
One of his graduate students hopes to demonstrate this winter an AI model that directly incorporates satellite data on global cloud cover. If successful, it could point the way for AI to improve forecasts using the deluge of data types now being collected from space.
In a separate effort, researchers at the University of Washington are using deep learning to apply a grid astronomers use to track stars to their work understanding the atmosphere. The novel mesh could help map out a whole new style of weather forecasting, Durran said.
Harvest of a Good Season
In nearly 40 years as an educator, Durran has mentored dozens of students and wrote two highly rated textbooks on fluid dynamics, the math used to understand the weather and climate.
One of his students, Gretchen Mullendore, now heads a lab at the U.S. National Center for Atmospheric Research, working with top researchers to improve weather forecasting models.
“I was lucky to work with Dale in the late 1990s and early 2000s on adapting numerical weather prediction to the latest hardware at the time,” said Mullendore. “I am so thankful to have had an advisor that showed me it’s cool to be excited by science and computers.”
Carrying on a Legacy
Durran is slated to receive in January the American Meteorological Society’s most prestigious honor, the Jule G. Charney Medal. It’s named after the scientist who worked with John von Neumann to develop in the 1950s the algorithms weather forecasters still use today.
Charney was also author in 1979 of one of the earliest scientific papers on global warming. Following in his footsteps, Durran wrote two editorials last year for The Washington Post to help a broad audience understand the impacts of climate change and rising CO2 emissions.
The editorials articulate a passion he discovered at his first job in 1976, creating computer models of air pollution trends. “I decided I’d rather work on the front end of that problem,” he said of his career shift to meteorology.
It’s a field notoriously bedeviled by effects as subtle as a butterfly’s wings that motivates his passion to advance science.
The post Stormy Weather? Scientist Sharpens Forecasts With AI appeared first on NVIDIA Blog.
Two Amazon Scholars named among inaugural Rousseeuw Prize winners
Prize recognizes pioneering work in statistical methodology, and aims to raise awareness of the impact of statistics on society.Read More
Machine learning facilitates “turbulence tracking” in fusion reactors
Fusion, which promises practically unlimited, carbon-free energy using the same processes that power the sun, is at the heart of a worldwide research effort that could help mitigate climate change.
A multidisciplinary team of researchers is now bringing tools and insights from machine learning to aid this effort. Scientists from MIT and elsewhere have used computer-vision models to identify and track turbulent structures that appear under the conditions needed to facilitate fusion reactions.
Monitoring the formation and movements of these structures, called filaments or “blobs,” is important for understanding the heat and particle flows exiting from the reacting fuel, which ultimately determines the engineering requirements for the reactor walls to meet those flows. However, scientists typically study blobs using averaging techniques, which trade details of individual structures in favor of aggregate statistics. Individual blob information must be tracked by marking them manually in video data.
The researchers built a synthetic video dataset of plasma turbulence to make this process more effective and efficient. They used it to train four computer vision models, each of which identifies and tracks blobs. They trained the models to pinpoint blobs in the same ways that humans would.
When the researchers tested the trained models using real video clips, the models could identify blobs with high accuracy — more than 80 percent in some cases. The models were also able to effectively estimate the size of blobs and the speeds at which they moved.
Because millions of video frames are captured during just one fusion experiment, using machine-learning models to track blobs could give scientists much more detailed information.
“Before, we could get a macroscopic picture of what these structures are doing on average. Now, we have a microscope and the computational power to analyze one event at a time. If we take a step back, what this reveals is the power available from these machine-learning techniques, and ways to use these computational resources to make progress,” says Theodore Golfinopoulos, a research scientist at the MIT Plasma Science and Fusion Center and co-author of a paper detailing these approaches.
His fellow co-authors include lead author Woonghee “Harry” Han, a physics PhD candidate; senior author Iddo Drori, a visiting professor in the Computer Science and Artificial Intelligence Laboratory (CSAIL), faculty associate professor at Boston University, and adjunct at Columbia University; as well as others from the MIT Plasma Science and Fusion Center, the MIT Department of Civil and Environmental Engineering, and the Swiss Federal Institute of Technology at Lausanne in Switzerland. The research appears today in Nature Scientific Reports.
Heating things up
For more than 70 years, scientists have sought to use controlled thermonuclear fusion reactions to develop an energy source. To reach the conditions necessary for a fusion reaction, fuel must be heated to temperatures above 100 million degrees Celsius. (The core of the sun is about 15 million degrees Celsius.)
A common method for containing this super-hot fuel, called plasma, is to use a tokamak. These devices utilize extremely powerful magnetic fields to hold the plasma in place and control the interaction between the exhaust heat from the plasma and the reactor walls.
However, blobs appear like filaments falling out of the plasma at the very edge, between the plasma and the reactor walls. These random, turbulent structures affect how energy flows between the plasma and the reactor.
“Knowing what the blobs are doing strongly constrains the engineering performance that your tokamak power plant needs at the edge,” adds Golfinopoulos.
Researchers use a unique imaging technique to capture video of the plasma’s turbulent edge during experiments. An experimental campaign may last months; a typical day will produce about 30 seconds of data, corresponding to roughly 60 million video frames, with thousands of blobs appearing each second. This makes it impossible to track all blobs manually, so researchers rely on average sampling techniques that only provide broad characteristics of blob size, speed, and frequency.
“On the other hand, machine learning provides a solution to this by blob-by-blob tracking for every frame, not just average quantities. This gives us much more knowledge about what is happening at the boundary of the plasma,” Han says.
He and his co-authors took four well-established computer vision models, which are commonly used for applications like autonomous driving, and trained them to tackle this problem.
Simulating blobs
To train these models, they created a vast dataset of synthetic video clips that captured the blobs’ random and unpredictable nature.
“Sometimes they change direction or speed, sometimes multiple blobs merge, or they split apart. These kinds of events were not considered before with traditional approaches, but we could freely simulate those behaviors in the synthetic data,” Han says.
Creating synthetic data also allowed them to label each blob, which made the training process more effective, Drori adds.
Using these synthetic data, they trained the models to draw boundaries around blobs, teaching them to closely mimic what a human scientist would draw.
Then they tested the models using real video data from experiments. First, they measured how closely the boundaries the models drew matched up with actual blob contours.
But they also wanted to see if the models predicted objects that humans would identify. They asked three human experts to pinpoint the centers of blobs in video frames and checked to see if the models predicted blobs in those same locations.
The models were able to draw accurate blob boundaries, overlapping with brightness contours which are considered ground-truth, about 80 percent of the time. Their evaluations were similar to those of human experts, and successfully predicted the theory-defined regime of the blob, which agrees with the results from a traditional method.
Now that they have shown the success of using synthetic data and computer vision models for tracking blobs, the researchers plan to apply these techniques to other problems in fusion research, such as estimating particle transport at the boundary of a plasma, Han says.
They also made the dataset and models publicly available, and look forward to seeing how other research groups apply these tools to study the dynamics of blobs, says Drori.
“Prior to this, there was a barrier to entry that mostly the only people working on this problem were plasma physicists, who had the datasets and were using their methods. There is a huge machine-learning and computer-vision community. One goal of this work is to encourage participation in fusion research from the broader machine-learning community toward the broader goal of helping solve the critical problem of climate change,” he adds.
This research is supported, in part, by the U.S. Department of Energy and the Swiss National Science Foundation.

Using sound to model the world
Imagine the booming chords from a pipe organ echoing through the cavernous sanctuary of a massive, stone cathedral.
The sound a cathedral-goer will hear is affected by many factors, including the location of the organ, where the listener is standing, whether any columns, pews, or other obstacles stand between them, what the walls are made of, the locations of windows or doorways, etc. Hearing a sound can help someone envision their environment.
Researchers at MIT and the MIT-IBM Watson AI Lab are exploring the use of spatial acoustic information to help machines better envision their environments, too. They developed a machine-learning model that can capture how any sound in a room will propagate through the space, enabling the model to simulate what a listener would hear at different locations.
By accurately modeling the acoustics of a scene, the system can learn the underlying 3D geometry of a room from sound recordings. The researchers can use the acoustic information their system captures to build accurate visual renderings of a room, similarly to how humans use sound when estimating the properties of their physical environment.
In addition to its potential applications in virtual and augmented reality, this technique could help artificial-intelligence agents develop better understandings of the world around them. For instance, by modeling the acoustic properties of the sound in its environment, an underwater exploration robot could sense things that are farther away than it could with vision alone, says Yilun Du, a grad student in the Department of Electrical Engineering and Computer Science (EECS) and co-author of a paper describing the model.
“Most researchers have only focused on modeling vision so far. But as humans, we have multimodal perception. Not only is vision important, sound is also important. I think this work opens up an exciting research direction on better utilizing sound to model the world,” Du says.
Joining Du on the paper are lead author Andrew Luo, a grad student at Carnegie Mellon University (CMU); Michael J. Tarr, the Kavčić-Moura Professor of Cognitive and Brain Science at CMU; and senior authors Joshua B. Tenenbaum, the Paul E. Newton Career Development Professor of Cognitive Science and Computation in MIT’s Department of Brain and Cognitive Sciences and a member of the Computer Science and Artificial Intelligence Laboratory (CSAIL); Antonio Torralba, the Delta Electronics Professor of Electrical Engineering and Computer Science and a member of CSAIL; and Chuang Gan, a principal research staff member at the MIT-IBM Watson AI Lab. The research will be presented at the Conference on Neural Information Processing Systems.
Sound and vision
In computer vision research, a type of machine-learning model called an implicit neural representation model has been used to generate smooth, continuous reconstructions of 3D scenes from images. These models utilize neural networks, which contain layers of interconnected nodes, or neurons, that process data to complete a task.
The MIT researchers employed the same type of model to capture how sound travels continuously through a scene.
But they found that vision models benefit from a property known as photometric consistency which does not apply to sound. If one looks at the same object from two different locations, the object looks roughly the same. But with sound, change locations and the sound one hears could be completely different due to obstacles, distance, etc. This makes predicting audio very difficult.
The researchers overcame this problem by incorporating two properties of acoustics into their model: the reciprocal nature of sound and the influence of local geometric features.
Sound is reciprocal, which means that if the source of a sound and a listener swap positions, what the person hears is unchanged. Additionally, what one hears in a particular area is heavily influenced by local features, such as an obstacle between the listener and the source of the sound.
To incorporate these two factors into their model, called a neural acoustic field (NAF), they augment the neural network with a grid that captures objects and architectural features in the scene, like doorways or walls. The model randomly samples points on that grid to learn the features at specific locations.
“If you imagine standing near a doorway, what most strongly affects what you hear is the presence of that doorway, not necessarily geometric features far away from you on the other side of the room. We found this information enables better generalization than a simple fully connected network,” Luo says.
From predicting sounds to visualizing scenes
Researchers can feed the NAF visual information about a scene and a few spectrograms that show what a piece of audio would sound like when the emitter and listener are located at target locations around the room. Then the model predicts what that audio would sound like if the listener moves to any point in the scene.
The NAF outputs an impulse response, which captures how a sound should change as it propagates through the scene. The researchers then apply this impulse response to different sounds to hear how those sounds should change as a person walks through a room.
For instance, if a song is playing from a speaker in the center of a room, their model would show how that sound gets louder as a person approaches the speaker and then becomes muffled as they walk out into an adjacent hallway.
When the researchers compared their technique to other methods that model acoustic information, it generated more accurate sound models in every case. And because it learned local geometric information, their model was able to generalize to new locations in a scene much better than other methods.
Moreover, they found that applying the acoustic information their model learns to a computer vison model can lead to a better visual reconstruction of the scene.
“When you only have a sparse set of views, using these acoustic features enables you to capture boundaries more sharply, for instance. And maybe this is because to accurately render the acoustics of a scene, you have to capture the underlying 3D geometry of that scene,” Du says.
The researchers plan to continue enhancing the model so it can generalize to brand new scenes. They also want to apply this technique to more complex impulse responses and larger scenes, such as entire buildings or even a town or city.
“This new technique might open up new opportunities to create a multimodal immersive experience in the metaverse application,” adds Gan.
“My group has done a lot of work on using machine-learning methods to accelerate acoustic simulation or model the acoustics of real-world scenes. This paper by Chuang Gan and his co-authors is clearly a major step forward in this direction,” says Dinesh Manocha, the Paul Chrisman Iribe Professor of Computer Science and Electrical and Computer Engineering at the University of Maryland, who was not involved with this work. “In particular, this paper introduces a nice implicit representation that can capture how sound can propagate in real-world scenes by modeling it using a linear time-invariant system. This work can have many applications in AR/VR as well as real-world scene understanding.”
This work is supported, in part, by the MIT-IBM Watson AI Lab and the Tianqiao and Chrissy Chen Institute.