Turn Black Friday Into Green Thursday With New GeForce NOW Deal

Turn Black Friday Into Green Thursday With New GeForce NOW Deal

Black Friday is now Green Thursday with a great deal on GeForce NOW this week.

For a limited time, get a free $20-value GeForce NOW membership gift card with every purchase of a $50-value GeForce NOW membership gift card. Treat yourself and a buddy to high-performance cloud gaming — there’s never been a better time to share the love of GeForce NOW.

Plus, kick off a gaming-filled weekend with four new titles joining the GeForce NOW library.

Instant Streaming, Instant Savings

For one week only, from Nov. 23-Dec. 2, purchase a $50-value gift card — good toward a three-month RTX 3080 membership or a six-month Priority membership — and get a bonus $20-value GeForce NOW membership gift card for free, which is good toward a one-month RTX 3080 membership or a two-month Priority membership.

Recipients will be able to redeem these gift cards for the GeForce NOW membership level of their choice. The $20-value free gift card will be delivered as a digital code — providing instant savings for instant streaming. Learn more details.

GeForce NOW Green Thursday Gift Card Deal
Green is the new black with this time-limited Black Friday deal.

With a paid membership, gamers get access to stream over 1,400 PC games with longer gaming sessions and real-time ray tracing for supported games across nearly all devices, even those that aren’t game ready. Priority members can stream up to 1080p at 60 frames per second, and RTX 3080 members can stream up to 4K at 60 FPS or 1440p at 120 FPS.

This special offer is valid on $50-value digital or physical gift card purchases, making it a perfect stocking stuffer or last-minute gift. Snag the deal to make Black Friday shopping stress-free this year.

Time to Play

Evil West on GeForce NOW
Evil never sleeps … but it bleeds!

The best way to celebrate a shiny new GeForce NOW membership is with the new games available to stream this GFN Thursday. Start out with Evil West from Focus Entertainment, a vampire-hunting third-person action game set in a fantasy version of the Old West. Play as a lone hunter or co-op with a buddy to explore and eradicate the vampire threat while upgrading weapons and tools along the way.

Check out this week’s new games here:

  • Evil West (New release on Steam)
  • Ship of Fools (New release on Steam)
  • Crysis 2 Remastered (Steam)
  • Crysis 3 Remastered (Steam)

Before you dig into your weekend gaming, we’ve got a question for you. Let us know your answer on Twitter or in the comments below.

The post Turn Black Friday Into Green Thursday With New GeForce NOW Deal appeared first on NVIDIA Blog.

Read More

How JPMorgan Chase & Co. uses AWS DeepRacer events to drive global cloud adoption

How JPMorgan Chase & Co. uses AWS DeepRacer events to drive global cloud adoption

This is a guest post by Stephen Carrad, Vice President at JP Morgan Chase & Co.

JPMorgan & Chase Co. started its cloud journey four years ago, building the integrations required to deploy cloud-native applications into the cloud in a resilient and secure manner. In the first year, three applications tentatively dipped their toes into the cloud, and today, we have an ambitious cloud-first agenda.

Operating in the cloud requires a change in culture and a fundamental reeducation towards a new normal. An on-premises server is like your car: you own it, power it, maintain it, and upgrade it. In the cloud, a server is like a rideshare: you press a few buttons, the car appears, you use it for a certain time, and when you’ve finished with it you walk away and someone else uses it. To adapt to a cloud first agenda, our engineers are learning a new operating model, new tools, and new processes.

JPMorgan Chase’s AWS DeepRacer learning program was born in Chicago in 2019. A child of the Chicago Innovation team led, it’s designed to upskill our employees in an enjoyable way by allowing them to compete internally with their local peer groups, globally against other cities, and externally against other firms, universities, and individuals. We started with physical tracks in Chicago and London, and now have tracks in most of our 20+ technology centers around the globe and several racers participating in the DeepRacer Championship Cup at AWS re:Invent.

It started small, but immediately provided value and, more importantly, entertainment to the participants of the program. People who had never used the AWS Management Console before logged on and learned how it worked, played with AWS DeepRacer, and started to write code and learn about reinforcement learning. They also started to collaborate with one another—someone would have an idea to reduce costs or provide visualization of the log analysis, and other people would partner with them to build new tools. It grew beyond teaching people about AWS products and machine learning to people across the world collaborating, building tools, and creating quizzes. We also have the JPMorgan Chase International Speedway, developed in Tampa, where we host our companywide annual finals.

Our AWS DeepRacer learning program now runs in 20 cities and 3,500 people have participated over the past two years. They have gained knowledge of the AWS console, Python, Amazon SageMaker, Jupyter notebooks, and reinforcement learning. Our biggest success is watching people change roles due to their participation.

We recently introduced the AWS DeepRacer Driving License, so hiring managers can see that applicants have attained a recognized standard. It includes a training curriculum that people can follow that enables them to both be knowledgeable and competitive. They also need to attain a certain lap time to prove they have been able to apply the knowledge they have gained.

JPMorgan Chase is now a cloud first organization. With the excitement and interest in the Drivers License, application teams have started to look towards the cloud and have found they are more likely to have technologists in their team with AWS skills. These individuals have then been able to apply their new skills in their day-to-day work.

In 2021, more than 80,000 participants from over 150 countries participated in AWS DeepRacer. As a testament to the work our employees have done with AWS DeepRacer, seven of the 40 racers in AWS’s global championships were JPMorgan Chase technologists. When the dust had settled, our employees topped the podium with first, second, and seventh place finishes. This was a huge achievement against some excellent competitors, and I apologize to anyone sitting near us in the arena at AWS re:Invent for all the shouting and screams of excitement.

This year’s entry to the AWS Championship finals can be achieved by racing on either virtual or physical tracks. We’re looking to get our tracks out and invite our competitors to come and learn, share ideas, enjoy pizza and practice on our tracks. We have also open-sourced two tools that we have created:

  • DeepRacer on the Spot – This tool placed third in our Annual Hackathon in Houston. It allows teams to train models on Amazon Elastic Compute Cloud (Amazon EC2) instances using Spot pricing, which can be up to 90% cheaper than training on the console.
  • Guru – Developed by one of our participants in London, this log analysis tool provides visualization of what the car is doing on the track at any point and how it is being rewarded.

Racing this year is going to be particularly interesting we continue to expand our presence with top racers. Yousef, Roger, and Tyler will be trying to knock Sairam off the podium, and a couple of groups of MDs are forming their own teams—look out for Managing Directions! I would say that my money is on our graduate talent, but that might be career limiting. We look forward to collaborating with our fellow racers on the tools we are releasing and invite you to race on our tracks.

AWS DeepRacer is at the forefront of making us a cloud-ready organization. To learn more about how you can drive collaboration and ML learning like JPMorgan Chase with AWS DeepRacer, join my session on Wednesday, November 30th at 2:30 PM.


About the author

Stephen Carrad is a DevOps Manager at JPMorgan Chase. He also leads the JPMorgan Chase DeepRacer Learning Program to grow his team building skills and support the firm’s widespread public cloud adoption. Outside of work, Stephen enjoys trying to keep up with his teenage children whilst skiing or cycling and coaching his local under-16 rugby team.

Read More

Apply fine-grained data access controls with AWS Lake Formation and Amazon EMR from Amazon SageMaker Studio

Apply fine-grained data access controls with AWS Lake Formation and Amazon EMR from Amazon SageMaker Studio

Amazon SageMaker Studio is a fully integrated development environment (IDE) for machine learning (ML) that enables data scientists and developers to perform every step of the ML workflow, from preparing data to building, training, tuning, and deploying models. Studio comes with built-in integration with Amazon EMR so that data scientists can interactively prepare data at petabyte scale using open-source frameworks such as Apache Spark, Hive, and300 Presto right from within Studio notebooks. Data is often stored in data lakes managed by AWS Lake Formation, enabling you to apply fine-grained access control through a simple grant or revoke mechanism. We’re excited to announce that Studio now supports applying this fine-grained data access control with Lake Formation when accessing data through Amazon EMR.

Until now, when you ran multiple data processing jobs on an EMR cluster, all the jobs used the same AWS Identity and Access Management (IAM) role for accessing data—namely, the cluster’s Amazon Elastic Compute Cloud (Amazon EC2) instance profile. Therefore, to run jobs that needed access to different data sources such as different Amazon Simple Storage Service (Amazon S3) buckets, you had to configure the EC2 instance profile with policies that allowed access to the union of all such data sources. Additionally, for enabling groups of users with differential access to data, you had to create multiple separate clusters, one for each group, resulting in operational overheads. Separately, jobs submitted to Amazon EMR from Studio notebooks were unable to apply fine-grained data access control with Lake Formation.

Starting with the release of Amazon EMR 6.9, when you connect to EMR clusters from Studio notebooks, you can visually browse and choose an IAM role on the fly called the runtime IAM role. Subsequently, all your Apache Spark, Apache Hive, or Presto jobs created from Studio notebooks will access only the data and resources permitted by policies attached to the runtime role. Also, when data is accessed from data lakes managed with Lake Formation, you can enforce table-level and column-level access using policies attached to the runtime role.

With this new capability, multiple Studio users can connect to the same EMR cluster, each using a runtime IAM role scoped with permissions matching their individual level of access to data. Their user sessions are also completely isolated from one another on the shared cluster. With this ability to control fine-grained access to data on the same shared cluster, you can simplify provisioning of EMR clusters, thereby reducing operational overhead and saving costs.

In this post, we demonstrate how to use a Studio notebook to connect to an EMR cluster using runtime roles. We provide a sample Studio Lifecycle Configuration that can help configure the EMR runtime roles that a Studio user profile has access to. Additionally, we manage data access in a data lake via Lake Formation by enforcing row-level and column-level permissions to the EMR runtime roles.

Solution overview

We demonstrate this solution with an end-to-end use case using a sample dataset, the TPC data model. This data represents transaction data for products and includes information such as customer demographics, inventory, web sales, and promotions. To demonstrate fine-grained data access permissions, we consider the following two users:

  • David, a data scientist on the marketing team. He is tasked with building a model on customer segmentation, and is only permitted to access non-sensitive customer data.
  • Tina, a data scientist on the sales team. She is tasked with building the sales forecast model, and needs access to sales data for the particular region. She is also helping the product team with innovation, and therefore needs access to product data as well.

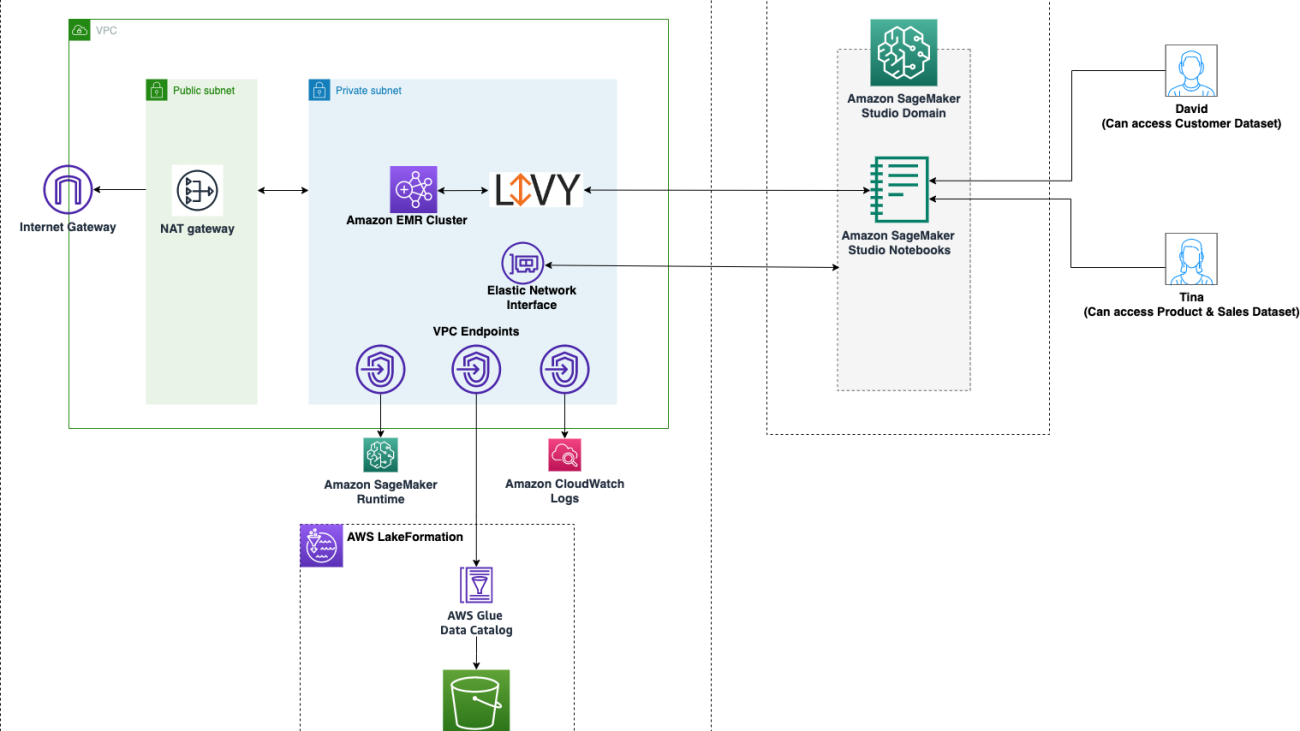
The architecture is implemented as follows:

  • Lake Formation manages the data lake, and the raw data is available in S3 buckets
  • Amazon EMR is used to query the data from the data lake and perform data preparation using Spark
  • IAM roles are used to manage data access using Lake Formation
  • Studio is used as the single visual interface to interactively query and prepare the data

The following diagram illustrates this architecture.

The following sections walk through the steps required to enable runtime IAM roles for Amazon EMR integration with an existing Studio domain. You can use the provided AWS CloudFormation stack in the Deploy the solution section below to set up the architectural components for this solution.

Prerequisites

Before you get started, make sure you have the following prerequisites:

Set up Amazon EMR with runtime roles

The EMR cluster should be created with IAM runtime roles enabled. For more details on using runtime roles with Amazon EMR, see Configure runtime roles for Amazon EMR steps. Associating runtime roles with EMR clusters is supported in Amazon EMR 6.9. Make sure the following configuration is in place:

  • The EMR runtime role’s trust policy should allow the EMR EC2 instance profile to assume the role
  • The EMR EC2 instance profile role should be able to assume the EMR runtime roles
  • The EMR cluster should be created with encryption in transit

You can optionally choose to pass the SourceIdentity (the Studio user profile name) for monitoring the user resource access. Follow the steps outlined in Monitoring user resource access from Amazon SageMaker Studio to enable SourceIdentity for your Studio domain.

Finally, refer to Prepare Data using Amazon EMR for detailed setup and networking instructions on integrating Studio with EMR clusters.

Create bootstrap action for the cluster

You need to run a bootstrap action on the cluster to ensure Studio notebook’s connectivity with EMR through runtime roles. Complete the following steps:

  1. Download the bootstrap script from s3://emr-data-access-control-<region>/customer-bootstrap-actions/gcsc/replace-rpms.sh, replacing region with your region
  2. Download this RPM file from s3://emr-data-access-control-<region>/customer-bootstrap-actions/gcsc/emr-secret-agent-1.18.0-SNAPSHOT20221121212949.noarch.rpm
  3. Upload both files to an S3 bucket in your account and region
  4. When creating your EMR cluster, include the following bootstrap action:
    --bootstrap-actions "Path=<S3-URI-of-the-bootstrap-script>,Args=[<S3-URI-of-the-RPM-file>]"

Update the Studio execution role

Your Studio user’s execution role needs to be updated to allow the GetClusterSessionCredentials API action. Add the following policy to the Studio execution role, replacing the resource with the cluster ARNs you wish to allow your users to connect to:

{
    "Version": "2012-10-17",
    "Statement": [
        {
            "Sid": "AllowEMRRuntimeRole",
            "Effect": "Allow", 
            "Action": "elasticmapreduce:GetClusterSessionCredentials",
            "Resource": [
"arn:aws:elasticmapreduce::<AWS_Account>:cluster/<Cluster-IDs>"
],
            "Condition": {
                "StringLike": {
                    "elasticmapreduce:ExecutionRoleArn": [
                        "arn:aws:iam::<AWS_Account>:role/<EMR-execution-roles>"
                    ]
                }
            }
        }
    ]
}

You can also use conditions to control which EMR execution roles can be used by the Studio execution role.

Alternatively, you can attach a role such as below, which restricts access to clusters based on resource tags. This allows for tag-based access control, and you can use the same policy statements across user roles, instead of explicitly adding cluster ARNs.

{
    "Version": "2012-10-17",
    "Statement": [
        {
            "Sid": "AllowEMRRuntimeRole",
            "Effect": "Allow", 
            "Action": "elasticmapreduce:GetClusterSessionCredentials",
            "Resource": “*”,
            "Condition": {
                "StringEquals": {
                    "elasticmapreduce:ResourceTag/<tag-key>": "<tag-value>"
                }
            }
        }
    ]
}

Set up role configurations through Studio LCC

By default, the Studio UI uses the Studio execution role to connect to the EMR cluster. If your user can access multiple roles, they can update the EMR cluster connection commands with the role ARN they want to pass as a runtime role. For a better user experience, you can set up a configuration file on the user’s home directory on Amazon Elastic File System (Amazon EFS), which automatically informs the Studio UI of the roles that are available to connect for the user. You can also automate this process through Studio Lifecycle Configurations. We provide the following sample Lifecycle Configuration script to configure the roles:

#!/bin/bash

set -eux

FILE_DIRECTORY="/home/sagemaker-user/.sagemaker-analytics-configuration-DO_NOT_DELETE"
FILE_NAME="emr-configurations-DO_NOT_DELETE.json"
FILE="$FILE_DIRECTORY/$FILE_NAME"

mkdir -p $FILE_DIRECTORY

cat <<'EOF' > "$FILE"
{
    "emr-execution-role-arns":
    {
      "<AccountID-where-cluster-exists>": [
          "arn:aws:iam::<AccountID>:role/<emr-execution-role-1>",
          "arn:aws:iam::<AccountID>:role/<emr-execution-role-2>"
      ]
    }
}
EOF

Connect to clusters from the Studio UI

After the role and Lifecycle Configuration scripts are set up, you can launch the Studio UI and connect to the clusters when you create a new notebook using any of the following kernels:

  • DataScience – Python 3 kernel
  • DataScience 2.0 – Python 3 kernel
  • DataScience 3.0 – Python 3 kernel
  • SparkAnalytics 1.0 – SparkMagic and PySpark kernels
  • SparkAnalytics 2.0 – SparkMagic and PySpark kernels
  • SparkMagic – PySpark kernel

Note: The Studio UI for connecting to EMR clusters using runtime roles work only on JupyterLab version 3. See Jupyter versioning for details on upgrading to JL3.

Deploy the solution

To test out the solution end to end, we provide a CloudFormation template that sets up the services included in the architecture, to enable repeatable deployments. This template creates the following resources:

  • An S3 bucket for the data lake.
  • An EMR cluster with EMR runtime roles enabled.
  • IAM roles for accessing the data in data lake, with fine-grained permissions:
    • Marketing-data-access-role
    • Sales-data-access-role
    • Electronics-data-access-role
  • A Studio domain and two user profiles. The Studio execution roles for the users allow the users to assume their corresponding EMR runtime roles.
  • A Lifecycle Configuration to enable the selection of the role to use for the EMR connection.
  • A Lake Formation database populated with the TPC data.
  • Networking resources required for the setup, such as VPC, subnets, and security groups.

To deploy the solution, complete the following steps:

  1. Choose Launch Stack to launch the CloudFormation stack:
  2. Enter a stack name, provide the following parameters –
    • An idle timeout for the EMR cluster (to avoid paying for the cluster when it’s not being used).
    • An S3 URI with the EMR encryption key. You can follow the steps in the EMR documentation here to generate a key and zip file specific to your region. If you are deploying in US East (N. Virginia), remember to use CN=*.ec2.internal, as specified in the documentation here. Make sure to upload the zip file on a S3 bucket in the same region as your CloudFormation stack deployment.
  3. Select I acknowledge that AWS CloudFormation might create IAM resources with custom names.
  4. Choose Create stack.

Once the Stack is created, allow Amazon EMR to query Lake Formation by updating the External Data Filtering settings on Lake Formation. Follow the instructions provided in the Lake Formation guide here, and choose ‘Amazon EMR’ for Session tag values, and enter your AWS account ID under AWS account IDs.

Test role-based data access

With the infrastructure in place, you’re ready to test out the fine-grained data access for the two Studio users. To recap, the user David should only be able to access non-sensitive customer data. Tina can access data in two tables: sales and product information. Let’s test each user profile.

David’s user profile

To test your data access with David’s user profile, complete the following steps:

  1. Log in to the AWS console.
  2. From the created Studio domain, launch Studio from the user profile david-non-sensitive-customer.
  3. In the Studio UI, start a notebook with any of the supported kernels, e.g., SparkMagic image with the PySpark kernel.

The cluster is pre-created in the account.

  1. Connect to the cluster by choosing Cluster in your notebook and choosing the cluster <StackName>-emr-cluster. In the role selector pop-up, choose the <StackName>-marketing-data-access-role.
  2. Choose Connect.
    This will automatically create a notebook cell with magic commands to connect to the cluster. Wait for the cell to execute and the connection to be established before proceeding with the remaining steps.

Now let’s query the marketing table from the notebook.

  1. In a new cell, enter the following query and run the cell:
    sqlContext.sql("show databases").show()
    # use the TPC dataset
    sqlContext.sql("use tpc")
    sqlContext.sql("select * from dl_tpc_customer limit 10").show()

After the cell runs successfully, you can view the first 10 records in the table. Note that you can’t view the customers’ name, as the user only has permissions to read non-sensitive data, through column-level filtering.

Let’s test to make sure David can’t read any sensitive customer data.

  1. In a new cell, run the following query:
    sqlContext.sql("select * from dl_tpc_customer_address limit 10").show()

This cell should throw an Access Denied error.

Tina’s user profile

Tina’s Studio execution role allows her to access the Lake Formation database using two EMR execution roles. This is achieved by listing the role ARNs in a configuration file in Tina’s file directory. These roles can be set using Studio Lifecycle Configurations to persist the roles across app restarts. To test Tina’s access, complete the following steps:

  1. Launch Studio from the user profile tina-sales-electronics.

It’s a good practice to close any previous Studio sessions on your browser when switching user profiles. There can only be one active Studio user session at a time.

  1. In the Studio UI, start a notebook with any of the supported kernels, e.g., SparkMagic image with the PySpark kernel.
  2. Connect to the cluster by choosing Cluster in your notebook and choosing the cluster <StackName>-emr-cluster.
  3. Choose Connect.

Because Tina’s profile is set up with multiple EMR roles, you’re prompted with a UI drop-down that allows you to connect using multiple roles.

  1. Choose the role <StackName>-sales-data-access-role and choose Connect.

The Studio execution role is also available in the dropdown, as the clusters connect using the user’s execution role by default to connect to the cluster.

You can directly provide Lake Formation access to the user’s execution role as well.This will automatically create a notebook cell with magic commands to connect to the cluster, using the chosen role.Now let’s query the sales table from the notebook.

  1. In a new cell, enter the following query and run the cell:
    sqlContext.sql("show databases").show()
    # use the TPC dataset
    sqlContext.sql("use tpc")
    sqlContext.sql("select * from dl_tpc_web_sales limit 10").show()

After the cell runs successfully, you can view the first 10 records in the table.

Now let’s try accessing the product table.

  1. Choose Cluster again, and choose the cluster.
  2. In the role prompt pop-up, choose the role <StackName>-electronics-data-access-role and connect to the cluster.
  3. After you’re connected successfully to the cluster with the electronics data access role, create a new cell and run the following query:
    sqlContext.sql("select * from dl_tpc_item limit 10").show()

This cell should complete successfully, and you can view the first 10 records in the products table.

With a single Studio user profile, you have now successfully assumed multiple roles, and queried data in Lake Formation using multiple roles, without the need for restarting the notebooks or creating additional clusters. Now that you’re able to access the data using appropriate roles, you can interactively explore the data, visualize the data, and prepare data for training. You also used different user profiles to provide your users in different teams access to a specific table or columns and rows, without the need for additional clusters.

Clean up

When you’re finished experimenting with this solution, clean up your resources:

  1. Shut down the Studio apps for the user profiles. See Shut Down and Update SageMaker Studio and Studio Apps for instructions. Ensure that all apps are deleted before deleting the stack.

The EMR cluster will be automatically deleted after the idle timeout value.

  1. Delete the EFS volume created for the domain. You can view the EFS volume attached with the domain by using a DescribeDomain API call.
  2. Make sure to empty the S3 buckets created by this stack.
  3. Delete the stack from the AWS CloudFormation console.

Conclusion

This post showed you how you can use runtime roles to connect Studio with Amazon EMR to apply fine-grained data access control with Lake Formation. We also demonstrated how multiple Studio users canconnect to the same EMR cluster, each using a runtime IAM role scoped with permissions matching their individual level of access to data. We detailed the steps required to manually set up the integration, and provided a CloudFormation template to set up the infrastructure end to end. This feature is available in the following AWS regions: Europe (Paris), US East (N. Virginia and Ohio) and US West (Oregon), and the CloudFormation template will deploy in US East (N. Virginia and Ohio) and US West (Oregon).

To learn more about using EMR with SageMaker Studio, visit Prepare Data using Amazon EMR. We encourage you to try out this new functionality, and connect with the Machine Learning & AI community if you have any questions or feedback!


About the authors

Durga Sury is a ML Solutions Architect in the Amazon SageMaker Service SA team. She is passionate about making machine learning accessible to everyone. In her 3 years at AWS, she has helped set up AI/ML platforms for enterprise customers. When she isn’t working, she loves motorcycle rides, mystery novels, and hikes with her four-year old husky.

Sriharsh Adari is a Senior Solutions Architect at Amazon Web Services (AWS), where he helps customers work backwards from business outcomes to develop innovative solutions on AWS. Over the years, he has helped multiple customers on data platform transformations across industry verticals. His core area of expertise include Technology Strategy, Data Analytics, and Data Science. In his spare time, he enjoys playing Tennis, binge-watching TV shows, and playing Tabla.

Maira Ladeira Tanke is an ML Specialist Solutions Architect at AWS. With a background in data science, she has 9 years of experience architecting and building ML applications with customers across industries. As a technical lead, she helps customers accelerate their achievement of business value through emerging technologies and innovative solutions. In her free time, Maira enjoys traveling and spending time with her family someplace warm.

Sumedha Swamy is a Principal Product Manager at Amazon Web Services. He leads SageMaker Studio team to build it into the IDE of choice for interactive data science and data engineering workflows. He has spent the past 15 years building customer-obsessed consumer and enterprise products using Machine Learning. In his free time he likes photographing the amazing geology of the American Southwest.

Jun Lyu is a Software Engineer on the SageMaker Notebooks team. He has a Master’s degree in engineering from Duke University. He has been working for Amazon since 2015 and has contributed to AWS services like Amazon Machine Learning, Amazon SageMaker Notebooks, and Amazon SageMaker Studio. In his spare time, he enjoys spending time with his family, reading, cooking, and playing video games.

Read More

AWS Cloud technology for near-real-time cardiac anomaly detection using data from wearable devices

AWS Cloud technology for near-real-time cardiac anomaly detection using data from wearable devices

Cardiovascular diseases (CVDs) are the number one cause of death globally: more people die each year from CVDs than from any other cause.

The COVID-19 pandemic made organizations change healthcare delivery to reduce staff contact with sick people and the overall pressure on the healthcare system. This technology enables organizations to deliver telehealth solutions, which monitor and detect conditions that can put patient health at risk.

In this post, we present an AWS architecture that processes live electrocardiogram (ECG) feeds from common wearable devices, analyzes the data, provides near-real-time information via a web dashboard. If a potential critical condition is detected, it sends real-time alerts to subscribed individuals.

Solution overview

The architecture is divided in six different layers:

  • Data ingestion
  • Live ECG stream storage
  • ECG data processing
  • Historic ECG pathology archive
  • Live alerts
  • Visualization dashboard

The following diagram shows the high-level architecture.

In the following sections, we discuss each layer in more detail.

Data ingestion

The data ingestion layer uses AWS IoT Core as the connection point between the external remote sensors and the AWS Cloud architecture, which is capable of storing, transforming, analyzing, and showing insights from the acquired live feeds from remote wearable devices.

When the data from the remote wearable devices reaches AWS IoT Core, it can be sent using an AWS IoT rule and associated actions.

In the proposed architecture, we use one rule and one action. The rule extracts data from the raw stream using a simple SQL statement, as outlined by the following AWS IoT Core rule definition SQL code.

SELECT device_id, ecg, ppg, bpm, timestamp() as timestamp FROM ‘dt/sensor/#’

The action writes the extracted data from the rule into an Amazon Timestream database.

For more information on how to implement workloads using AWS IoT Core, refer to Implementing time-critical cloud-to-device IoT message patterns on AWS IoT Core.

Live ECG stream storage

Live data arriving from connected ECG sensors is immediately stored in Timestream, which is purposely designed to store time series data.

From Timestream, data is periodically extracted into shards and subsequently processed by AWS Lambda to generate spectrograms and by Amazon Rekognition to perform ECG spectrogram classification.

You can create and manage a Timestream database via the AWS Management Console, from the AWS Command Line Interface (AWS CLI), or via API calls.

On the Timestream console, you can observe and monitor various database metrics, as shown in the following screenshot.

In addition, you can run various queries against a given database.

ECG data processing

The processing layer is composed of Amazon EventBridge, Lambda, and Amazon Rekognition.

The core of the detection centers on the ability to create spectrograms from a time series stride and use Amazon Rekognition Custom Labels, trained with an archive of spectrograms generated from time series strides of ECG data from patients affected by various pathologies, to perform a classification of the incoming ECG data live stream transformed into spectrograms by Lambda.

EventBridge event details

With EventBridge, it’s possible to create event-driven applications at scale across AWS.

In the case of the ECG near-real-time analysis, EventBridge is used to create an event (SpectrogramPeriodicGeneration) that periodically triggers a Lambda function to generate spectrograms from the raw ECG data and send a request to Amazon Rekognition to analyze the spectrograms to detect signs of anomalies.

The following screenshot shows the configuration details of the SpectrogramPeriodicGeneration event.

Lambda function details

The Lambda function GenerateSpectrogramsFromTimeSeries, written entirely in Python, functions as orchestrator among the different steps needed to perform a classification of an ECG spectrogram. It’s a crucial piece of the processing layer that detects if an incoming ECG signal presents signs of possible anomalies.

The Lambda function has three main purposes:

  • Fetch a 1-minute stride from the live ECG stream
  • Generate spectrograms from it
  • Initiate an Amazon Rekognition job to perform classification of the generated spectrograms

Amazon Rekognition details

The ECG analysis to detect if anomalies are present is based on the classification of spectrograms generated from 1-minute-long ECG trace strides.

To accomplish this classification job, we use Rekognition Custom Labels to train a model capable of identifying different cardiac pathologies found in spectrograms generated from ECG traces of people with various cardiac conditions.

To start using Rekognition Custom Labels, we need to specify the locations of the datasets, which contain the data that Amazon Rekognition uses for labeling, training, and validation.

Looking inside of the defined datasets, it’s possible to see more details that Amazon Rekognition has extracted from the given Amazon Simple Storage Service (Amazon S3) bucket.

From this page, we can see the labels that Amazon Rekognition has automatically generated by matching the folder names present in the S3 bucket.

In addition, Amazon Rekognition provides a preview of the labeled images.

The following screenshot shows the details of the S3 bucket used by Amazon Rekognition.

After you have defined a dataset, you can use Rekognition Custom Labels to train on your data, and deploy the model for inference afterwards.

The Rekognition Custom Labels project pages provide details about each available project and a tree representation of all the models that have been created.

Moreover, the project pages show the status of the available models and their performances.

You can choose the models on the Rekognition Custom Labels console to see more details of each model, as shown in the following screenshot.

Further details about the model are available on the Model details tab.

For further assessment of model performance, choose View test results. The following screenshot shows an example of test results from our model.

Historic ECG pathology archive

The pathology archive layer receives raw time series ECG data, generates spectrograms, and stores those in a separate bucket that you can use to further train your Rekognition Custom Labels model.

Visualization dashboard

The live visualization dashboard, responsible for showing real-time ECGs, PPG traces, and live BPM, is implemented via Amazon Managed Grafana.

Amazon Managed Grafana is a fully managed service that is developed together with Grafana Labs and based on open-source Grafana. Enhanced with enterprise capabilities, Amazon Managed Grafana makes it easy for you to visualize and analyze your operational data at scale.

On the Amazon Managed Grafana console, you can create workspaces, which are logically isolated Grafana servers where you can create Grafana dashboards. The following screenshot shows a list of our available workspaces.

You can also set up the following on the Workspaces page:

  • Users
  • User groups
  • Data sources
  • Notification channels

The following screenshot shows the details of our workspace and its users.

In the Data sources section, we can review and set up all the source feeds that populate the Grafana dashboard.

In the following screenshot, we have three sources configured:

You can choose Configure in Grafana for a given data source to configure it directly in Amazon Managed Grafana.

You’re asked to authenticate within Grafana. For this post, we use AWS IAM Identity Center (Successor to AWS Single Sign-On)

After you log in, you’re redirected to the Grafana home page. From here, you can view your saved dashboards. As shown in the following screenshot, we can access our Heart Health Monitoring dashboard.

You can also choose the gear icon in the navigation pane and perform various configuration tasks on the following:

  • Data sources
  • Users
  • User groups
  • Statistics
  • Plugins
  • Preferences

For example, if we choose Data Sources, we can add sources that will feed Grafana boards.

The following screenshot shows the configuration panel for Timestream.

If we navigate to the Heart Health Monitoring dashboard from the Grafana home page, we can review the widgets and information included within the dashboard.

Conclusion

With services like AWS IoT Core, Lambda, Amazon SNS, and Grafana, you can build a serverless solution with an event-driven architecture capable of ingesting, processing, and monitoring data streams in near-real time from a variety of devices, including common wearable devices.

In this post, we explored one way to ingest, process, and monitor live ECG data generated from a synthetic wearable device in order to provide insights to help determine if anomalies might be present in the ECG data stream.

To learn more about how AWS is accelerating innovation in healthcare, visit AWS for Health.


About the Author

Benedetto Carollo is a Senior Solution Architect for medical imaging and healthcare at Amazon Web Services in Europe, Middle East, and Africa. His work focuses on helping medical imaging and healthcare customers solve business problems by leveraging technology. Benedetto has over 15 years of experience of technology and medical imaging and has worked for companies like Canon Medical Research and Vital Images. Benedetto received his summa cum laude MSc in Software Engineering from the University of Palermo – Italy.

Read More

Building interactive agents in video game worlds

Most artificial intelligence (AI) researchers now believe that writing computer code which can capture the nuances of situated interactions is impossible. Alternatively, modern machine learning (ML) researchers have focused on learning about these types of interactions from data. To explore these learning-based approaches and quickly build agents that can make sense of human instructions and safely perform actions in open-ended conditions, we created a research framework within a video game environment.Today, we’re publishing a paper [INSERT LINK] and collection of videos, showing our early steps in building video game AIs that can understand fuzzy human concepts – and therefore, can begin to interact with people on their own terms.Read More

Building interactive agents in video game worlds

Building interactive agents in video game worlds

Most artificial intelligence (AI) researchers now believe that writing computer code which can capture the nuances of situated interactions is impossible. Alternatively, modern machine learning (ML) researchers have focused on learning about these types of interactions from data. To explore these learning-based approaches and quickly build agents that can make sense of human instructions and safely perform actions in open-ended conditions, we created a research framework within a video game environment.Today, we’re publishing a paper [INSERT LINK] and collection of videos, showing our early steps in building video game AIs that can understand fuzzy human concepts – and therefore, can begin to interact with people on their own terms.Read More

What Is a Smart Hospital?

What Is a Smart Hospital?

Smart hospitals — which utilize data and AI insights to facilitate decision-making at each stage of the patient experience — can provide medical professionals with insights that enable better and faster care.

A smart hospital uses data and technology to accelerate and enhance the work healthcare professionals and hospital management are already doing, such as tracking hospital bed occupancy, monitoring patients’ vital signs and analyzing radiology scans.

What’s the Difference Between a Smart Hospital and a Traditional Hospital? 

Hospitals are continuously generating and collecting data, much of which is now digitized. This creates an opportunity for them to apply such technologies as data analytics and AI for improved insights.

Data that was once stored as a paper file with a patient’s medical history, lab results and immunization information is now stored as electronic health records, or EHRs. Digital CT and MRI scanners, as well as software including the PACS medical imaging storage system, are replacing analog radiology tools. And connected sensors in hospital rooms and operating theaters can record multiple continuous streams of data for real-time and retrospective analysis.

As hospitals transition to these digital tools, they’re poised to make the shift from a regular hospital to a smart hospital — one that not only collects data, but also analyzes it to provide valuable, timely insights.

Natural language processing models can rapidly pull insights from complex pathology reports to support cancer care. Data science can monitor emergency room wait times to resolve bottlenecks. AI-enabled robotics can assist surgeons in the operating room. And video analytics can detect when hand sanitizer supplies are running low or a patient needs attention — such as detecting the risk of falls in the hospital or at home.

What Are Some Benefits of a Smart Hospital?

Smart hospital technology benefits healthcare systems, medical professionals and patients in the following ways: 

  • Healthcare providers: Smart hospital data can be used to help healthcare facilities optimize their limited resources, increasing operational efficiency for a better patient-centric approach. Sensors can monitor patients when they’re alone in the room. AI algorithms can help inform which patients should be prioritized based on the severity of their case. And telehealth solutions can help deliver care to patients outside of hospital visits.
  • Clinicians: Smart hospital tools can enable doctors, nurses, medical imaging technicians and other healthcare experts to spend more time focusing on patient care by taking care of routine or laborious tasks, such as writing notes about each patient interaction, segmenting anatomical structures in an MRI or converting doctor’s notes into medical codes for insurance billing. They can also aid clinical decision-making with AI algorithms that provide a second opinion or triage recommendation for individual patients based on historical data.
  • Patients: Smart hospital technology can bring health services closer to the goal of consistent, high-quality patient care — anywhere in the world, from any doctor. Clinicians vary in skill level, areas of expertise, access to resources and time available per patient. By deploying AI and robotics to monitor patterns and automate time-consuming tasks, smart hospitals can allow clinicians to focus on interacting with their patients for a better experience.

How Can I Make My Hospital Smart? 

Running a smart hospital requires an entire ecosystem of hardware and software solutions working in harmony with clinician workflows. To accelerate and improve patient care, every application, device, sensor and AI model in the system must share data and insights across the institution.

Think of the smart hospital as an octopus. Its head is the organization’s secure server that stores and processes the entire facility’s data. Each of its tentacles is a different department — emergency room, ICU, operating room, radiology lab — covered in sensors (octopus suckers) that take in data from their surroundings.

If each tentacle operated in a silo, it would be impossible for the octopus to take rapid action across its entire body based on the information sensed by a single arm. Every tentacle sends data back to the octopus’ central brain, enabling the creature to flexibly respond to its changing environment.

In the same way, the smart hospital is a hub-and-spoke model, with sensors distributed across a facility that can send critical insights back to a central brain, helping inform facility-wide decisions. For instance, if camera feeds in an operating room show that a surgical procedure is almost complete, AI would alert staff in the recovery room to be ready for the patient’s arrival.

To power smart hospital solutions, medical device companies, academic medical centers and startups are turning to NVIDIA Clara, an end-to-end AI platform that integrates with the entire hospital network — from medical devices running real-time applications to secure servers that store and process data in the long term. It supports edge, data center and cloud infrastructure, numerous software libraries, and a global partner ecosystem to power the coming generation of smart hospitals.

Smart Hospital Operations and Patient Monitoring

A bustling hospital has innumerable moving parts — patients, staff, medicine and equipment — presenting an opportunity for AI automation to optimize operations around the facility.

While a doctor or nurse can’t be at a patient’s side at every moment of their hospital stay, a combination of intelligent video analytics and other smart sensors can closely monitor patients, alerting healthcare providers when the person is in distress and needs attention.

In an ICU, for instance, patients are connected to monitoring devices that continuously collect vital signs. Many of these continuously beep with various alerts, which can lead healthcare practitioners to sometimes overlook the alarm of a single sensor.

By instead aggregating the streaming data from multiple devices into a single feed, AI algorithms can analyze the data in real time, helping more quickly detect if a patient’s condition takes a sudden turn for the better or worse.

The Houston Methodist Institute for Academic Medicine is working with Mark III Systems, an Elite member of the NVIDIA Partner Network, to deploy an AI-based tool called DeepStroke that can detect stroke symptoms in triage more accurately and earlier based on a patient’s speech and facial movements. By integrating these AI models into the emergency room workflow, the hospital can more quickly identify the proper treatment for stroke patients, helping ensure clinicians don’t miss patients who would potentially benefit from life-saving treatments.

Using enterprise-grade solutions from Dell and NVIDIA — including GPU-accelerated Dell PowerEdge servers, the NVIDIA Fleet Command hybrid cloud system and the DeepStream software development kit for AI streaming analytics — Inception startup Artisight manages a smart hospital network including over 2,000 cameras and microphones at Northwestern Medicine.

One of Artisight’s models alerts nurses and physicians to patients at risk of harm. Another system, based on in-door positioning system data, automates clinic workflows to maximize staff productivity and improve patient satisfaction. A third detects preoperative, intraoperative and postoperative events to coordinate surgical throughput.

These systems make it easy to add functionality regardless of location: an AI-backed sensor network that monitors hospital rooms to prevent a patient from falling can also detect when hospital supplies are running low, or when an operating room needs to be cleaned.The systems even extend beyond the hospital walls via Artisight’s integrated teleconsult tools to monitor at-risk patients at home.

The last key element of healthcare operations is medical coding, the process of turning a clinician’s notes into a set of alphanumeric codes representing every diagnosis and procedure. These codes are of particular significance in the U.S., where they form the basis for the bills that doctors, clinics and hospitals submit to stakeholders including insurance providers and patients.

Inception startup Fathom has developed AI models to automate the painstaking process of medical coding, reducing costs while increasing speed and precision. Founded in 2016, the company works with the nation’s largest health systems, billing companies and physician groups, coding over 20 million patient encounters annually.

Medical Imaging in Smart Hospitals

Deep learning first gained its popularity as a tool for identifying objects in images. This is one of the earliest healthcare industry uses for the technology, too. There are dozens of AI models with regulatory approval in the medical imaging space, helping radiology departments in smart hospitals accelerate the analysis of CT, MRI and X-ray data.

AI can pre-screen scans, flagging areas that require a radiologist’s attention to save time — giving them more bandwidth to look at additional scans or explain results to patients. It can move critical cases like brain bleeds to the top of a radiologist’s worklist, shortening the time to diagnose and treat life-threatening cases. And it can enhance the resolution of radiology images, allowing clinicians to reduce the necessary dosage per patient.

Leading medical imaging companies and researchers are using NVIDIA technology to power next-generation applications that can be used in smart hospital environments.

Siemens Healthineers developed deep learning-based autocontouring solutions, enabling precise contouring of organs at risk in radiation therapy.

And Fujifilm Healthcare uses NVIDIA GPUs to power its Cardio StillShot software, which conducts precise cardiac imaging during a CT scan. To accelerate its work, the team used software including the NVIDIA Optical Flow SDK to estimate pixel-level motion and NVIDIA Nsight Compute to optimize performance.

Startups in NVIDIA Inception, too, are advancing medical imaging workflows with AI, such as Shanghai-based United Imaging Intelligence. The company’s uAI platform empowers devices, doctors and researchers with full-stack, full-spectrum AI applications, covering imaging, screening, follow-up, diagnosis, treatment and evaluation. Its uVision intelligent scanning system runs on the NVIDIA Jetson edge AI platform.

Learn more about startups using NVIDIA AI for medical imaging applications.

Digital and Robotic Surgery in Smart Hospitals

In a smart hospital’s operating room, intelligent video analytics and robotics are embedded to take in data and provide AI-powered alerts and guidance to surgeons.

Medical device developers and startups are working on tools to advance surgical training, help surgeons plan procedures ahead of time, provide real-time support and monitoring during an operation, and aid in post-surgery recordkeeping and retrospective analysis.

Paris-based robotic surgery company Moon Surgical is designing Maestro, an accessible, adaptive surgical-assistant robotics system that works with the equipment and workflows that operating rooms already have in place. The startup has adopted NVIDIA Clara Holoscan to save time and resources, helping compress its development timeline.

Activ Surgical has selected Holoscan to accelerate development of its AI and augmented-reality solution for real-time surgical guidance. The Boston-based company’s ActivSight technology allows surgeons to view critical physiological structures and functions, like blood flow, that cannot be seen with the naked eye.

And London-based Proximie will use Holoscan to enable telepresence in the operating room, bringing expert surgeons and AI solutions into each procedure. By integrating this information into surgical imaging systems, the company aims to reduce surgical complication rates, improving patient safety and care.

Telemedicine — Smart Hospital Technology at Home

Another part of smart hospital technology is ensuring patients who don’t need to be admitted to the hospital can receive care from home through wearables, smartphone apps, video appointments, phone calls and text-based messaging tools. Tools like these reduce the burden on healthcare facilities — particularly with the use of AI chatbots that can communicate effectively with patients.

Natural language processing AI is powering intelligent voice assistants and chatbots for telemedicine at companies like Curai, a member of the NVIDIA Inception global network of startups.

Curai is applying GPU-powered AI to connect patients, providers and care teams via a chat-based application. Patients can input information about their conditions, access their medical profiles and chat with providers 24/7. The app also supports providers by offering diagnostic and treatment suggestions based on Curai’s deep learning algorithms.

Curai’s main areas of AI focus have been natural language processing (for extracting data from medical conversations), medical reasoning (for providing diagnosis and treatment recommendations), and image processing and classification (largely for images uploaded by patients).

Virtual care tools like Curai’s can be used for preventative or convenient care at any time, or after a patient’s doctor visit to ensure they’re responding well to treatment.

Medical Research Using Smart Hospital Data 

The usefulness of smart hospital data doesn’t end when a patient is discharged — it can inform years of research, becoming part of an institution’s database that helps improve operational efficiency, preventative care, drug discovery and more. With collaborative tools like federated learning, the benefits can go beyond a single medical institution and improve research across the healthcare field globally.

Neurosurgical Atlas, the largest association of neurosurgeons in the world, aims to advance the care of patients suffering from neurosurgical disorders through new, efficient surgical techniques. The Atlas includes a library of surgery recordings and simulations that give neurosurgeons unprecedented understanding of potential pitfalls before conducting an operation, creating a new standard for technical excellence. In the future, Neurosurgical Atlas plans to enable digital twin representations specific to individual patients.

The University of Florida’s academic health center, UF Health, has used digital health records representing more than 50 million interactions with 2 million patients to train GatorTron, a model that can help identify patients for lifesaving clinical trials, predict and alert health teams about life-threatening conditions, and provide clinical decision support to doctors.

The electronic medical records were also used to develop SynGatorTron, a language model that can generate synthetic health records to help augment small datasets — or enable AI model sharing while preserving the privacy of real patient data.

In Texas, MD Anderson is harnessing hospital records for population data analysis. Using the NVIDIA NeMo toolkit for natural language processing, the researchers developed a conversational AI platform that performs genomic analysis with cancer omics data — including survival analysis, mutation analysis and sequencing data processing.

Learn more about smart hospital technology and subscribe to NVIDIA healthcare news

The post What Is a Smart Hospital? appeared first on NVIDIA Blog.

Read More

Identifying landmarks with Amazon Rekognition Custom Labels

Identifying landmarks with Amazon Rekognition Custom Labels

Amazon Rekognition is a computer vision service that makes it simple to add image and video analysis to your applications using proven, highly scalable, deep learning technology that does not require machine learning (ML) expertise. With Amazon Rekognition, you can identify objects, people, text, scenes, and activities in images and videos and detect inappropriate content. Amazon Rekognition also provides highly accurate facial analysis and facial search capabilities that you can use to detect, analyze, and compare faces for a wide variety of use cases.

Amazon Rekognition Custom Labels is a feature of Amazon Rekognition that makes it simple to build your own specialized ML-based image analysis capabilities to detect unique objects and scenes integral to your specific use case.

Some common use cases of Rekognition Custom Labels include finding your logo in social media posts, identifying your products on store shelves, classifying machine parts in an assembly line, distinguishing between healthy and infected plants, and more.

Amazon Rekognition Labels supports popular landmarks like the Brooklyn Bridge, Colosseum, Eiffel Tower, Machu Picchu, Taj Mahal, and more. If you have other landmarks or buildings not yet supported by Amazon Rekognition, you can still use Amazon Rekognition Custom Labels.

In this post, we demonstrate using Rekognition Custom Labels to detect the Amazon Spheres building in Seattle.

With Rekognition Custom Labels, AWS takes care of the heavy lifting for you. Rekognition Custom Labels builds off the existing capabilities of Amazon Rekognition, which is already trained on tens of millions of images across many categories. Instead of thousands of images, you simply need to upload a small set of training images (typically a few hundred images or less) that are specific to your use case via our straightforward console. Amazon Rekognition can begin training in just a few clicks. After Amazon Rekognition begins training from your image set, it can produce a custom image analysis model for you within few minutes or hours. Behind the scenes, Rekognition Custom Labels automatically loads and inspects the training data, selects the suitable ML algorithms, trains a model, and provides model performance metrics. You can then use your custom model via the Rekognition Custom Labels API and integrate it into your applications.

Solution overview

For our example, we use the Amazon Spheres building in Seattle. We train a model using Rekognition Custom Labels; whenever similar images are used, the algorithm should identify it as Amazon Spheres instead of Dome, Architecture, Glass building, or other labels.

Let’s first show an example of using the label detection feature of Amazon Rekognition, where we feed the image of Amazon Spheres without any custom training. We use the Amazon Rekognition console to open the label detection demo and upload our photo.

After the image is uploaded and analyzed, we see labels with their confidence scores under Results. In this case, Dome was detected with confidence score of 99.2%, Architecture with 99.2%, Building with 99.2%, Metropolis with 79.4%, and so on.

We want to use custom labeling to produce a computer vision model that can label the image Amazon Spheres.

In the following sections, we walk you through preparing your dataset, creating a Rekognition Custom Labels project, training the model, evaluating the results, and testing it with additional images.

Prerequisites

Before starting with the steps, there are quotas for Rekognition Custom Labels that you need to be aware of. If you want to change the limits, you can request a service limit increase.

Create your dataset

If this is your first time using Rekognition Custom Labels, you’ll be prompted to create an Amazon Simple Storage Service (Amazon S3) bucket to store your dataset.

For this blog demonstration, we have used images of the Amazon Spheres, which we captured while we visited Seattle, WA. Feel free to use your own images as per your need.

Copy your dataset to the newly created bucket, which stores your images inside their respective prefixes.

Create a project

To create your Rekognition Custom Labels project, complete the following steps:

  1. On the Rekognition Custom Labels console, choose Create a project.
  2. For Project name, enter a name.
  3. Choose Create project.

    Now we specify the configuration and path of your training and test dataset.
  4. Choose Create dataset.

You can start with a project that has a single dataset, or a project that has separate training and test datasets. If you start with a single dataset, Rekognition Custom Labels splits your dataset during training to create a training dataset (80%) and a test dataset (20%) for your project.

Additionally, you can create training and test datasets for a project by importing images from one of the following locations:

For this post, we use our own custom dataset of Amazon Spheres.

  1. Select Start with a single dataset.
  2. Select Import images from S3 bucket.
  3. For S3 URI, enter the path to your S3 bucket.
  4. If you want Rekognition Custom Labels to automatically label the images for you based on the folder names in your S3 bucket, select Automatically assign image-level labels to images based on the folder name.
  5. Choose Create dataset.

A page opens that shows you the images with their labels. If you see any errors in the labels, refer to Debugging datasets.

Train the model

After you have reviewed your dataset, you can now train the model.

  1. Choose train model.
  2. For Choose project, enter the ARN for your project if it’s not already listed.
  3. Choose Train model.

In the Models section of the project page, you can check the current status in the Model status column, where the training is in progress. Training time typically takes 30 minutes to 24 hours to complete, depending on several factors such as number of images and number of labels in the training set, and types of ML algorithms used to train your model.

When the model training is complete, you can see the model status as TRAINING_COMPLETED. If the training fails, refer to Debugging a failed model training.

Evaluate the model

Open the model details page. The Evaluation tab shows metrics for each label, and the average metric for the entire test dataset.

The Rekognition Custom Labels console provides the following metrics as a summary of the training results and as metrics for each label:

You can view the results of your trained model for individual images, as shown in the following screenshot.

Test the model

Now that we’ve viewed the evaluation results, we’re ready to start the model and analyze new images.

You can start the model on the Use model tab on the Rekognition Custom Labels console, or by using the StartProjectVersion operation via the AWS Command Line Interface (AWS CLI) or Python SDK.

When the model is running, we can analyze the new images using the DetectCustomLabels API. The result from DetectCustomLabels is a prediction that the image contains specific objects, scenes, or concepts. See the following code:

aws rekognition detect-custom-labels 
--project-version-arn <value> 
--image '{"S3Object": {"Bucket":<"MY_BUCKET">,"Name":<"PATH_TO_MY_IMAGE">}}' 
--region <value>

In the output, you can see the label with its confidence score:

{
    "Custom Labels": [
        {
            "Name": "Amazon Spheres",
            "Confidence": 93.55500030517578
        }
    ]
}

As you can see from the result, just with few simple clicks, you can use Rekognition Custom Labels to achieve accurate labeling outcomes. You can use this for a multitude of image use cases, such as identifying custom labeling for food products, pets, machine parts, and more.

Clean up

To clean up the resources you created as part of this post and avoid any potential recurring costs, complete the following steps:

  1. On the Use model tab, stop the model.
    Alternatively, you can stop the model using the StopProjectVersion operation via the AWS CLI or Python SDK.Wait until the model is in the Stopped state before continuing to the next steps.
  2. Delete the model.
  3. Delete the project.
  4. Delete the dataset.
  5. Empty the S3 bucket contents and delete the bucket.

Conclusion

In this post, we showed how to use Rekognition Custom Labels to detect building images.

You can get started with your custom image datasets, and with a few simple clicks on the Rekognition Custom Labels console, you can train your model and detect objects in images. Rekognition Custom Labels can automatically load and inspect the data, select the right ML algorithms, train a model, and provide model performance metrics. You can review detailed performance metrics such as precision, recall, F1 scores, and confidence scores.

The day has come when we can now identify popular buildings like Empire State Building in New York City, the Taj Mahal in India, and many others across the world pre-labeled and ready to use for intelligence in your applications. But if you have other landmarks currently not yet supported by Amazon Rekognition Labels, look no further and try out Amazon Rekognition Custom Labels.

For more information about using custom labels, see What Is Amazon Rekognition Custom Labels? Also, visit our GitHub repo for an end-to-end workflow of Amazon Rekognition custom brand detection.


About the Authors:

Suresh Patnam is a Principal BDM – GTM AI/ML Leader at AWS. He works with customers to build IT strategy, making digital transformation through the cloud more accessible by leveraging Data & AI/ML. In his spare time, Suresh enjoys playing tennis and spending time with his family.

Bunny Kaushik is a Solutions Architect at AWS. He is passionate about building AI/ML solutions on AWS and helping customers innovate on the AWS platform. Outside of work, he enjoys hiking, climbing, and swimming.

Read More

Implementing Amazon Forecast in the retail industry: A journey from POC to production

Implementing Amazon Forecast in the retail industry: A journey from POC to production

Amazon Forecast is a fully managed service that uses statistical and machine learning (ML) algorithms to deliver highly accurate time-series forecasts. Recently, based on Amazon Forecast, we helped one of our retail customers achieve accurate demand forecasting, within 8 weeks. The solution improved the manual forecast by an average of 10% in regards to the WAPE metric. This leads to a direct savings of 16 labor hours monthly. In addition, we estimated that by fulfilling the correct number of items, sales could increase by up to 11.8%. In this post, we present the workflow and the critical elements to implement—from proof of concept (POC) to production—a demand forecasting system with Amazon Forecast, focused on challenges in the retail industry.

Background and current challenges of demand forecasting in the retail industry

The goal of demand forecasting is to estimate future demand from historical data, and to help store replenishment and capacity allocation. With demand forecasting, retailers are able to position the right amount of inventory at each location in their network to meet demand. Therefore, an accurate forecasting system can drive a wide range of benefits across different business functions, such as:

  • Increasing sales from better product availability and reducing the effort of inter-store transfer waste
  • Providing more reliable insight to improve capacity utilization and proactively avoid bottlenecks in capacity provisioning
  • Minimizing inventory and production costs and improve inventory turnover
  • Presenting an overall better customer experience

ML techniques demonstrate great value when a large volume of good quality data is present. Today, experience-based replenishment management or demand forecast is still the mainstream for most retailers. With the goal to improve the customer experience, more and more retailers are willing to replace experience-based demand forecasting systems with ML-based forecasts. However, retailers face multiple challenges when implementing ML-based demand forecasting systems into production. We summarize the different challenges into three categories: data challenges, ML challenges, and operational challenges.

Data challenges

A large volume of clean, quality data is a key requirement for driving accurate ML-based predictions. Quality data, including historical sales and sales-related data (such as inventory, item pricing, and promotions), needs to be collected and consolidated. The diversity of data from multiple resources requires a modern data platform to unite data silos. In addition, access to data in a timely manner is necessary for frequent and fine-grained demand forecasts.

ML challenges

Developing advanced ML algorithms requires expertise. Implementing the right algorithms for the right problem needs both in-depth domain knowledge and ML competences. In addition, learning from large available datasets requires a scalable ML infrastructure. Moreover, maintaining ML algorithms in production requires ML competences in order to analyze the root cause of model degradation and correctly retrain the model.

To solve practical business problems, producing accurate forecasts is only part of the story. Decision-makers need probabilistic forecasts at different quantiles make important customer experience vs. financial results trade-off decisions. They also need to explain predictions to stakeholders, and perform what-if analyses to investigate how different scenarios might affect forecast results.

Operational challenges

Reducing the operational effort of maintaining a cost-effective forecasting system is the third principal challenge. In a common scenario of demand forecasting, each item at each location has its own forecast. A system that can manage hundreds of thousands of forecasts at any time is required. In addition, business end-users need the forecasting system to be integrated into existing downstream systems, such as existing supply chain management platforms, so that they can use ML-based systems without modifying existing tools and processes.

These challenges are especially acute when business are large, dynamic, and growing. To address these challenges, we share a customer success story that reduces the efforts to quickly validate the potential business gain. This is achieved through prototyping with Amazon Forecast—a fully managed service that provides accurate forecasting results without the need to manage underlying infrastructure resources and algorithms.

Rapid prototyping for an ML-based forecasting system with Amazon Forecast

Based on our experience, we often see that retail customers are willing to initiate a proof of concept on their sales data. This can be done within a range of a few days to a few weeks for rapid prototyping, depending on the data complexity and available resources to iterate through the model tuning process. During prototyping, we suggest using sprints to effectively manage the process, and separating the POC into data exploration, iterative improvement, and automation phases.

Data exploration

Data exploration often involves intense discussion with data scientists or business intelligence analysts to get familiar with the historical sales dataset and available data sources that can potentially impact forecast results, such as inventory and historical promotional events. One of the most efficient ways is to consolidate the sales data, as the target dataset, from the data warehouse at the early stage of the project. This is based on the fact that forecast results are often dominated by the target dataset patterns. Data warehouses often store day-to-day business data, and an exhaustive understanding within a short period of time is difficult and time consuming. Our suggestion is to concentrate on generating the target dataset and make sure this dataset is correct. These data exploration and baseline results can often be achieved within a few days, and this can determine if the target data can be accurately forecasted. We discuss data forecastability later in this post.

Iteration

After we have the baseline results, we can continue adding more related data to see how these can impact accuracy. This is often done through a deep dive into additional datasets; for more information, refer to Using Related Time Series Datasets and Using Item Metadata Datasets.

In some cases, it may be possible to improve accuracy in Amazon Forecast by training the models with similarly behaving subsets of the dataset, or by removing the sparse data from the dataset. During this iterative improvement phase, the challenging part—true for all ML projects—is that the current iteration depends on the previous iteration’s key findings and insights, so rigorous analysis and reporting is key for success.

Analysis can be done quantitatively and empirically. The quantitative aspect refers to evaluation during the backtesting and comparing the accuracy metric, such as WAPE. The empirical aspect refers to visualizing the prediction curve and actual target data, and using the domain knowledge to incorporate potential factors. These analyses help you iterate faster to bridge the gap between forecasted results and target data. In addition, presenting such results via a weekly report can often provide confidence to business end-users.

Automation

The final step often involves the discussion of POC to production procedure and automation. Because the ML project is constrained by the total project duration, we might not have enough time to explore every possibility. Therefore, indicating the potential area throughout the findings during the project can often earn trust. In addition, automation can help business end-users evaluate Forecast for a longer period, because they can use an existing predictor to generate forecasts with the updated data.

The success criteria can be evaluated with generated results, both from technical and business perspectives. During the evaluation period, we can estimate potential benefits for the following:

  • Increasing the forecast accuracy (technical) – Compute the prediction accuracy with regards to actual sales data, and compare with the existing forecast system, including manual forecasts
  • Reducing waste (business) – Reduce over-forecasting in order to reduce waste
  • Improving in-stock rates (business) – Reduce under-forecasting in order to improve in-stock rates
  • Estimating the increase of gross profit (business) – Reduce wastage and improve in-stock rates in order to increase gross profit

We summarize the development workflow in the following diagram.

In the following sections, we discuss the important elements to take into consideration during the implementation.

Step-by-step workflow for developing a forecasting system

Target dataset generation

The first step is to generate the target dataset for Forecast. In the retail industry, this refers to the historical time series demand and sales data for retail items (SKUs). When preparing the dataset, one important aspect is granularity. We should consider the data granularity from both business requirements and technical requirements.

The business defines how forecasting results in the production system:

  • Horizon – The number of time steps being forecasted. This depends on the underlying business problem. If we want to refill the stock level each week, then a weekly forecast or daily forecast seems appropriate.
  • Granularity – The granularity of your forecasts: time frequency such as daily or weekly, different store locations, and different sizes of the same item. In the end, the prediction can be a combination of each store SKU, with daily data points.

Although the aforementioned forecast horizon and granularity should be defined to prioritize the business requirement, we might need to make trade-offs between requirements and feasibility. Take the footwear business as one example. If we want to predict sales of each shoe size at each store level, the data soon becomes sparse and the pattern is hard to find. However, to refill stock, we need to estimate this granularity. To do this, alternative solutions might require estimating a ratio between different shoe sizes and using this ratio to calculate fine-grained results.

We often need to balance the business requirement and the data pattern that can be learned and used for forecasting. To provide a quantitative qualification of the data patterns, we propose using data forecastability.

Data forecastability and data pattern classification

One of the key insights that we can collect from the target dataset is its ability to produce quality forecasts. This can be analyzed at the very early phase of the ML project. Forecast shines when data shows seasonality, trends, and cyclical patterns.

To determine forecastability, there are two major coefficients: variability in demand timing and variability in demand quantity. Variability in demand timing means the interval between two instances of demand, and it measures the demand regularity in time. Variability in demand quantity means variation in quantities. The following figure illustrates some different patterns. Forecast accuracy strongly depends on product forecastability. For more information, refer to Demand classification: why forecastability matters.

It’s worth noting that this forecastability analysis is for each fine-grained item (for example, SKU-Store-Color-Size). It’s quite common that in a demand forecasting production system, different items follow different patterns. Therefore, it’s important to separate the items following different data patterns. One typical example is fast-moving and slow-moving items; another example would be dense and sparse data. In addition, a fine-grained item has more chances of yielding a lumpy pattern. For example, in a clothing store, the sales of one popular item can be quite smooth daily, but if we further separate the sales of the item for each color and size, it soon becomes sparse. Therefore, reducing the granularity from SKU-Store-Color-Size to SKU-Store can change the data pattern from lumpy to smooth, and vice versa.

Moreover, not all items contribute to sales equally. We have observed that item contribution often follows the Pareto distribution, in which top items contribute most of the sales. The sales of these top items are often smooth. Items with a lower sales record are often lumpy and erratic, and therefore hard to estimate. Adding these items might actually decrease the accuracy of top sales items. Based on these observations, we can separate the items into different groups, train the Forecast model on top sales items, and handle the lower sales items as corner cases.

Data enrichment and additional dataset selection

When we want to use additional datasets to improve the performance of forecast results, we can rely on time series datasets and metadata datasets. In the retail domain, based on intuition and domain knowledge, features such as inventory, price, promotion, and winter or summer seasons could be imported as the related time series. The simplest way to identify usefulness of features is via feature importance. In Forecast, this is done by explainability analysis. Forecast Predictor Explainability helps us better understand how the attributes in the datasets impact forecasts for the target. Forecast uses a metric called impact scores to quantify the relative impact of each attribute and determine whether they increase or decrease forecast values. If one or more attributes have an impact score of zero, then these attributes have no significant impact on forecast values. This way, we can quickly remove the features that have less impact and add the potential ones iteratively. It’s important to note that impact scores measure the relative impact of attributes, which are normalized together with impact scores of all other attributes.

Like all ML projects, improving accuracy with additional features requires iterative experiments. You need to experiment with multiple combinations of datasets, while observing the impact of incremental changes on model accuracy. You can try to run multiple Forecast experiments via the Forecast console or with Python notebooks with Forecast APIs. In addition, you can onboard with AWS CloudFormation, which deploys AWS provided ready-made solutions for common use cases (for example, the Improving Forecast Accuracy with Machine Learning solution). Forecast automatically separates the dataset and produces accuracy metrics to evaluate predictors. For more information, see Evaluating Predictor Accuracy. This helps data scientists iterate faster to achieve the best performing model.

Advanced improvement and handling corner cases

We mentioned that forecast algorithms can learn seasonality, trends, and cyclical features from data. For items with these characteristics, and the appropriate data density and volume, we can use Forecast to generate estimations. However, when facing lumpy data patterns, especially when the data volume is small, we might need to handle them differently, such as with empirical estimation based on a ruleset.

For dense SKUs, we further improve Forecast accuracy by training the models with similarly behaving subsets of the time series dataset. The subset separation strategies that we used are business logic, product type, data density, and patterns learned by the algorithm. After the subsets are generated, we can train multiple Forecast models for the different subsets. For one such example, refer to Cluster time series data for use with Amazon Forecast.

Toward production: Updating the dataset, monitoring, and retraining

Let’s explore an example architecture with Forecast, as shown in the following diagram. Each time an end-user consolidates a new dataset on Amazon Simple Storage Service (Amazon S3), it triggers AWS Step Functions to orchestrate different components, including creating the dataset import job, creating an auto predictor, and generating forecasts. After the forecast results are generated, the Create Forecast Export step exports them to Amazon S3 for downstream consumers. For more information about how to provision this automated pipeline, refer to Automating with AWS CloudFormation. It uses a CloudFormation stack to automatically deploy datasets to an S3 bucket and trigger a Forecast pipeline. You can use the same automation stack to generate forecasts with your own datasets.

There are two ways to incorporate recent trends into the forecasting system: updating data or retraining the predictor.

To generate the forecast with updated data reflecting recent trends, you need to upload the updated input data file to an S3 bucket (the updated input data should still contain all of your existing data). Forecast doesn’t automatically retrain a predictor when you import an updated dataset. You can generate forecasts as you usually do. Forecast predicts the forecast horizon starting from the last day in the updated input data. Therefore, recent trends are incorporated into any new inferences produced by Forecast.

However, if you want your predictor to be trained off of the new data, you must create a new predictor. You might need to consider retraining the model when data patterns (seasonality, trends, or cycles) change. As mentioned in Continuously monitor predictor accuracy with Amazon Forecast, the performance of a predictor will fluctuate over time, due to factors such as changes in the economic environment or in consumer behavior. Therefore, the predictor may need to be retrained, or a new predictor may need to be created to ensure highly accurate predictions continue to be made. With the help of predictor monitoring, Forecast can track the quality of your predictors, allowing you to reduce operational efforts, while helping you make more informed decisions about keeping, retraining, or rebuilding your predictors.

Conclusion

Amazon Forecast is a time series forecasting service based on ML and built for business metrics analysis. We can integrate demand forecasting prediction with high accuracy by combining historical sales and other relevant information such as inventory, promotions, or season. Within 8 weeks, we helped one of our retail customers achieve accurate demand forecasting—10% improvement in comparison with the manual forecast. This leads to a direct savings of 16 labor hours monthly and estimated sales increase by up to 11.8%.

This post shared common practices for bringing your forecasting project from proof of concept to production. Get started now with Amazon Forecast to achieve highly accurate forecasts for your business.


About the Authors

Yanwei Cui, PhD, is a Machine Learning Specialist Solutions Architect at AWS. He started machine learning research at IRISA (Research Institute of Computer Science and Random Systems), and has several years of experience building artificial intelligence powered industrial applications in computer vision, natural language processing and online user behavior prediction. At AWS, he shares the domain expertise and helps customers to unlock business potentials, and to drive actionable outcomes with machine learning at scale. Outside of work, he enjoys reading and traveling.

Gordon Wang is a Senior Data Scientist on the Professional Services team at Amazon Web Services. He supports customers in many industries, including media, manufacturing, energy, retail, and healthcare. He is passionate about computer vision, deep learning, and MLOps. In his spare time, he loves running and hiking.

Read More