Analyze rodent infestation using Amazon SageMaker geospatial capabilities

Analyze rodent infestation using Amazon SageMaker geospatial capabilities

Rodents such as rats and mice are associated with a number of health risks and are known to spread more than 35 diseases. Identifying regions of high rodent activity can help local authorities and pest control organizations plan for interventions effectively and exterminate the rodents.

In this post, we show how to monitor and visualize a rodent population using Amazon SageMaker geospatial capabilities. We then visualize rodent infestation effects on vegetation and bodies of water. Finally, we correlate and visualize the number of monkey pox cases reported with rodent sightings in a region. Amazon SageMaker makes it easier for data scientists and machine learning (ML) engineers to build, train, and deploy models using geospatial data. The tool makes it easier to access geospatial data sources, run purpose-built processing operations, apply pre-trained ML models, and use built-in visualization tools faster and at scale.

Notebook

First, we use an Amazon SageMaker Studio notebook with a geospatial image by following the steps outlined in Getting Started with Amazon SageMaker geospatial capabilities.

Data access

The geospatial image comes preinstalled with SageMaker geospatial capabilities that make it easier to enrich data for geospatial analysis and ML. For our post, we use satellite images from Sentinel-2 and the rodent activity and monkeypox datasets from open-source NYC open data.

First, we use the rodent activity and extract the latitude and longitude of rodent sightings and inspections. Then we enrich this location information with human-readable street addresses. We create a vector enrichment job (VEJ) in the SageMaker Studio notebook to run a reverse geocoding operation so that you can convert geographic coordinates (latitude, longitude) to human-readable addresses, powered by Amazon Location Service. We create the VEJ as follows:

import boto3
import botocore
import sagemaker
import sagemaker_geospatial_map

region = boto3.Session().region_name
session = botocore.session.get_session()
execution_role = sagemaker.get_execution_role()

sg_client= session.create_client(
    service_name='sagemaker-geospatial',
    region_name=region
)
response = sg_client.start_vector_enrichment_job(
    ExecutionRoleArn=execution_role,
    InputConfig={
        'DataSourceConfig': {
            'S3Data': {
                'S3Uri': 's3://<bucket>/sample/rodent.csv'
            }
        },
        'DocumentType': 'CSV'
    },
    JobConfig={
        "ReverseGeocodingConfig": { 
         "XAttributeName": "longitude",
         "YAttributeName": "latitude"
      }
    },
    Name='vej-reversegeo',
)

my_vej_arn = response['Arn']

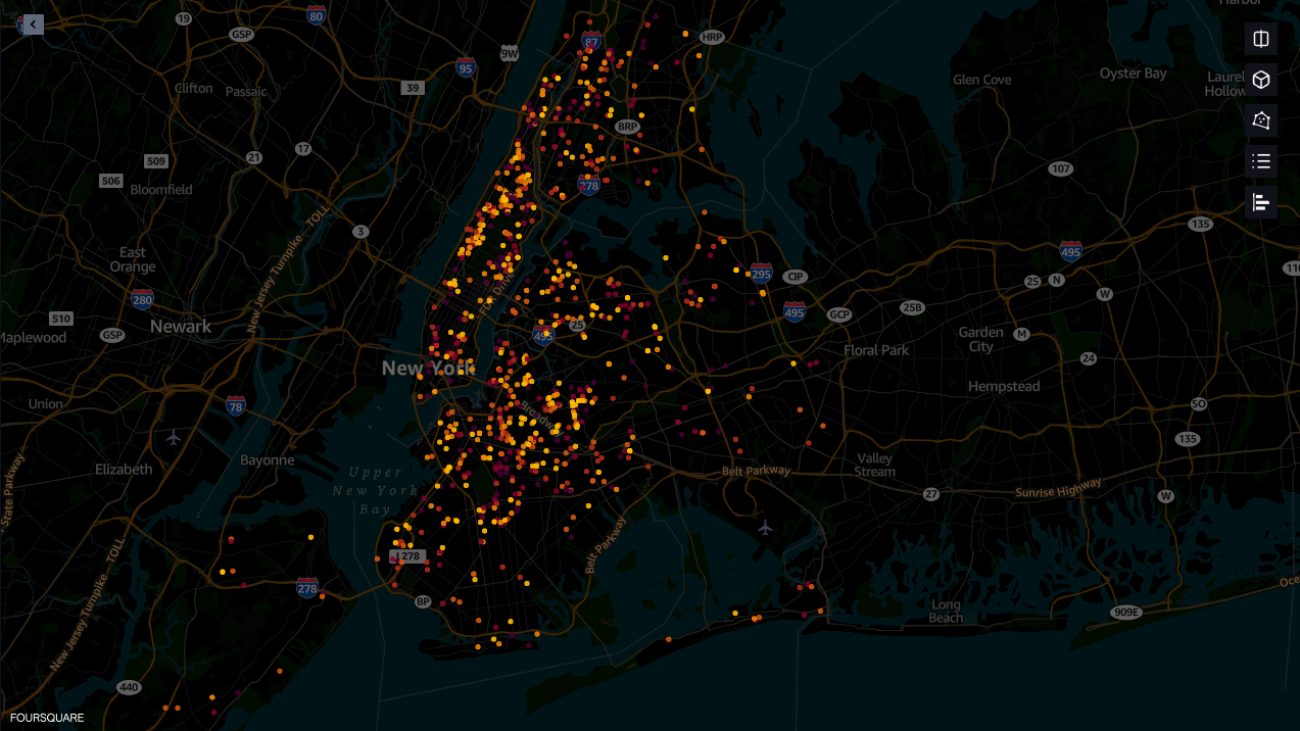
Visualize rodent activity in a region

Now we can use SageMaker geospatial capabilities to visualize rodent sightings. After the VEJ is complete, we export the output of the job to an Amazon S3 bucket.

sg_client.export_vector_enrichment_job(
    Arn=my_vej_arn,
    ExecutionRoleArn=execution_role,
    OutputConfig={
        'S3Data': {
            'S3Uri': 's3://<bucket>/reversegeo/'
        }
    }
)

When the export is complete, you will see the output CSV file in your Amazon Simple Storage Service (Amazon S3) bucket, which consists of your input data (longitude and latitude coordinates) along with additional columns: address number, country, label, municipality, neighborhood, postal code, and region of that location appended at the end.

From the output file generated by VEJ, we can use SageMaker geospatial capabilities to overlay the output on a base map and provide layered visualization to make collaboration easier. SageMaker geospatial capabilities provide built-in visualization tooling powered by Foursquare Studio, which natively works from within a SageMaker notebook via the SageMaker geospatial Map SDK. Below, we can visualize the rodent sightings and also get the human readable addresses for each of the data points. The address information of each of the rodent sightings data points can be useful for rodent inspection and treatment purposes.

Analyze the effects of rodent infestation on vegetation and bodies of water

To analyze the effects of rodent infestation on vegetation and bodies of water, we need to classify each location as vegetation, water, and bare ground. Let’s look at how we can use these geospatial capabilities to perform this analysis.

The new geospatial capabilities in SageMaker offer easier access to geospatial data such as Sentinel-2 and Landsat 8. Built-in geospatial dataset access saves weeks of effort otherwise lost to collecting and processing data from various data providers and vendors. Also, these geospatial capabilities offer a pre-trained Land Use Land Cover (LULC) segmentation model to identify the physical material, such as vegetation, water, and bare ground, at the earth surface.

We use this LULC ML model to analyze the effects of rodent population on vegetation and bodies of water.

In the following code snippet, we first define the area of interest coordinates (aoi_coords) of New York City. Then we create an Earth Observation Job (EOJ) and select the LULC operation. SageMaker downloads and preprocesses the satellite image data for the EOJ. Next, SageMaker automatically runs model inference for the EOJ. The runtime of the EOJ will vary from several minutes to hours depending on the number of images processed. You can monitor the status of EOJs using the get_earth_observation_job function, and visualize the input and output of the EOJ in the map.

aoi_coords = [
    [
            [
              -74.13513011934334,
              40.87856296920188
            ],
            [
              -74.13513011934334,
              40.565792636343616
            ],
            [
              -73.8247144462764,
              40.565792636343616
            ],
            [
              -73.8247144462764,
              40.87856296920188
            ],
            [
              -74.13513011934334,
              40.87856296920188
            ]
    ]
]

eoj_input_config = {
    "RasterDataCollectionQuery": {
        "RasterDataCollectionArn": "arn:aws:sagemaker-geospatial:us-west-2:378778860802:raster-data-collection/public/nmqj48dcu3g7ayw8",
        "AreaOfInterest": {
            "AreaOfInterestGeometry": {
                "PolygonGeometry": {
                    "Coordinates": aoi_coords
                }
            }
        },
        "TimeRangeFilter": {
            "StartTime": "2023-01-01T00:00:00Z",
            "EndTime": "2023-02-28T23:59:59Z",
        },
        "PropertyFilters": {
            "Properties": [{"Property": {"EoCloudCover": {"LowerBound": 0, "UpperBound": 2.0}}}],
            "LogicalOperator": "AND",
        },
    }
}
eoj_config = {
  "LandCoverSegmentationConfig": {}
}

response = geospatial_client.start_earth_observation_job(
    Name="eoj-rodent-infestation-lulc-example",
    InputConfig=eoj_input_config,
    JobConfig=eoj_config,
    ExecutionRoleArn=execution_role,
)
eoj_arn = response["Arn"]
eoj_arn

Map = sagemaker_geospatial_map.create_map()
Map.set_sagemaker_geospatial_client(sg_client)

Map.render()

time_range_filter = {
    "start_date": "2023-01-01T00:00:00Z",
    "end_date": "2023-02-28T23:59:59Z",
}


config = {"preset": "singleBand", "band_name": "mask"}
output_layer = Map.visualize_eoj_output(
    Arn=eoj_arn, config=config, time_range_filter=time_range_filter
)

To visualize the rodent population with respect to vegetation, we overlay the rodent population and sighting data on the land cover segmentation model predictions. This visualization can help us locate the population of rodents and analyze it on vegetation and bodies of water.

Visualize monkeypox cases and corelating with rodent data

To visualize the relation between the monkeypox cases and rodent sightings, we add the monkeypox dataset and the geoJSON file for New York City borough boundaries. See the following code:

nybb = pd.read_csv("./nybb.csv")
monkeypox = pd.read_csv("./monkeypox.csv")
dataset = Map.add_dataset({
    "data": nybb
}, auto_create_layers=False)
dataset = Map.add_dataset({
    "data": monkeypox
}, auto_create_layers=False)

Within a SageMaker Studio notebook, we can use the visualization tool powered by Foursquare to add layers in the map and add charts. Here, we added the monkeypox data as a chart to show the number of monkeypox cases for each of the boroughs. To see the correlation between monkeypox cases and rodent sightings, we have added the borough boundaries as a polygon layer and added the heatmap layer that represents rodent activity. The borough boundary layer is colored to match the monkeypox data chart. As we can see, the borough of Manhattan exhibits a high concentration of rodent sightings and records the highest number of monkeypox cases, followed by Brooklyn.

This is supported by a simple statistical analysis of calculating the correlation between the concentration of rodent sightings and monkeypox cases in each borough. The calculation produced an r value of 0.714, which implies a positive correlation.

r = np.corrcoef(borough_stats['Concentration (sightings per square km)'], borough_stats['Monkeypox Cases'])

Conclusion

In this post, we demonstrated how you can use SageMaker geospatial capabilities to get detailed addresses of rodent sightings and visualize the rodent effects on vegetation and bodies of water. This can help local authorities and pest control organizations plan for interventions effectively and exterminate rodents. We also correlated the rodent sightings to monkeypox cases in the area with the built-in visualization tool. By utilizing vector enrichment and EOJs along with the built-in visualization tools, SageMaker geospatial capabilities eliminate the challenges of handling large-scale geospatial datasets, model training, and inference, and provide the ability to rapidly explore predictions and geospatial data on an interactive map using 3D accelerated graphics and built-in visualization tools.

You can get started with SageMaker geospatial capabilities in two ways:

To learn more, visit Amazon SageMaker geospatial capabilities and Getting Started with Amazon SageMaker geospatial capabilitites. Also, visit our GitHub repo, which has several example notebooks on SageMaker geospatial capabilities.


About the authors

Bunny Kaushik is a Solutions Architect at AWS. He is passionate about building AI/ML solutions and helping customers innovate on the AWS platform. Outside of work, he enjoys hiking, rock climbing, and swimming.

Clarisse Vigal is a Sr. Technical Account Manager at AWS, focused on helping customers accelerate their cloud adoption journey. Outside of work, Clarisse enjoys traveling, hiking, and reading sci-fi thrillers.

Veda Raman is a Senior Specialist Solutions Architect for machine learning based in Maryland. Veda works with customers to help them architect efficient, secure and scalable machine learning applications. Veda is interested in helping customers leverage serverless technologies for Machine learning.

Read More

Microsoft at ICML 2023: Discoveries and advancements in machine learning

Microsoft at ICML 2023: Discoveries and advancements in machine learning

Machine learning’s rapid emergence and pervasive impact has revolutionized industries and societies across the globe. Its ability to extract insights, recognize patterns, and make intelligent predictions from vast amounts of data has paved the way for a new era of progress. From traffic and weather prediction to speech pattern recognition and advanced medical diagnostics, machine learning has been shattering the boundaries of possibility, inviting us to explore new frontiers of innovation.

The International Conference on Machine Learning (ICML 2023) serves as a global platform where researchers, academics, and industry professionals gather to share their pioneering work and advancements in the field of machine learning. As a supporter of machine learning research, Microsoft takes an active role in ICML, not only as a sponsor but also as a significant research contributor.

The breadth of contributions from Microsoft researchers and their collaborators at ICML reflects the various and diverse possibilities for applying machine learning.

SPOTLIGHT: AI focus area

AI and Microsoft Research

Learn more about the breadth of AI research at Microsoft

Here are some of the highlights:

Oral sessions

BEATs: Audio Pre-Training with Acoustic Tokenizers

Sanyuan Chen, Yu Wu, Chengyi Wang, Shujie Liu, Daniel Tompkins, Zhuo Chen, and Furu Wei explore the growth of self-supervised learning (SSL) across language, vision, speech, and audio domains. They propose an iterative framework, BEATs, which combines acoustic tokenizers and audio SSL models and promotes semantic-rich discrete label prediction, facilitating the abstraction of high-level audio semantics. Experimental results demonstrate BEATs’ effectiveness, achieving state-of-the-art performance on various audio classification benchmarks, including AudioSet-2M and ESC-50.

Representation Learning with Multi-Step Inverse Kinematics: An Efficient and Optimal Approach to Rich-Observation RL

Zakaria Mhammedi, Dylan Foster, and Alexander Rakhlin introduce MusIK, a computationally efficient algorithm for sample-efficient reinforcement learning with complex observations. MusIK overcomes limitations of existing methods by achieving rate-optimal sample complexity and minimal statistical assumptions. It combines systematic exploration with multi-step inverse kinematics to predict the learner’s future actions based on current observations.

Using Large Language Models to Simulate Multiple Humans and Replicate Human Subject Studies 

Gati Aher, Rosa Arriaga, and Adam Tauman Kalai present the Turing Experiment (TE), a novel approach for evaluating how well language models can simulate different aspects of human behavior. Unlike the traditional Turing Test, a TE requires representative samples of participants from human subject research. The methodology enables the replication of well-established findings in economic, psycholinguistic, and social psychology experiments, such as the Ultimatum Game, Garden Path Sentences, Milgram Shock Experiment, and Wisdom of Crowds. Results demonstrate successful replication in the first three TEs, while uncovering a “hyper-accuracy distortion” in some language models during the last TE.

Other paper highlights

Bayesian Estimation of Differential Privacy

Differentially private stochastic gradient descent (SGD) algorithms provide formal privacy guarantees for training ML models, offering better protection against practical attacks. Researchers estimate protection levels using ε confidence intervals from membership inference attacks, but obtaining actionable intervals requires training an impractically large number of models. Santiago Zanella-Béguelin, Lukas Wutschitz, Shruti Tople, Ahmed Salem, Victor Ruehle, Andrew Paverd, Mohammad Naseri, Boris Köpf, and Daniel Jones propose a novel, more efficient Bayesian approach that brings privacy estimates within reach of practitioners. It reduces sample size by computing a posterior for ε from the joint posterior of the false positive and false negative rates of membership inference attacks. This approach also implements an end-to-end system for privacy estimation that integrates our approach and state-of-the-art membership inference attacks and evaluates it on text and vision classification tasks.

Magneto: A Foundation Transformer

Model architectures across language, vision, speech, and multimodal are converging. Despite being called “transformers,” these areas use different implementations for better performance. Hongyu Wang, Shuming Ma, Shaohan Huang, Li Dong, Wenhui Wang, Zhiliang Peng, Yu Wu, Payal Bajaj, Saksham Singhal, Alon Benhaim, Barun Patra, Zhun Liu, Vishrav Chaudhary, Xia Song, and Furu Wei call for developing a foundation transformer for true general-purpose modeling to serve as a go-to architecture for various tasks and modalities with guaranteed training stability. This work introduces Magneto, a transformer variant, to meet that goal. The authors propose Sub-LayerNorm for good expressivity and the initialization strategy theoretically derived from DeepNet for stable scaling up. Extensive experiments demonstrate its superior performance and better stability than de facto transformer variants designed for various applications, including language modeling, machine translation, vision pretraining, speech recognition, and multimodal pretraining.

NeuralStagger: Accelerating Physics-Constrained Neural PDE Solver with Spatial-Temporal Decomposition

Neural networks accelerate partial differential equation (PDE) solutions but need physics constraints for generalization and to reduce reliance on data. Ensuring accuracy and stability requires resolving smallest scaled physics, increasing computational costs due to large inputs, outputs, and networks. Xinquan Huang, Wenlei Shi, Qi Meng, Yue Wang, Xiaotian Gao, Jia Zhang, and Tie-Yan Liu propose an acceleration methodology, NeuralStagger, which spatially and temporally decomposes the original learning tasks into several coarser-resolution subtasks. They define a coarse-resolution neural solver for each subtask, requiring fewer computational resources, and jointly train them with a physics-constrained loss. The solution is achieved quickly thanks to perfect parallelism, while trained solvers provide the flexibility to simulate at various resolutions.  

Streaming Active Learning with Deep Neural Networks

Active learning is perhaps most naturally posed as an online learning problem. However, prior active learning approaches with deep neural networks assume offline access to the entire dataset ahead of time. Akanksha Saran, Safoora Yousefi, Akshay Krishnamurthy, John Langford, and Jordan Ash propose VeSSAL, a new algorithm for batch active learning with deep neural networks in streaming settings, which samples groups of points to query for labels at the moment they are encountered. The approach trades off between the uncertainty and diversity of queried samples to match a desired query rate without requiring any hand-tuned hyperparameters. This paper expands the applicability of deep neural networks to realistic active learning scenarios, such as applications relevant to HCI and large fractured datasets.

For the complete list of accepted publications by Microsoft researchers, please see the publications list on Microsoft at ICML 2023.

The post Microsoft at ICML 2023: Discoveries and advancements in machine learning appeared first on Microsoft Research.

Read More