Program supports computational research with goal of creating trustworthy AI systems that can address some of society’s grand challenges.Read More
Accelerating the deployment of PPE detection solution to comply with safety guidelines
Personal protective equipment (PPE) such as face covers (face mask), hand covers (gloves), and head covers (helmet) are essential for many businesses. For example, helmets are required at construction sites for employee safety, and gloves and face masks are required in the restaurant industry for hygienic operations. In the current COVID-19 pandemic environment, PPE compliance has also become important as face masks are mandated by many businesses. In this post, we demonstrate how you can deploy a solution to automatically check face mask compliance on your business premises and extract actionable insights using the Amazon Rekognition DetectProtectiveEquipment API.
This solution has been developed by AWS Professional Services to help customers that rely heavily on on-site presence of customers or employees to support their safety. Our team built the following architecture to automate PPE detection by consuming the customer’s camera video feeds. This solution enabled a large sports entertainment customer to take timely action to ensure people who are on the premises comply with face mask requirements. The architecture is designed to take raw camera feeds for model inference and pass the model output to an analytic dashboard for further analysis. As of this writing, it’s successfully deployed at a customer site with multiple production cameras.
Let’s walk through the solution in detail and discuss the scalability and security of the application.
Solution overview
The PPE detection solution architecture is an end-to-end pipeline consisting of three components:
- Video ingestion pipeline – Ensures you receive on-demand video feeds from camera and preprocesses the feeds to break them into frames. Finally, it saves the frames in an Amazon Simple Storage Service (Amazon S3) bucket for ML model inference.
- Machine learning inference pipeline – Demonstrates how the machine learning (ML) model processes the frames as soon as they arrive at the S3 bucket. The model outputs are stored back in the S3 bucket for further visualization.
- Model interaction pipeline – Used for visualizing the model outputs. The model outputs feed into Amazon QuickSight, which you can use to analyze the data based on the camera details, day, and time of day.
The following diagram illustrates this architecture (click to expand).

We now discuss each section in detail.
Video ingestion pipeline
The following diagram shows the architecture of the video ingestion pipeline.
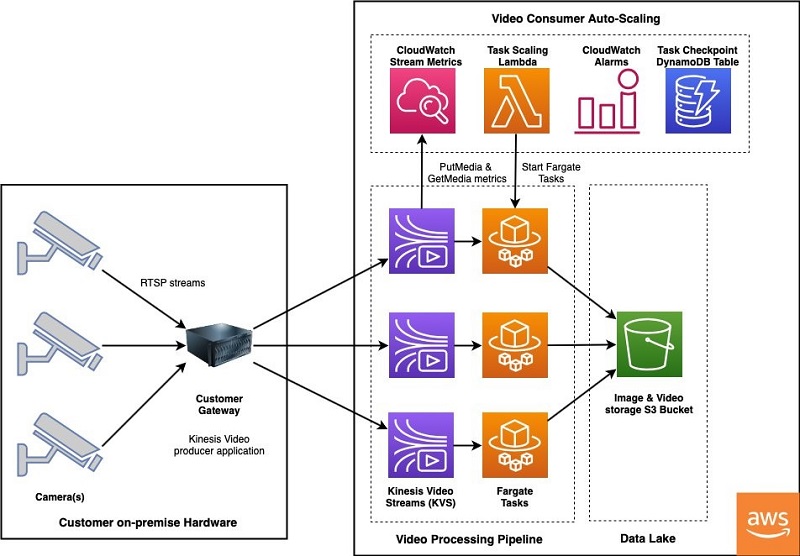
The video ingestion pipeline begins at a gateway located on premises at the customer location. The gateway is a Linux machine with access to RTSP streams on the cameras. Installed on the gateway is the open-source GStreamer framework and AWS-provided Amazon Kinesis Video Streams GStreamer plugin. For additional information on setting up a gateway with the tools needed to stream video to AWS, see Example: Kinesis Video Streams Producer SDK GStreamer Plugin.
The gateway continuously publishes live video to a Kinesis video stream, which acts like a buffer while AWS Fargate tasks read video fragments for further processing. To accommodate customer-specific requirements around the location of cameras that periodically come online and the time of day when streaming processing is needed, we developed a cost-effective and low-operational overhead consumer pipeline with automatic scaling. This avoids manually starting and stopping processing tasks when a camera comes online or goes dark.
Consuming from Kinesis Video Streams is accomplished via an AWS Fargate task running on Amazon Elastic Container Service (Amazon ECS). Fargate is a serverless compute engine that removes the need to provision and manage servers, and you pay for compute resources only when necessary. Processing periodic camera streams is an ideal use case for a Fargate task, which was developed to automatically end when no video data is available on a stream. Additionally, we built the framework to automatically start tasks using a combination of Amazon CloudWatch alarms, AWS Lambda, and checkpointing tables in Amazon DynamoDB. This ensures that the processing always continues from the video segment where the streaming data was paused.
The Fargate task consumes from the Kinesis Video Streams GetMedia API to obtain real-time, low-latency access to individual video fragments and combines them into video clips of 30 seconds or more. The video clips are then converted from MKV to an MP4 container and resampled to 1 frame per second (FPS) to extract an image from each second of video. Finally, the processed video clips and images are copied into an S3 bucket to feed the ML inference pipeline.
ML inference pipeline
The following diagram illustrates the architecture of the ML pipeline.
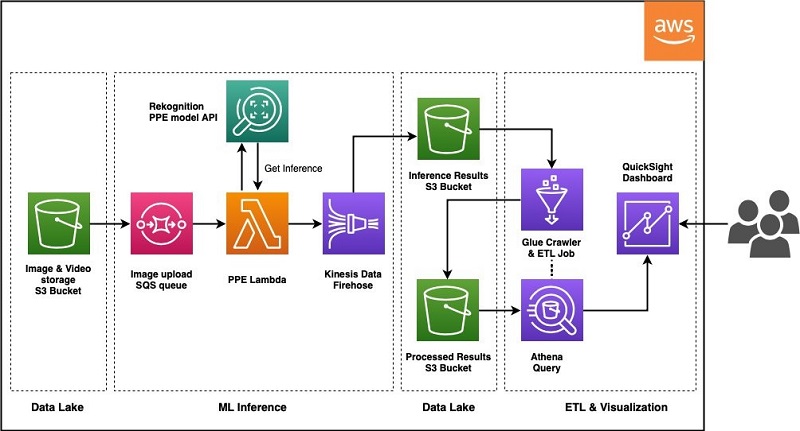
The ML pipeline is architected to be automatically triggered when new data lands in the S3 bucket, and it utilizes a new deep learning-based computer vision model tailored for PPE detection in Amazon Rekognition. As soon as the S3 bucket receives a new video or image object, it generates and delivers an event notification to an Amazon Simple Queue Service (Amazon SQS) queue, where each queue item triggers a Lambda invocation. Each Lambda invocation calls the Amazon Rekognition DetectProtectiveEquipment API to generate model inference and delivers the result back to Amazon S3 through Amazon Kinesis Data Firehose.
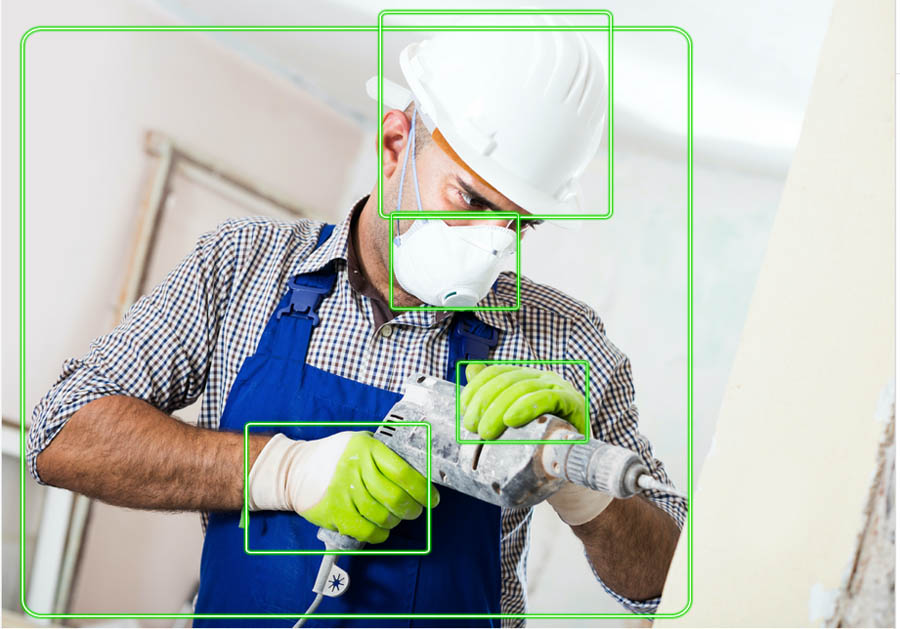
The Amazon Rekognition PPE API detects several types of equipment, including hand covers (gloves), face covers (face masks), and head covers (helmets). For our use case, the customer was focused on detecting face masks. The computer vision model in Amazon Rekognition first detects if people are in a given image, and then detects face masks. Based on the location of the face mask on a face, if a person is wearing a face mask not covering their nose or mouth, the service will assign a noncompliant label. When the model can’t detect a face due to image quality, such as when the region of interest (face) is too small, it labels that region as unknown. For each image, the Amazon Rekognition API returns the number of compliant, noncompliant, and unknowns, which are used to calculate meaningful metrics for end users. The following table lists the metrics.
| Metrics | Description |
| Face Cover Non-Compliant | Average number of detected faces not wearing masks appropriately across time |
| Face Cover Non-Compliant % | Average number of detected faces not wearing masks divided by average number of detected faces |
| Detected Face Rate | Average number of detected faces divided by average number of detected people (provides context to the effectiveness of the cameras for this key metric) |
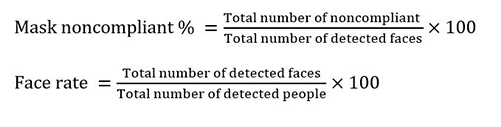
We use the following formulas to calculate these metrics:
- Total number of noncompliant = Total number of detected faces not wearing face cover in the frame
- Total number of compliant = Total number of detected faces wearing face cover in the frame
- Total number of unknowns = Total number of people for which a face cover or face can’t be detected in the frame
- Total number of detected faces = Total number of noncompliant + Total number of compliant
- Total number of detected people = Total number of unknowns + Total number of detected faces
- Mask noncompliant per frame = Total number of noncompliant in the frame
Preprocessing for crowded images and images of very small size
Amazon Rekognition PPE detection supports up to 15 people per image. To support images where more than 15 people are present, we fragment the image into smaller tiles and process them via Amazon Rekognition. Also, PPE detection requires a minimum face size of 40×40 pixels for an image with 1920×1080 pixels. If the image is too small, we interpolate it before performing inference. For more information about size limits, see Guidelines and Quotas in Amazon Rekognition.
Model interaction pipeline
Finally, we can visualize the calculated metrics in QuickSight. QuickSight is a cloud-native and serverless business intelligence tool that enables straightforward creation of interactive visualizations. For more information about setting up a dashboard, see Getting Started with Data Analysis in Amazon QuickSight.
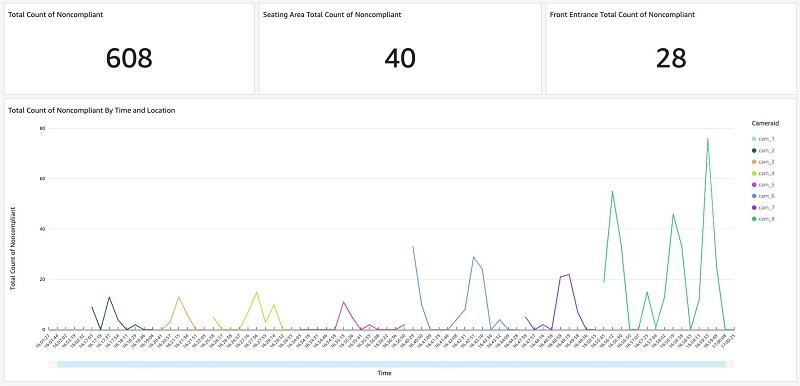
As shown in the following dashboard, end users can configure and display the top priority statistics at the top of the dashboard, such as total count of noncompliant, seating area total count of noncompliant, and front entrance total count of noncompliant. In addition, end users can interact with the line chart to dive deep into the mask-wearing noncompliant patterns. The bottom chart shows such statistics of the eight cameras over time.
You can create additional visualizations according to your business needs. For more information, see Working with Visual Types in Amazon QuickSight.
Code template
This section contains the code template to help you get started in deploying this solution into your AWS account. This is an AWS Serverless Application Model (AWS SAM) project and requires you to have the AWS Command Line Interface (AWS CLI) and AWS SAM CLI set up in your system.
To build and deploy the AWS CloudFormation stack, complete the following steps:
- Install the AWS CLI and configure your AWS CLI credentials.
- Install the AWS SAM CLI using these instructions.
- Download the Ppe-detection-ml-pipeline.zip
- Unzip the contents of the .zip file and navigate to the root of the project.
- Build the project – This will package the Lambda functions. Note: Python 3.8 and pip are required for this deployment.
sam build
- Deploy the CloudFormation stack in your AWS account
sam deploy --guided
Choose an appropriate AWS region to deploy the stack. Use the defaults for all other prompts.
Note: Use sam deploy for subsequent stack updates.
Note: The Rekognition PPE API needs the following SDK versions: boto3 >= 1.15.17 and botocore >=1.18.17. Currently, the AWS Lambda Python 3.8 runtime does not support the preceding versions (see documentation). A layer has been added to the Lambda function in template to support the required SDK versions. We will update this post and the code template after the updated SDK is natively supported by the Python 3.8 runtime.
We use Amazon S3 as a data lake to store the images coming out of the video ingestion pipeline after it splits the original camera feeds into 1 FPS images. The S3 data lake bucket folder structure, which organizes the collected image and camera metadata along with the model responses.
After deploying the stack, create the input folder inside the S3 bucket. The input prefix can contain multiple folders, which helps in organizing the results by camera source. To test the pipeline, upload a .jpg containing people and faces to input/[camera_id]/ folder in the S3 bucket. The camera_id can be any arbitrary name. The output and error prefixes are created automatically when the PPE detection job is triggered. The output prefix contains model inference outputs. The error prefix contains records of jobs that failed to run. Make sure you have a similar folder structure in the deployed S3 bucket for the code to work correctly.
S3 DataLake Bucket
-- input/
---- [camera_id]/
-- output/
---- ppe/
------ [YYYY]/[MM]/[DD]/
-- error/
---- ppe/
For example, this sample image is uploaded to the S3 Bucket location: input/CAMERA01/. After Amazon Kinesis Data Firehose delivers the event to Amazon S3, the output/ prefix will contain a file with a JSON record indicating the PPE compliant status of each individual.
{
  "CameraID": "CAMERA01",
  "Bucket": "ppe-detection-blog-post-datalakes3bucket-abc123abc123",
  "Key": "input/CAMERA01/ppe_sample_image.jpg",
  "RekResult": "{"0": "compliant", "1": "compliant", "2": "compliant", "3": "compliant"}",
  "FaceCoverNonCompliant": 0,
  "FaceCoverNonCompliantPercentage": 0,
  "detectedFaceRate": 100
}
The provided AWS SAM project creates the resources, roles, and necessary configuration of the pipeline. Note that the IAM roles deployed are very permissive and should be restricted in production environments.
Conclusion
In this post, we showed how we take a live camera feed as input to build a video ingestion pipeline and prepare the data for ML inference. Next we demonstrated a scalable solution to perform PPE detection using the Amazon Rekognition API. Then we discussed how to visualize the model output results on a QuickSight dashboard for building meaningful dashboards for your safety compliance guidelines. Finally, we provided an AWS SAM project of the ML pipeline if you want to deploy this in your own AWS account.
We also demonstrated how the AWS Professional Services team can help customers with the implementation and deployment of an end-to-end architecture for detecting PPE at scale using Amazon Rekognition’s new PPE detection feature. For additional information, see Automatically detecting personal protective equipment on persons in images using Amazon Rekognition to learn more about the new PPE detection API, insight into model outputs, and different ways to deploy a PPE solution for your own camera and networking requirements.
AWS Professional Services can help customize and implement the PPE detection solution based on your organization’s requirements. To learn more about how we can help, please connect with us with the help of your account manager.
About the Authors
 Pranati Sahu is a Data Scientist at AWS Professional Services and Amazon ML Solutions Lab team. She has an MS in Operations Research from Arizona State University, Tempe and has worked on machine learning problems across industries including social media, consumer hardware, and retail. In her current role, she is working with customers to solve some of the industry’s complex machine learning use cases on AWS.

Surya Dulla is an Associate Cloud Developer at AWS Professional Services. She has an MS in Computer Science from Towson University, Maryland. She has experience in developing full stack applications, microservices in health care and financial industry. In her current role, she focuses on delivering best operational solutions for enterprises using AWS suite of developer tools.

Rohit Rangnekar is a Principal IoT Architect with AWS Professional Services based in the San Francisco Bay Area. He has an MS in Electrical Engineering from Virginia Tech and has architected and implemented data & analytics, AI/ML, and IoT platforms globally. Rohit has a background in software engineering and IoT edge solutions which he leverages to drive business outcomes in healthcare, space and telecom, semiconductors and energy verticals among others.

Taihua (Ray) Li is a data scientist with AWS Professional Services. He holds a M.S. in Predictive Analytics degree from DePaul University and has several years of experience building artificial intelligence powered applications for non-profit and enterprise organizations. At AWS, Ray helps customers to unlock business potentials and to drive actionable outcomes with machine learning. Outside of work, he enjoys fitness classes, biking, and traveling.

Han Man is a Data Scientist with AWS Professional Services. He has a PhD in engineering from Northwestern University and has several years of experience as a management consultant advising clients across many industries. Today he is passionately working with customers to develop and implement machine learning, deep learning, & AI solutions on AWS. He enjoys playing basketball in his spare time and taking his bulldog, Truffle, to the beach.

Jin Fei is a Senior Data Scientist with AWS Professional Services. He has a PhD in computer science in the area of computer vision and image analysis from University of Houston. He has worked as researchers and consultants in different industries including energy, manufacture, health science and finance. Other than providing machine learning and deep learning solutions to customers, his specialties also include IoT, software engineering and architectural design. He enjoys reading, photography, and swimming.

Kareem Williams is a data scientist with Amazon Research. He holds a M.S. in Data Science from Southern Methodist University and has several years of experience solving challenging business problems with ML for SMB and Enterprise organizations. Currently, Kareem is working on leveraging AI to build a more diverse and inclusive workspace at Amazon. In his spare time he enjoys soccer, hikes, and spending time with his family.
Training and deploying models using TensorFlow 2 with the Object Detection API on Amazon SageMaker
With the rapid growth of object detection techniques, several frameworks with packaged pre-trained models have been developed to provide users easy access to transfer learning. For example, GluonCV, Detectron2, and the TensorFlow Object Detection API are three popular computer vision frameworks with pre-trained models.
In this post, we use Amazon SageMaker to build, train, and deploy an EfficientDet model using the TensorFlow Object Detection API. It’s built on top of TensorFlow 2, which makes it easy to construct, train, and deploy object detection models.
It also provides the TensorFlow 2 Detection Model Zoo, which is a collection of pre-trained detection models we can use to accelerate our endeavor.
SageMaker is a fully managed service that provides developers and data scientists the ability to build, train, and deploy ML models quickly. SageMaker removes the heavy lifting from each step of the ML process to make it easier to develop high-quality models.
Walkthrough overview
This post demonstrates how to do the following:
- Label images using SageMaker Ground Truth
- Generate the dataset TFRecords and label map using SageMaker Processing
- Fine-tune an EfficientDet model with TensorFlow 2 on SageMaker
- Monitor your model training with TensorBoard and SageMaker Debugger
- Deploy your model on a SageMaker endpoint and visualize predictions
Prerequisites
If you want to try out each step yourself, make sure that you have the following in place:
- An AWS account
- An Amazon Simple Storage Service (Amazon S3) bucket
- A running SageMaker notebook instance
- The following GitHub repository cloned to the SageMaker notebook instance
The code repo contains the following folders with step-by-step walkthrough via notebooks.

Preparing the data
You can follow this section by running the cells in this notebook.
The dataset
In this post, we use a dataset from iNaturalist.org and train a model to recognize bees from RGB images.
This dataset contains 500 images of bees that have been uploaded by iNaturalist users for the purposes of recording the observation and identification. We only use images that users have licensed under a CC0 license.

We placed the dataset in Amazon S3 in a single .zip archive that you can download or by following instructions in the prepare_data.ipynb notebook in your instance.
The archive contains 500 .jpg image files, and an output.manifest file, which we explain later in the post. We also have 10 test images in the 3_predict/test_images notebook folder that we use to visualize our model predictions.
Labeling images using SageMaker Ground Truth
To train an ML model, you need large, high-quality, labeled datasets. Labeling thousands of images can become tedious and time-consuming. Thankfully, Ground Truth makes it easy to crowdsource this task. Ground Truth offers easy access to public and private human labelers for annotating datasets. It provides built-in workflows and interfaces for common labeling tasks, including drawing bounding boxes for object detection.
You can now move on to creating labeling jobs in Ground Truth. In this post, we don’t cover each step in creating a labeling job. It’s already covered in detail in the post Amazon SageMaker Ground Truth – Build Highly Accurate Datasets and Reduce Labeling Costs by up to 70%.
For our dataset, we follow the recommended workflow from the post Create high-quality instructions for Amazon SageMaker Ground Truth labeling jobs to create our labeling instructions for the labeler.
The following screenshot shows an example of a labeling job configuration in Ground Truth.

At the end of a labeling job, Ground Truth saves an output manifest file in Amazon S3, where each line corresponds to a single image and its labeled bounding boxes, alongside some metadata. See the following code:
{"source-ref":"s3://sagemaker-remars/datasets/na-bees/500/10006450.jpg","bees-500":{"annotations":[{"class_id":0,"width":95.39999999999998,"top":256.2,"height":86.80000000000001,"left":177}],"image_size":[{"width":500,"depth":3,"height":500}]},"bees-500-metadata":{"job-name":"labeling-job/bees-500","class-map":{"0":"bee"},"human-annotated":"yes","objects":[{"confidence":0.75}],"creation-date":"2019-05-16T00:15:58.914553","type":"groundtruth/object-detection"}}
{"source-ref":"s3://sagemaker-remars/datasets/na-bees/500/10022723.jpg","bees-500":{"annotations":[{"class_id":0,"width":93.8,"top":228.8,"height":135,"left":126.8}],"image_size":[{"width":375,"depth":3,"height":500}]},"bees-500-metadata":{"job-name":"labeling-job/bees-500","class-map":{"0":"bee"},"human-annotated":"yes","objects":[{"confidence":0.82}],"creation-date":"2019-05-16T00:41:33.384412","type":"groundtruth/object-detection"}}
{"source-ref":"s3://sagemaker-remars/datasets/na-bees/500/10059108.jpg","bees-500":{"annotations":[{"class_id":0,"width":157.39999999999998,"top":188.60000000000002,"height":131.2,"left":110.8}],"image_size":[{"width":375,"depth":3,"height":500}]},"bees-500-metadata":{"job-name":"labeling-job/bees-500","class-map":{"0":"bee"},"human-annotated":"yes","objects":[{"confidence":0.8}],"creation-date":"2019-05-16T00:57:28.636681","type":"groundtruth/object-detection"}}
{"source-ref":"s3://sagemaker-remars/datasets/na-bees/500/10250726.jpg","bees-500":{"annotations":[{"class_id":0,"width":77.20000000000002,"top":204,"height":94.4,"left":79.6}],"image_size":[{"width":375,"depth":3,"height":500}]},"bees-500-metadata":{"job-name":"labeling-job/bees-500","class-map":{"0":"bee"},"human-annotated":"yes","objects":[{"confidence":0.81}],"creation-date":"2019-05-16T00:34:21.300882","type":"groundtruth/object-detection"}}
For your convenience, we previously completed a labeling job called bees-500 and included the augmented manifest file output.manifest in the dataset.zip archive. In the provided notebook, we upload this dataset to the default S3 bucket before data preparation.
Generating TFRecords and the dataset label map
To use our dataset in the TensorFlow Object Detection API, we must first combine its images and labels and convert them into the TFRecord file format. The TFRecord format is a simple format for storing a sequence of binary records, which helps in data reading and processing efficiency. We also need to generate a label map, which defines the mapping between a class ID and a class name.
In the provided preprocessing notebook, we build a custom SageMaker Processing job with our own processing container. We first build a Docker container with the necessary TensorFlow image, Python libraries, and code to run those steps and push it to an Amazon Elastic Container Registry (Amazon ECR) repository. We then launch a processing job, which runs the pushed container and prepares the data for training. See the following code:
data_processor = Processor(role=role,
                           image_uri=container,
                           instance_count=1,
                           instance_type='ml.m5.xlarge',
                           volume_size_in_gb=30,
                           max_runtime_in_seconds=1200,
                           base_job_name='tf2-object-detection')

input_folder = '/opt/ml/processing/input'
ground_truth_manifest = '/opt/ml/processing/input/output.manifest'
label_map = '{"0": "bee"}' # each class ID should map to the human readable equivalent
output_folder = '/opt/ml/processing/output'

data_processor.run(
    arguments= [
        f'--input={input_folder}',
        f'--ground_truth_manifest={ground_truth_manifest}',
        f'--label_map={label_map}',
        f'--output={output_folder}'
    ],
    inputs = [
        ProcessingInput(
            input_name='input',
            source=s3_input,
            destination=input_folder
        )
    ],
    outputs= [
        ProcessingOutput(
            output_name='tfrecords',
            source=output_folder,
            destination=f's3://{bucket}/data/bees/tfrecords'
        )
    ]
)
The job takes the .jpg images, the output.manifest, and the dictionary of classes as Amazon S3 inputs. It splits the dataset into a training and a validation datasets, generates the TFRecord and label_map.pbtxt files, and outputs them into the Amazon S3 destination of our choice.
Out of the total of 500 images, we use 450 for training and 50 for validation.
During the training the algorithm, we use the first set to train the model and the latter for evaluation.
You should end up with three files named label_map.pbtxt, train.records, and validation.records in the Amazon S3 destination you defined (s3://{bucket}/data/bees/tfrecords).

We can now move to model training!
Fine-tuning an EfficientDet model with TensorFlow 2 on SageMaker
You can follow this section by running the cells in this notebook.
Building a TensorFlow 2 Object Detection API Docker container
In this step, we first build and push a Docker container based on the Tensorflow gpu image.
We install the TensorFlow Object Detection API and the sagemaker-training-toolkit library to make it easily compatible with SageMaker.
SageMaker offers several ways to run our custom container. For more information, see Amazon SageMaker Custom Training containers. For this post, we use script mode and instantiate our SageMaker estimator as a CustomFramework. This allows us to work dynamically with our training code stored in the source_dir folder and prevents us from pushing container images to Amazon ECR at every change.
The following screenshot shows the corresponding training folder structure.

Setting up TensorBoard real-time monitoring using SageMaker Debugger
To capture real-time model training and performance metrics, we use TensorBoard and SageMaker Debugger. First, we start by defining a TensorboardOutputConfig in which we specify the S3 path where we save the TensorFlow checkpoints. See the following code:
from sagemaker.debugger import TensorBoardOutputConfig

tensorboard_output_config = TensorBoardOutputConfig(
    s3_output_path=tensorboard_s3_prefix,
    container_local_output_path='/opt/training/'
)
Each time the training script writes a date to the container_local_output_path, SageMaker uploads it to Amazon S3, allowing us to monitor in real time.
Training a TensorFlow 2 object detection model using SageMaker
We fine-tune a pre-trained EfficientDet model available in the TensorFlow 2 Object Detection Model Zoo, because it presents good performance on the COCO 2017 dataset and efficiency to run it.
We save the model checkpoint and its base pipeline.config in the source_dir folder, along with our training code.
We then adjust the pipeline.config so TensorFlow 2 can find the TFRecord and label_map.pbtxt files when they are loaded inside the container from Amazon S3.
Your source_dir folder should now look like the following screenshot.

We use run_training.sh as the run entry point. This is the main script that SageMaker runs during training time, and performs the following steps:
- Launch the model training based on the specified hyperparameters.
- Launch the model evaluation based on the last checkpoint saved during the training.
- Prepare the trained model for inference using the exporter script.
You’re ready to launch the training job with the following commands:
hyperparameters = {
    "model_dir":"/opt/training",
    "pipeline_config_path": "pipeline.config",
    "num_train_steps": 1000,
    "sample_1_of_n_eval_examples": 1
}

estimator = CustomFramework(image_uri=container,
                            role=role,
                            entry_point='run_training.sh',
                            source_dir='source_dir/',
                            instance_count=1,
                            instance_type='ml.p3.8xlarge',
                            hyperparameters=hyperparameters,
                            tensorboard_output_config=tensorboard_output_config,
                            base_job_name='tf2-object-detection')

#We make sure to specify wait=False, so our notebook is not waiting for the training job to finish.

estimator.fit(inputs)
When the job is running, Debugger allows us to capture TensorBoard data into a chosen Amazon S3 location and monitor the progress in real time with TensorBoard. As we indicated in the log directory when configuring the TensorBoardOutputConfig object, we can use it to as the --logdir parameter.
Now, we can start up the TensorBoard server with the following command:
job_artifacts_path = estimator.latest_job_tensorboard_artifacts_path()
tensorboard_s3_output_path = f'{job_artifacts_path}/train'

!F_CPP_MIN_LOG_LEVEL=3 AWS_REGION=<ADD YOUR REGION HERE> tensorboard --logdir=$tensorboard_s3_output_path
TensorBoard runs on your notebook instance, and you can open it by visiting the URL https://your-notebook-instance-name.notebook.your-region.sagemaker.aws/proxy/6006/.
The following screenshot shows the TensorBoard dashboard after the training is over.

We can also look at the TensorBoard logs generated by the evaluation step. These are accessible under the following eval folder:
tensorboard_s3_output_path = f'{job_artifacts_path}/eval'
region_name = 'eu-west-1'

!F_CPP_MIN_LOG_LEVEL=3 AWS_REGION=$region_name tensorboard —logdir=$tensorboard_s3_output_path
This allows us to compare the ground truth data (right image in the following screenshot) and the predictions (left image).

Deploying your object detection model into a SageMaker endpoint
When the training is complete, the model is exported to a TensorFlow inference graph as a model.tar.gz.gz .pb file and saved in a model.tar.gz .zip file in Amazon S3 by SageMaker. model
SageMaker provides a managed TensorFlow Serving environment that makes it easy to deploy TensorFlow models.
To access the model_artefact path, you can open the training job on the SageMaker console, as in the following screenshot.

When you have the S3 model artifact path, you can use the following code to create a SageMaker endpoint:
from sagemaker.tensorflow.serving import Model

model_artefact = '<your-model-s3-path>'

model = Model(model_data=model_artefact,
              name=name_from_base('tf2-object-detection'),
              role=role,
              framework_version='2.2')

predictor = model.deploy(initial_instance_count=1, instance_type='ml.m5.xlarge')
When the endpoint is up and running, we can send prediction requests to it with test images and visualize the results using the Matplotlib library:
img = image_file_to_tensor('test_images/22673445.jpg')

input = {
  'instances': [img.tolist()]
}

detections = predictor.predict(input)['predictions'][0]
The following screenshot shows an example of our output.

Summary
In this post, we covered an end-to-end process of collecting and labeling data using Ground Truth, preparing and converting the data to TFRecord format, and training and deploying a custom object detection model using the TensorFlow Object Detection API.
Get started today! You can learn more about SageMaker and kick off your own machine learning experiments and solutions by visiting Amazon SageMaker console.
About the Authors
 Sofian Hamiti is an AI/ML specialist Solutions Architect at AWS. He helps customers across industries accelerate their AI/ML journey by helping them build and operationalize end-to-end machine learning solutions.
 Othmane Hamzaoui is a Data Scientist working in the AWS Professional Services team. He is passionate about solving customer challenges using Machine Learning, with a focus on bridging the gap between research and business to achieve impactful outcomes. In his spare time, he enjoys running and discovering new coffee shops in the beautiful city of Paris.
How a university researcher is using machine learning to help identify suicide risk
Using social media data, the University of Maryland’s Philip Resnik aims to help clinicians prioritize individuals who may need immediate attention.Read More
Learn from the winner of the AWS DeepComposer Chartbusters Track or Treat challenge
AWS is excited to announce the winner of the AWS DeepComposer Chartbusters Track or Treat challenge, Greg Baker. AWS DeepComposer gives developers a creative way to get started with machine learning (ML). In June 2020, we launched Chartbusters, a global competition in which developers use AWS DeepComposer to create original AI-generated compositions and compete to showcase their ML skills. Developers of all skill levels can train and optimize generative AI models to create original music. The Track or Treat challenge, which ran in October 2020, challenged developers to create Halloween-themed compositions using the AWS DeepComposer Music studio.
Greg Baker, a father of two in Sydney, Australia, works as a CTO for several startups to help build out their technology infrastructure. He has a background in mathematics, and teaches courses in ML and data science. One of his friends first introduced him to how he could combine mathematics with ML, and this became his starting point for exploring ML.
We interviewed Greg to learn about his experience competing in the Track or Treat Chartbusters challenge, and asked him to tell us more about how he created his winning composition.
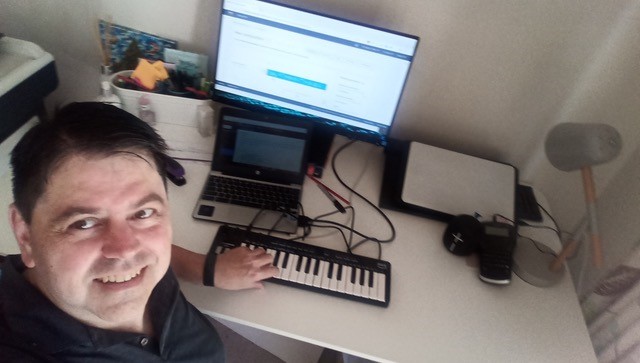
Greg Baker at his work station
Getting started with generative AI
Before entering the Chartbusters challenge, one of Greg’s earliest projects in ML was during an ML meetup in Australia. Participants were tasked with presenting something they had worked on in generative AI. Greg created a model that tried to learn how to handwrite words through an optical character recognition (OCR) system.
“I had a system that generated random scribbled letters and fed them through an OCR system to try and make sense of it,” Greg says. “I sent it to the OCR system and the OCR system gives a percentage probability of what it might be. And my goal with the system was to produce something that could learn how to do handwriting that could be read.”
Greg ended up not pursuing the project.
“It could sort of get the letter L, and that’s all it could learn to write. It didn’t work very well; it was 7,000 iterations to learn the letter L. I had grand plans about how it was going to learn to write Chinese and learn the history of hieroglyphics, but it couldn’t do a thing,” laughed Greg. “It was so embarrassingly bad; I sort of buried it afterwards.”
Greg happened to find AWS DeepComposer on the AWS Console through his work. He was intrigued with AWS DeepComposer, because in addition to his passion in mathematics and ML, Greg has worked as a professional musician.
“The highlight of my music career so far has been jamming with the Piano Guys at the Sydney Opera House. I also worked as a pipe organ building apprentice for a while, so I have a bit of practice in making spooky music!”
Greg spent time in the AWS DeepComposer Music studio and through his interest in music and ML, decided to compete in the Chartbusters challenge.
Building in AWS DeepComposer
In Track or Treat, developers were challenged to compose music using spooky instruments in the AWS DeepComposer Music Studio. Greg created two compositions throughout his process. First, he created a composition to get a handle of the AWS DeepComposer keyboard. Then, he worked on his second composition using the autoregressive convolutional neural network model to make his composition as spooky as possible.
“I knew that to do something spooky, I wanted it to be as low as possible and in a minor key. The AWS keyboard goes down to F, so I played a few notes in F minor, and then echoed them starting on a B flat, and then did a few variant notes starting on F again.”
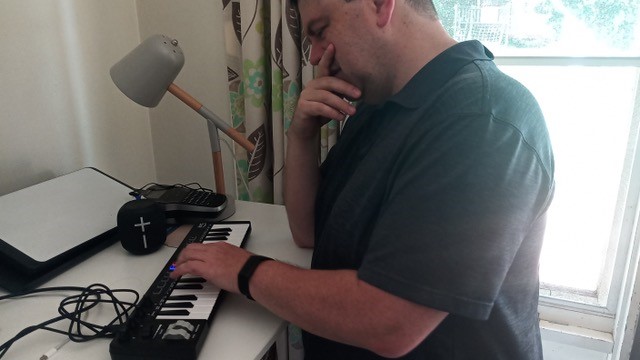
Greg composing his melody
Greg’s favorite feature on the AWS DeepComposer console is the autoregressive convolutional neural network (AR-CNN) model. The AR-CNN technique works by adding and removing notes from the input track provided. Adjusting the hyperparameters further controls how the model edits the melody. Developers can also use the Edit melody feature to collaborate iteratively with the technique. Learn more about generating compositions using the AR-CNN model.
Greg explains how the model can take a couple notes and generate a musical composition that, upon hearing, you would not know was generated by a machine.
“If you heard it in a concert you wouldn’t guess it was automatically composed. There are options to make the autoregressor very experimental, which I turned way down in the opposite direction so that DeepComposer would be very conservative and follow all the rules that my music theory teachers drilled into me. I wanted to make it feel very classical—like it was written in the same era that Shelley was writing Frankenstein.”
You can listen to Greg’s winning composition, “Halloween,” on the AWS DeepComposer SoundCloud page.
What’s next
In the future, Greg hopes to see more bridges between music creation, artificial intelligence, and generative AI. With AWS DeepComposer, developers can create original music using generative AI which opens the door to an entire world of human and computer creativity. Greg hopes this challenge encourages more people with no background in music to become creators using AI.
“Computing is one of those enabling technologies that lets individuals, wherever they are, create in the world and create things of value […] What I’m hoping is that this will expand the scope of people who can take some joy in composing. At the moment, it’s not something everyone can do, but creating new music is such a wonderful feeling that I wish more people could experience it.”
Greg felt that the Chartbusters challenge nurtured his desire to be a creator and builder through creating a lasting piece of music. From developers who have no background in music composition, to developers who are experienced in music composition, anyone can enjoy the process of building and creating in AWS DeepComposer and listen to the final compositions created from the Chartbusters challenge.
“I’m not a very competitive person […] but setting algorithms to compete against each other seems like a fun thing to do. The Chartbusters competition is interesting because at the end of it, you have a piece of music that everyone can enjoy regardless of whether you win or lose. So it’s not so much about competing as creating.”
What’s next for Greg in ML? Building a model to predict his weight.
“I just recently created a machine learning model to predict my weight, based on how often I’m going running. I wasn’t really getting anywhere for most of this year—I was actually going backwards—but since I won the Chartbusters challenge and put together my prediction model, I’m beginning to make some progress.”
Congratulations to Greg for his well-deserved win!
We hope Greg’s story has inspired you to learn more about ML and get started with AWS DeepComposer. Check out the next AWS DeepComposer Chartbusters challenge, and start composing today.
About the Author
 Paloma Pineda is a Product Marketing Manager for AWS Artificial Intelligence Devices. She is passionate about the intersection of technology, art, and human centered design. Out of the office, Paloma enjoys photography, watching foreign films, and cooking French cuisine.
Teaching robots to respond to natural-language commands
Technique that relies on inverse reinforcement learning, or learning by example, improves task completion rate by 14% to 17% in simulations.Read More
Alexa & Friends features Kayoko Yanagisawa, Alexa AI senior speech scientist
Yanagisawa discusses the science behind Alexa’s new bilingual Polyglot model, her career in speech research, and more.Read More
Amazon DevOps Guru is powered by pre-trained ML models that encode operational excellence
On December 1, 2020, we announced the preview of Amazon DevOps Guru, a machine learning (ML)-powered service that gives operators of cloud-based applications a simpler way to measure and improve an application’s operational performance and availability to reduce expensive downtime.
Amazon DevOps Guru is a turn-key solution that helps operators by automatically ingesting operational data for analysis and predictively identifying operationally relevant issues. Although DevOps Guru uses ML models that are informed by years of operational expertise in building, scaling, and maintaining highly available applications at Amazon.com, it doesn’t require any ML experience.
Amazon DevOps Guru automatically identifies most common behaviors of applications that correspond to operational incidents. When it identifies a critical issue, it alerts service operators with a summary of related anomalies, the likely root cause, and context on when and where the issue occurred. When possible, it also provides prescriptive recommendations on how to remediate the issue. In this post, we shed light on some of the ML approaches that power DevOps Guru.
DevOps Guru detectors
At the core of Amazon DevOps Guru is a unique approach to identify meaningful operational incidents. At the start of our research for DevOps Guru, we focused on domain-agnostic, general-purpose anomaly detection models. Though they gave statistically correct results, these models couldn’t always identify or distinguish critical failures from interesting but not critical issues. Over time, we learned that failure patterns differ considerably from metric to metric. For example, a common use case of DevOps Guru is running highly available, low-latency web applications, where an operator may be interested in monitoring both application latency and the number of incoming requests. However, failure patterns in these two metrics differ substantially, making generic statistical anomaly detection models to address both scenarios unlikely to succeed. As a result, we changed our approach radically. After consulting with domain experts to identify known anomaly types across a variety of metrics and services, we set out to built domain-specific, single-purpose models to identify these known failure modes instead of normal metric behavior.
Fast-forward to now, Amazon DevOps Guru relies on a large ensemble of detectors—statistical models tuned to detect common adverse scenarios in a variety of operational metrics. DevOps Guru detectors don’t need to be trained or configured. They work instantly as long as enough history is available, saving days if not months of time that would otherwise be spent training ML models prior to anomaly generation. Individual detectors work in preconfigured ensembles to generate anomalies on some of the most important metrics operators monitor: error rates, availability, latency, incoming request rates, CPU, memory, and disk utilization, among others.
Detectors codify experts’ understanding of operational anomalies as closely as possible, in both determining anomalous patterns as well as establishing bounds for normal application behavior. Both detectors, and the ensembles that compose them into full models, were trained and tuned on Amazon’s data based on years of operational experience at Amazon.com and AWS. Next, we dive into some of the capabilities of DevOps Guru detectors.
Monitoring resource metrics with finite bounds
The purpose of this detector is to monitor finite resource metrics such as disk utilization. It utilizes a digital filter to detect long-running trends in metric data in a highly scalable and compute-effective manner. The detector notifies operators when these trends point to impending resource exhaustion. The following graph shows an illustrative example.

This detector identified a significant trend in disk usage, heading for disk exhaustion within 24 hours. The model has identified a significant trend between the vertical dashed lines. Extrapolating this trend (diagonal dashed line), the detector predicts time to resource exhaustion. As the metric breaches the horizontal red line, which acts as a significance threshold, the detector notifies operators.
Detecting scenarios with periodicity
Many metrics, such as the number of incoming requests in customer-facing APIs, exhibit periodic behavior. The purpose of the causal convolution detector is to analyze temporal data with such patterns and to determine expected periodic behavior. When the detector infers that a metric is periodic, it adapts normal metric behavior thresholds to the seasonal pattern (as in the following graph). On a selected group of metrics, Amazon DevOps Guru can also identify and filter periodic spiking behavior, such as regular batch jobs producing high database load. In the following graph, we only see one detector active for better visualization—in reality, the causal convolution detector tracks the seasonal metric closely, whereas a further dynamic threshold detector detects catastrophic changes if breached.
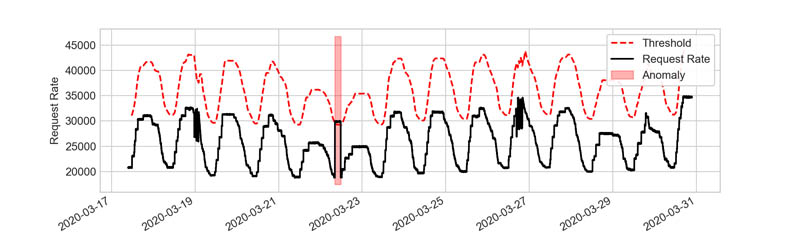
The causal convolution detector sets bounds for application behavior in line with daily application load patterns. By tracking the seasonality, it allows catching spikes relative to the weekend, which traditional approaches, based on static threshold lines, only catch at the expense of many false positives.
DevOps Guru insights
Instead of providing just a list of anomalies that an ensemble of detectors find, DevOps Guru generates operational insights that aggregate relevant information needed to investigate and remediate an operational issue. Amazon DevOps Guru leverages anomaly metadata to identify related anomalies and potential root causes. Based on metadata, related anomalies are grouped together based on their temporal proximity, shared resources, and a large graph of potential causal links between anomaly types.
DevOps Guru presents insights with the following:
- Graphs and timelines related to the numerous anomalous metrics
- Contextual information such as relevant events and log snippets for easily understanding the anomaly scope
- Recommendations to remediate the issue
The following screenshot illustrates an example insight detail page from DevOps Guru, which shows a collection of related metrics’ anomalies in a timeline view.

Conclusion
Amazon DevOps Guru saves IT operators hours if not days of time and effort spent detecting, debugging, and resolving operational issues. Because it uses pre-trained proprietary ML models informed by years of operational experience at Amazon.com and AWS in managing highly available services, IT operators can receive the same high-quality insights without having any ML experience. Start using DevOps Guru today.
Acknowledgments: The authors would like to acknowledge the contributions of Jan Gasthaus, Valentin Flunkert, Syama Rangapuram, Lorenzo Stella, Konstantinos Benidis and Francois Aubet to the algorithms and models presented in this blog post.
About the Authors
 Caner Türkmen is a Machine Learning Scientist at Amazon Web Services, where he works on problems at the intersection of machine learning, forecasting, and anomaly detection. Before joining AWS, he worked in the management consulting industry as a data scientist, serving the financial services and telecommunications industries on projects across the globe. Caner’s personal research interests span a range of topics including probabilistic and Bayesian ML, stochastic processes, and their practical applications.
 Ravi Turlapati leads product efforts at AWS. Ravi joined AWS more than three years ago, and has launched multiple products from scratch including AWS Data Exchange and Amazon DevOps Guru. In his latest role at AWS AI group, Ravi aims to deliver easy to use ML-based products that solve complex challenges for customers. Ravi is passionate about social causes and supports any charity that creates a self sustaining environment for those in need.
 Tim Januschowski is a Machine Learning Science Manager in Amazon’s AWS AI Labs. He has broad interests in machine learning with a particular focus on machine learning for business problems and decision making. At Amazon, he has produced end-to-end solutions for a wide variety of problems, from forecasting, to anomaly detection and personalization in application areas such as retail, operations and energy. Tim’s interests in applying machine learning span applications, system, algorithm and modeling aspects and the downstream mathematical programming problems. He studied Mathematics at TU Berlin, IMPA, Rio de Janeiro, and Zuse-Institute Berlin and holds a PhD from University College Cork.
Anomaly detection with Amazon Lookout for Metrics
This is a guest blog post from Quantiphi, an AWS Advanced Consulting Partner that specializes in artificial intelligence, machine learning, and data and analytics solutions.
We’ve all heard the saying “time is money,” and that’s especially true for the retail industry. In a highly competitive environment where large volumes of data are generated, quick and accurate anomaly detection is critical to smooth business operations and positive customer experiences. However, doing so is easier said than done. Traditional anomaly detection techniques fall short because they can’t efficiently keep up with the growing volume of data. To put this in perspective, one of the largest retailers today collects around 2.5 petabytes of data per hour. Techniques that detect anomalies quickly at this scale and identify their root causes are required for taking effective business decisions.
Traditionally, businesses use dashboards to track metrics or key performance indicators. However, as the number of metrics grow, anomaly identification and remediation using traditional techniques become cumbersome. Therefore, many organizations look at machine learning (ML)-based anomaly detection to overcome this challenge.
In this post, we walk you through a retail example to demonstrate how Amazon Lookout for Metrics, a new ML-based AWS service for anomaly detection, helps accelerate detection and remediation of anomalies.
Anomaly detection in retail transactional data
Let’s dive into an anomaly detection use case we worked on for an online retailer. The retailer generated large amounts of customer transactional data, which serves as a window into their end-customer’s behavior (what products, brands, promotions, and ads they engaged with). For them, quick and accurate anomaly detection in KPIs is imperative for timely remediation, in order to maintain inventory flow and price compliance. As a result, the retailer wanted to ensure that the anomaly insights were actionable and reflected real risks to inventory availability and revenue.
To set up Lookout for Metrics, we first divided the data into regular time intervals. We then set up the detector, specifying the category of every column and the time format of the timestamp, which are mandatory fields. Lookout for Metrics allows us to define up to five measures and five dimensions for continuous monitoring for anomalies. We then trained the detector using historical data and used live data for testing and continuous learning. We uploaded this data to Amazon Simple Storage Service (Amazon S3) regularly, at the time interval specified when setting up the detector.
At each specified time interval, Lookout for Metrics checked for the presence of new data and new anomalies. When it detected an anomaly, it provided two additional insights. First it provided a severity score measuring the magnitude of the anomaly. The severity scores also helped the retailer tune the sensitivity of their model to focus only on the most important events. Second, it revealed a breakdown of the dimensions that contributed to the anomaly, with a percentage contribution from each dimension value, which was useful for determining the appropriate actions to take.
When the retailer applied the detector, we identified a few transactions in which thousands of items were sold at steep discounts. We used insights from the dimensions to quickly learn that these transactions were due to wholesale purchasing and bulk order shipments to large corporations. The retailer was then able to promptly take action to ensure inventory availability for other customers wasn’t impacted.
Comparing Amazon Lookout for Metrics to traditional anomaly detection methods
One of the key benefits of using Lookout for Metrics is a reduction in setup time from days to hours. The setup process is straightforward (see the following diagram). After you define your data source and the metrics you want to track, you can build your first detector model. Lookout for Metrics is then capable of detecting anomalies continuously. In the previous retail example, we detected anomalies in the transactional dataset within 10 minutes of setting up the Lookout for Metrics detector. The process with traditional methods would take 2–3 days. Traditional methods also require highly technical resources and subject matter experts versed in analytics and ML to create and manage custom models. In the case of Lookout for Metrics, the service manages the ML pipeline, allowing you to focus on anomalies, root causes, and actions.

By leveraging a managed service like Lookout for Metrics, anomaly detection is simplified and automated, saving time and effort. Lookout for Metrics helps customers in a wide variety of industries such as retail, ads and marketing, gaming, software and internet, and telecommunications to accurately detect anomalies in their time series data and understand the root cause.
You can use Lookout for Metrics to do the following:
- Detect anomalies in metrics with high accuracy using advanced ML technology, leading to fewer false alarms and missed anomalies, with no ML experience required.
- Get a more holistic view of their business while minimizing disparate alerts. The service groups concurrent anomalies and sends a single alert on related anomalies, which summarizes the what, how, and where.
- Continuously improve accuracy and performance by providing feedback on detected anomalies. Lookout for Metrics incorporates your feedback in real time to learn what is most relevant to your business.
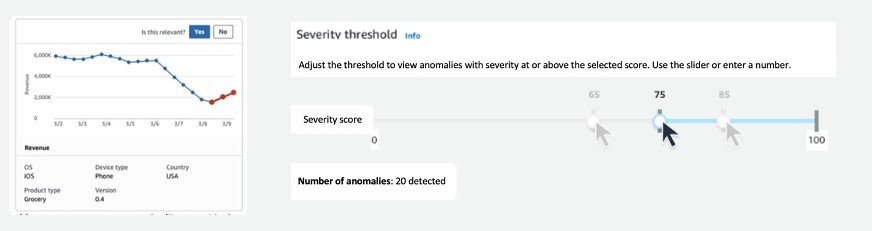
- Prioritize which anomalies to focus on first using the ranked severity score and tune the sensitivity threshold to get alerted on only the relevant anomalies (see the following diagram).
Summary
As an Advanced Consulting Partner, Quantiphi comes with immense experience in solving critical business challenges for our customers. We have worked on several anomaly detection engagements. In addition to the retail example discussed in this post, we recently helped an advertisement analytics company improve their offerings by building models to improve the effectiveness of ad campaigns.
With Lookout for Metrics, we aim to expedite the delivery of solutions to detect anomalies in different business processes, thus bringing unprecedented value to our customers.
Amazon Lookout for Metrics (Preview) is available on the AWS Management Console, via the AWS SDKs, and the AWS Command Line Interface (AWS CLI) in the following Regions: US East (N. Virginia), US East (Ohio), US West (Oregon), Europe (Ireland), and Asia Pacific (Tokyo). See the AWS Region Table for more details. Request access to the preview today.
Quantiphi is an AWS Advanced Consulting Partner with a deep understanding of artificial intelligence, machine learning, and data and analytics solutions. For more information about Quantiphi, contact them here.
The content and opinions in this post are those of the third-party author and AWS is not responsible for the content or accuracy of this post.
About the Authors
Vibhav Gupta is a Senior Client Solutions Partner at Quantiphi.
Tripurana Rahul is a Senior Business Analyst at Quantiphi.
How AWS scientists help create the NFL’s Next Gen Stats
In its collaboration with the NFL, AWS contributes cloud computing technology, machine learning services, business intelligence services — and, sometimes, the expertise of its scientists.Read More