![]()
Large deep learning models are becoming the workhorse of a variety of critical machine learning (ML) tasks. However, it has been shown that without any protection it is plausible for bad actors to attack a variety of models, across modalities, to reveal information from individual training examples. As such, it’s essential to protect against this sort of information leakage.
Differential privacy (DP) provides formal protection against an attacker who aims to extract information about the training data. The most popular method for DP training in deep learning is differentially private stochastic gradient descent (DP-SGD). The core recipe implements a common theme in DP: “fuzzing” an algorithm’s outputs with noise to obscure the contributions of any individual input.
In practice, DP training can be very expensive or even ineffective for very large models. Not only does the computational cost typically increase when requiring privacy guarantees, but the noise also increases proportionally. Given these challenges, there has recently been much interest in developing methods that enable efficient DP training. The goal is to develop simple and practical methods for producing high-quality large-scale private models.
The ImageNet classification benchmark is an effective test bed for this goal because 1) it is a challenging task even in the non-private setting, that requires sufficiently large models to successfully classify large numbers of varied images and 2) it is a public, open-source dataset, which other researchers can access and use for collaboration. With this approach, researchers may simulate a practical situation where a large model is required to train on private data with DP guarantees.
To that end, today we discuss improvements we’ve made in training high-utility, large-scale private models. First, in “Large-Scale Transfer Learning for Differentially Private Image Classification”, we share strong results on the challenging task of image classification on the ImageNet-1k dataset with DP constraints. We show that with a combination of large-scale transfer learning and carefully chosen hyperparameters it is indeed possible to significantly reduce the gap between private and non-private performance even on challenging tasks and high-dimensional models. Then in “Differentially Private Image Classification from Features”, we further show that privately fine-tuning just the last layer of pre-trained model with more advanced optimization algorithms improves the performance even further, leading to new state-of-the-art DP results across a variety of popular image classification benchmarks, including ImageNet-1k. To encourage further development in this direction and enable other researchers to verify our findings, we are also releasing the associated source code.
Transfer learning and differential privacy
The main idea behind transfer learning is to reuse the knowledge gained from solving one problem and then apply it to a related problem. This is especially useful when there is limited or low-quality data available for the target problem as it allows us to leverage the knowledge gained from a larger and more diverse public dataset.
In the context of DP, transfer learning has emerged as a promising technique to improve the accuracy of private models, by leveraging knowledge learned from pre-training tasks. For example, if a model has already been trained on a large public dataset for a similar privacy-sensitive task, it can be fine-tuned on a smaller and more specific dataset for the target DP task. More specifically, one first pre-trains a model on a large dataset with no privacy concerns, and then privately fine-tunes the model on the sensitive dataset. In our work, we improve the effectiveness of DP transfer learning and illustrate it by simulating private training on publicly available datasets, namely ImageNet-1k, CIFAR-100, and CIFAR-10.
Better pre-training improves DP performance
To start exploring how transfer learning can be effective for differentially private image classification tasks, we carefully examined hyperparameters affecting DP performance. Surprisingly, we found that with carefully chosen hyperparameters (e.g., initializing the last layer to zero and choosing large batch sizes), privately fine-tuning just the last layer of a pre-trained model yields significant improvements over the baseline. Training just the last layer also significantly improves the cost-utility ratio of training a high-quality image classification model with DP.
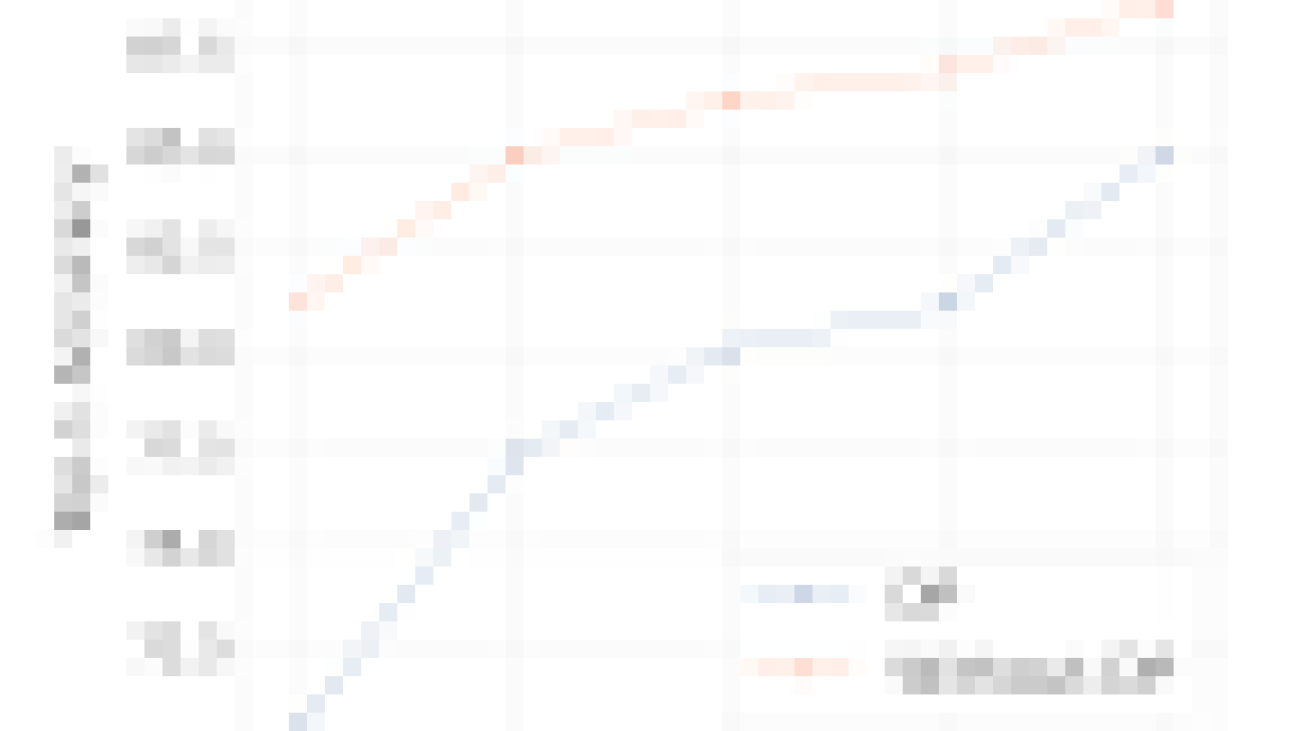
As shown below, we compare the performance on ImageNet of the best hyperparameter recommendations both with and without privacy and across a variety of model and pre-training dataset sizes. We find that scaling the model and using a larger pre-training dataset decreases the gap in accuracy coming from the addition of the privacy guarantee. Typically, privacy guarantees of a system are characterized by a positive parameter ε, with smaller ε corresponding to better privacy. In the following figure, we use the privacy guarantee of ε = 10.
 |
| Comparing our best models with and without privacy on ImageNet across model and pre-training dataset sizes. The X-axis shows the different Vision Transformer models we used for this study in ascending order of model size from left to right. We used JFT-300M to pretrain B/16, L/16 and H/14 models, JFT-4B (a larger version of JFT-3B) to pretrain H/14-4b and JFT-3B to pretrain G/14-3b. We do this in order to study the effectiveness of jointly scaling the model and pre-training dataset (JFT-3B or 4B). The Y-axis shows the Top-1 accuracy on ImageNet-1k test set once the model is finetuned (in the private or non-private way) with the ImageNet-1k training set. We consistently see that the scaling of the model and the pre-training dataset size decreases the gap in accuracy coming from the addition of the privacy guarantee of ε = 10. |
Better optimizers improve DP performance
Somewhat surprisingly, we found that privately training just the last layer of a pre-trained model provides the best utility with DP. While past studies [1, 2, 3] largely relied on using first-order differentially private training algorithms like DP-SGD for training large models, in the specific case of privately learning just the last layer from features, we observe that computational burden is often low enough to allow for more sophisticated optimization schemes, including second-order methods (e.g., Newton or Quasi-Newton methods), which can be more accurate but also more computationally expensive.
In “Differentially Private Image Classification from Features”, we systematically explore the effect of loss functions and optimization algorithms. We find that while the commonly used logistic regression performs better than linear regression in the non-private setting, the situation is reversed in the private setting: least-squares linear regression is much more effective than logistic regression from both a privacy and computational standpoint for typical range of ε values ([1, 10]), and even more effective for stricter epsilon values (ε < 1).
We further explore using DP Newton’s method to solve logistic regression. We find that this is still outperformed by DP linear regression in the high privacy regime. Indeed, Newton’s method involves computing a Hessian (a matrix that captures second-order information), and making this matrix differentially private requires adding far more noise in logistic regression than in linear regression, which has a highly structured Hessian.
Building on this observation, we introduce a method that we call differentially private SGD with feature covariance (DP-FC), where we simply replace the Hessian in logistic regression with privatized feature covariance. Since feature covariance only depends on the inputs (and neither on model parameters nor class labels), we are able to share it across classes and training iterations, thus greatly reducing the amount of noise that needs to be added to protect it. This allows us to combine the benefits of using logistic regression with the efficient privacy protection of linear regression, leading to improved privacy-utility trade-off.
With DP-FC, we surpass previous state-of-the-art results considerably on three private image classification benchmarks, namely ImageNet-1k, CIFAR-10 and CIFAR-100, just by performing DP fine-tuning on features extracted from a powerful pre-trained model.
 |
| Comparison of top-1 accuracies (Y-axis) with private fine-tuning using DP-FC method on all three datasets across a range of ε (X-axis). We observe that better pre-training helps even more for lower values of ε (stricter privacy guarantee). |
Conclusion
We demonstrate that large-scale pre-training on a public dataset is an effective strategy for obtaining good results when fine-tuned privately. Moreover, scaling both model size and pre-training dataset improves performance of the private model and narrows the quality gap compared to the non-private model. We further provide strategies to effectively use transfer learning for DP. Note that this work has several limitations worth considering — most importantly our approach relies on the availability of a large and trustworthy public dataset, which can be challenging to source and vet. We hope that our work is useful for training large models with meaningful privacy guarantees!
Acknowledgements
In addition to the authors of this blogpost, this research was conducted by Abhradeep Thakurta, Alex Kurakin and Ashok Cutkosky. We are also grateful to the developers of Jax, Flax, and Scenic libraries. Specifically, we would like to thank Mostafa Dehghani for helping us with Scenic and high-performance vision baselines and Lucas Beyer for help with deduping the JFT data. We are also grateful to Li Zhang, Emil Praun, Andreas Terzis, Shuang Song, Pierre Tholoniat, Roxana Geambasu, and Steve Chien for stimulating discussions on differential privacy throughout the project. Additionally, we thank anonymous reviewers, Gautam Kamath and Varun Kanade for helpful feedback throughout the publication process. Finally, we would like to thank John Anderson and Corinna Cortes from Google Research, Borja Balle, Soham De, Sam Smith, Leonard Berrada, and Jamie Hayes from DeepMind for generous feedback.

 AI can be hugely beneficial to society if citizens, educators, academics, civil society and governments unite to shape it responsibly.


 We’re starting to open access to Bard, an early experiment that lets you collaborate with generative AI. We’re beginning with the U.S. and the U.K., and will expand to m…


 Learn how features like Sleep Profiles, Smart Wake and cough and snore detection are powered by AI to help you get better sleep.