CrowdTangle opens public application for academics

Naomi Shiffman runs Academic & Research partnerships at CrowdTangle. Brandon Silverman is the CEO of CrowdTangle.

Supporting independent research through data access, training, and resources is critical to understanding the spread of public content across social media and to providing transparency into Facebook’s platforms. That’s why we’re excited to announce that CrowdTangle has now opened a public application for university-based researchers and academics.

CrowdTangle is a public insights tool from Facebook that makes it easy to follow, analyze, and report on what’s happening across social media. CrowdTangle started a pilot program in 2019 to partner with researchers and academics and help them study critical topics such as racial justice, misinformation, and elections. In addition to launching an online application, we’ve built a new hub with information about all Facebook data sets that are available for independent research.

CrowdTangle’s public application for researchers

Over the past year, CrowdTangle has been expanding its program for academics and researchers in beta. In that time, CrowdTangle has been used by researchers to study everything from Russian-linked influence operations in Africa to the spread of misinformation in European elections. Over 250 research teams at universities across the globe currently use the tool to support their research work, and more than 50 research publications have cited CrowdTangle data in the past year. The Stanford Internet Observatory recently shared how their work using CrowdTangle helped lead to a takedown of 76 accounts across 6 countries.

Now, we’re making more of this type of work possible by opening applications to university-based researchers at the faculty, PhD, or post-doctoral level, and who are focused on misinformation, elections, COVID-19, racial justice, and well-being. If accepted, researchers will receive access to all of CrowdTangle’s tools and API, as well as training and resources to support their research.

Apply for access

“CrowdTangle gave us a much more in-depth understanding of the content we were researching,” says Fabio Giglietto, Associate Professor, University of Urbino. “Thanks to CrowdTangle, we now know a lot more about coordinated inauthentic link sharing strategies, and have even more new hypotheses that we want to test.”

“In our digitally connected, ‘permanently online’ world, understanding the modern world requires a thorough academic examination of digital communication spheres,” says Lena Frischlich, University of Munster. “CrowdTangle offers user-friendly ways for studying public communication relatively fast, while, at the same time, providing customization options that allow for theory-driven academic research. Plus, the support team is really great.”

Learn more about CrowdTangle’s work with academics and researchers here.

Researchers can now find all data available to them in one centralized hub

We’ve also published a new hub where independent researchers can access all available Facebook data sets across CrowdTangle, the Ad Library, the Facebook Open Research Tool (FORT), and Data for Good. The hub also includes details on what data are available in each set and how to access them, so researchers can select the right fit for their work quickly and efficiently.

We’re excited to provide these new resources to the research community and help provide more transparency into the spread of public content across Facebook’s platforms.

The post CrowdTangle opens public application for academics appeared first on Facebook Research.

Read More

HPE’s Jared Dame on How AI, Data Science Driving Demand for Powerful New Workstations

HPE’s Jared Dame on How AI, Data Science Driving Demand for Powerful New Workstations

Smart phones, smart devices, the cloud — if it seems like AI is everywhere, that’s because it is.

That makes more essential than ever the powerful workstations able to crunch the ever growing quantities of data on which modern AI is built.

Jared Dame, Hewlett Packard Enterprise’s director of business development and strategy for AI, data science and edge technologies, spoke to AI Podcast host Noah Kravitz about the role HPE’s workstations play in cutting-edge AI and data science.

In the AI pipeline, Dame explained, workstations can do just about everything — from training to inference. The biggest demand for workstations is now coming from biopharmaceutical companies, the oil and gas industry and the federal government.

Key Points From This Episode:

  • Z by HP workstations feature hundreds of thousands of sensors that predict problems within a machine up to a month in advance, so customers don’t experience a loss of data or time.
  • The newest Z Book Studio, equipped with NVIDIA Quadro graphics, will be launching this fall.

Tweetables:

“Z by HP is selling literally everywhere. Every vertical market does data science, every vertical market is adopting various types of AI.” — Jared Dame [5:47]

“We’re drinking our own Kool Aid — we use our own machines. And we’re using the latest and greatest technologies from CUDA TensorFlow to traditional programming languages.” — Jared Dame [18:36]

You Might Also Like

Lenovo’s Mike Leach on the Role of the Workstation in Modern AI

Whether it’s the latest generation of AI-enabled mobile apps or robust business systems powered on banks of powerful servers, chances are the technology was built first on a workstation. Lenovo’s Mike Leach describes how these workhorses are adapting to support a plethora of new kinds of AI applications.

Serkan Piantino’s Company Makes AI for Everyone

Spell, founded by Serkan Piantino, is making machine learning as easy as ABC. Piantino, CEO of the New York-based startup, explained how he’s bringing compute power to those who don’t have easy access to GPU clusters.

SAS Chief Operating Officer Oliver Schabenberger

SAS Chief Operating Officer Oliver Schabenberger spoke about how organizations can use AI and related technologies.

Tune in to the AI Podcast

Get the AI Podcast through iTunes, Google Podcasts, Google Play, Castbox, DoggCatcher, Overcast, PlayerFM, Pocket Casts, Podbay, PodBean, PodCruncher, PodKicker, Soundcloud, Spotify, Stitcher and TuneIn. If your favorite isn’t listed here, drop us a note.

The post HPE’s Jared Dame on How AI, Data Science Driving Demand for Powerful New Workstations appeared first on The Official NVIDIA Blog.

Read More

It’s Not Pocket Science: Undergrads at Hackathon Create App to Evaluate At-Home Physical Therapy Exercises

It’s Not Pocket Science: Undergrads at Hackathon Create App to Evaluate At-Home Physical Therapy Exercises

The four undergrads met for the first at the Stanford TreeHacks hackathon, became close friends, and developed an AI-powered app to help physical therapy patients ensure correct posture for their at-home exercises — all within 36 hours.

Back in February, just before the lockdown, Shachi Champaneri, Lilliana de Souza, Riley Howk and Deepa Marti happened to sit across from each other at the event’s introductory session and almost immediately decided to form a team for the competition.

Together, they created PocketPT, an app that lets users know whether they’re completing a physical therapy exercise with the correct posture and form. It captured two prizes against a crowded field, and inspired them to continue using AI to help others.

The app’s AI model uses the NVIDIA Jetson Nano developer kit to detect a user doing the tree pose, a position known to increase shoulder muscle strength and improve balance. The Jetson Nano performs image classification so the model can tell whether the pose is being done correctly based on 100+ images it was trained on, which the team took of themselves. Then, it provides feedback to the user, letting them know if they should adjust their form.

“It can be taxing for patients to go to the physical therapist often, both financially and physically,” said Howk.

Continuing exercises at home is a crucial part of recovery for physical therapy patients, but doing them incorrectly can actually hinder progress, she explained.

Bringing the Idea to Life

In the months leading up to the hackathon, Howk, a rising senior at the University of Alabama, was interning in Los Angeles, where a yoga studio is virtually on every corner. She’d arrived at the competition with the idea to create some kind of yoga app, but it wasn’t until the team came across the NVIDIA table at the hackathon’s sponsor fair that they realized the idea’s potential to expand and help those in need.

“A demo of the Jetson Nano displayed how the system can track bodily movement down to the joint,” said Marti, a rising sophomore at UC Davis. “That’s what sparked the possibility of making a physical therapy app, rather than limiting it to yoga.”

None of the team members had prior experience working with deep learning and computer vision, so they faced the challenge of learning how to implement the model in such a short period of time.

“The NVIDIA mentors were really helpful,” said Champaneri, a rising senior at UC Davis. “They put together a tutorial guide on how to use the Nano that gave us the right footing and outline to follow and implement the idea.”

Over the first night of the hackathon, the team took NVIDIA’s Deep Learning Institute course on getting started with AI on the Jetson Nano. They’d grasped the basics of deep learning. The next morning, they began hacking and training the model with images of themselves displaying correct versus incorrect exercise poses.

In just 36 hours since the idea first emerged, PocketPT was born.

Winning More Than Just Awards

The most exciting part of the weekend was finding out the team had made it to final pitches, according to Howk. They presented their project in front of a crowd of 500 and later found out that it had won the two prizes.

The hackathon attracted 197 projects. Competing against 65 other projects in the Medical Access category — many of which used cloud or other platforms — their project took home the category’s grand prize. It was also chosen as the “Best Use of Jetson Hack,” among 11 other groups that borrowed a Jetson for their projects.

But the quartet is looking to do more with their app than win awards.

Because of the fast-paced nature of the hackathon, PocketPT was only able to fully implement one pose, with others still in the works. However, the team is committed to expanding the product and promoting their overall mission of making physical therapy easily accessible to all.

While the hackathon took place just before the COVID outbreak in the U.S., the team highlighted how their project seems to be all the more relevant now.

“We didn’t even realize we were developing something that would become the future, which is telemedicine,” said de Souza, a rising senior at Northwestern University. “We were creating an at-home version of PT, which is very much needed right now. It’s definitely worth our time to continue working on this project.”

Read about other Jetson projects on the Jetson community projects page and get acquainted with other developers on the Jetson forum page.

Learn how to get started on a Jetson project of your own on the Jetson developers page.

The post It’s Not Pocket Science: Undergrads at Hackathon Create App to Evaluate At-Home Physical Therapy Exercises appeared first on The Official NVIDIA Blog.

Read More

Optimizing your engagement marketing with personalized recommendations using Amazon Personalize and Braze

Optimizing your engagement marketing with personalized recommendations using Amazon Personalize and Braze

Today’s marketer has a wide array of channels to communicate with their customers. However, sending the right message to the right customer on the right channel at the right time remains the preeminent challenge marketers face. In this post, I show you how to combine Braze, a customer engagement platform built on AWS for today’s on-demand, always-connected customers, and Amazon Personalize to meet this challenge and deliver experiences that surprise and delight your customers.

Braze makes it easy to organize your customers into audiences, which update in real-time, based on their behavior and profile traits. Messaging campaigns are created to target audiences through messaging channels such as email, SMS, and push notifications. Multi-step and multi-channel engagement journeys can also be designed using Braze Canvas. Campaigns and Canvases are triggered manually, based on a schedule, or even due to customer actions. However, your ability to personalize messages sent to customers is limited to what is available in their profile. Including product and content recommendations based on the learned interests of each customer as they engage with your web and mobile application is needed to truly personalize each message.

Amazon Personalize is an AWS service that uses machine learning algorithms to create recommender systems based on the behavioral data of your customers. The recommenders are private to your AWS account and based only on the data you provide. Through the Braze Connected Content feature, you are able to connect Braze to the same Amazon Personalize recommenders used to power recommendations in your web and mobile application. Since Amazon Personalize is able to adjust recommendations for each customer based on their behavior in real-time, the messages sent through Braze reflect their current preferences and intent.

Overview of solutions

I present two architectures in this post: one that uses the real-time capabilities of Braze and Amazon Personalize, and another that trades some of the freshness of real-time recommendations for a more cost-effective batch approach. The approach you select should match the goals of your engagement strategy and the scale of your messaging needs. Fortunately, the features and integration options of Braze and Amazon Personalize provide the flexibility to suit your operational requirements.

Real-time integration

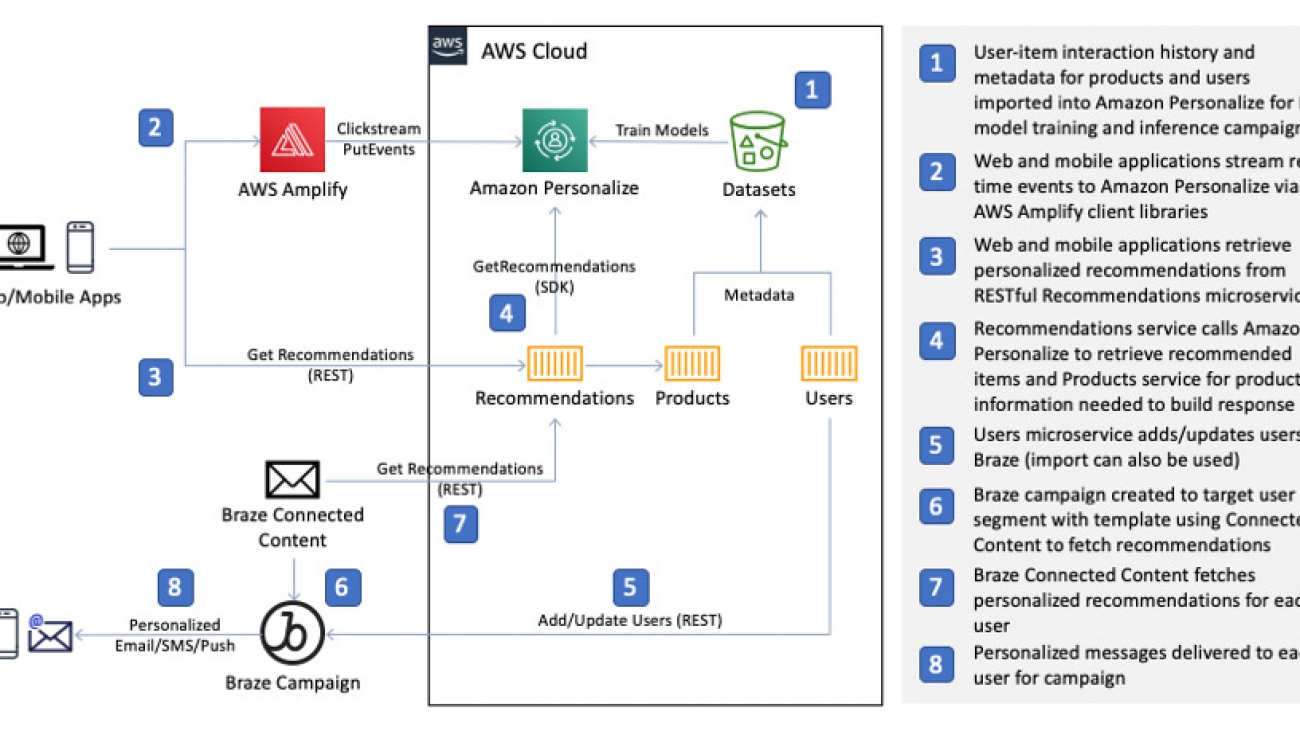
We start with a real-time integration architecture. The following diagram depicts the relevant components of a sample ecommerce application in which you use Amazon Personalize to provide machine learning (ML)-powered recommenders, referred to as solutions. The primary data used to build solutions is user-item interaction history. For an ecommerce application, this includes events such as viewing a product, adding a product to a shopping cart, and purchasing a product. When rich metadata on events, items, and users is available, you can incorporate it to further improve the relevance of recommendations from the recommender. Examples of metadata include device type, location, and season for events; category, genre, and price point for items; and users’ age, gender, and subscription tier. After you create solutions, you can create autoscaling API endpoints called campaigns with just a few clicks to retrieve personalized recommendations.

Later in this post, I show you how to deploy this application in your AWS account. A self-guided workshop is also packaged with the application that you use to walk through sending personalized emails with Braze.

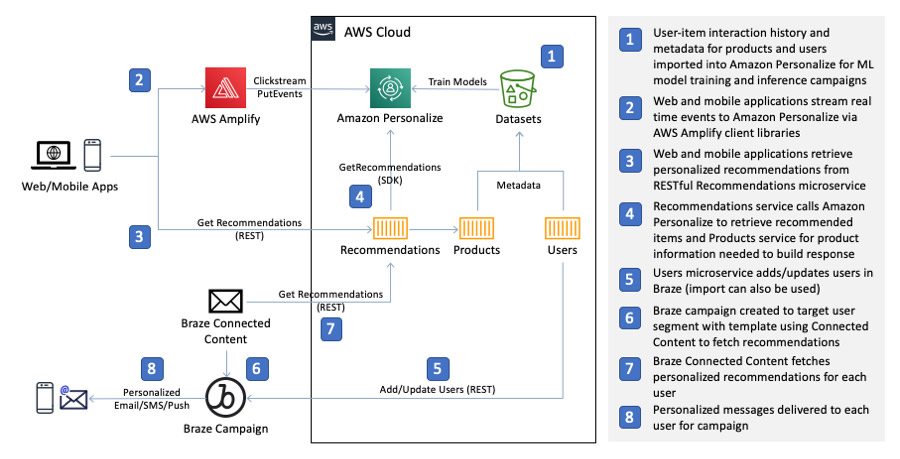
Our example ecommerce application retrieves personalized recommendations from a Recommendations microservice that appends the recommended item IDs from Amazon Personalize with rich product information from a Products microservice. As users engage with the application and indicate interest by viewing a product, adding a product to their shopping cart, or purchasing a product, events representing these actions are streamed to Amazon Personalize via the AWS Amplify JavaScript client library where Amazon Personalize automatically adjusts recommendations in real time based on user activity.

With personalization built into the application, you can connect Amazon Personalize with Braze to deliver personalized recommendations through outbound engagement channels such as email, SMS, and push notifications.

Braze allows you to create message templates that use the Liquid templating language to substitute placeholders in your template with values from a customer’s profile or even from an external resource. In the real-time architecture, we use the Recommendations microservice from the sample application as the external resource and Braze Connected Content as the feature to retrieve personalized recommendations to include in your message templates. The following Connected Content Liquid tag, placed at the top of your message, illustrates how to call the Recommendations service from Braze to retrieve recommendations for a user:

{% connected_content http://<RecommendationsServiceHostName>/recommendations?userID={{${user_id}}}&fullyQualifyImageUrls=1&numResults=4 :save result %}

The tag has the following elements:

  • Liquid tags are framed within {% and %} This allows you to embed tags and expressions inside message templates that may also contain text or HTML.
  • The tag type is declared just after the start of the tag. In this case, connected_content is the tag type. For the full list of supported tags, see Personalization Using Liquid Tags.
  • You next define a fully-qualified URL to the HTTP resource that Connected Content calls for each user. You replace <RecommendationsServiceHostName> with the host name for the Elastic Load Balancer for the Recommendations service in your deployment of the sample application.
  • The Recommendations service provides a few resources for different personalization features. The resource for user recommendations is accessed from the /recommendations path.
  • The query string parameters come next. The user is identified by the userID parameter, and the {{${user_id}}} expression instructs Braze to interpolate the user’s ID for each call to the service.
  • The last two query string parameters, fullyQualifyImageUrls=1 and numResults=4, tell the Recommendations service that we want the product image URLs to be fully qualified so they can be displayed in the user’s email client and, in this case, to only return the top four recommendations, respectively.
  • The :save result expression tells Braze to assign the JSON response from the Recommendations service to a template variable named result. With the response saved, you can then access elements of the response using Liquid tags in the rest of the template.

The following code shows the format of a response from the Recommendations service:

[ 
  { 
    "product": { 
      "id": "2", 
      "url": "http://recs.cloudfront.net/#/product/2", 
      "sk": "", 
      "name": "Striped Shirt", 
      "category": "apparel", 
      "style": "shirt", 
      "description": "A classic look for the summer season.", 
      "price": 9.99, 
      "image": "http://recs.cloudfront.net/images/apparel/1.jpg",
      "featured": "true" 
    } 
  }, 
  { 
    "product": { 
      "id": "1", 
      "url": "http://recs.cloudfront.net/#/product/1", 
      "sk": "", 
      "name": "Black Leather Backpack", 
      "category": "accessories", 
      "style": "bag", 
      "description": "Our handmade leather backpack will look great at the office or out on the town.", 
      "price": 109.99, 
      "image": "http://recs.cloudfront.net/images/accessories/1.jpg",
      "featured": "true" 
    } 
  }, 
  ... 
]

For brevity, the preceding code only shows the first two recommended products. Several product attributes are available that you can use in the Braze message template to represent each recommendation. To access a specific element of an array or list as we have here, you can use array subscripting notation in your Liquid tag. For example, the following tag interpolates the product name for the first recommended product in the response. For the preceding sample response, the tag resolves to “Striped Shirt”:

{{result[0].product.name}} 

When you combine the information in the personalized recommendation response from the Recommendations service with Liquid tags, the possibilities for building message designs are endless. The following code is a simplified example of how you could display a product recommendation in an HTML email template:

<table>
  <tr>
    <td>
      <a href="{{result[0].product.url}}" target="_blank">
        <img src="{{result[0].product.image}}" width="200" alt="{{result[0].product.name}}" />
      </a>
    </td>
    <td>
      <h2>{{result[0].product.name}}</h2>
      <p>{{result[0].product.description}}</p>
      <p>Only <strong>$ {{result[0].product.price}}</strong>!</p>
      <a class="button" href="{{result[0].product.url}}">Buy Now</a>
    </td>
  </tr>
</table>

Batch integration

The batch integration architecture replaces the use of the Braze Connected Content feature with an Amazon Personalize batch recommendations job that is used to push attribute updates to Braze. Batch recommendations involve creating a file in an Amazon Simple Storage Service (Amazon S3) bucket that includes the users who you wish to generate recommendations for. A reference to this file is then used to submit a job to Amazon Personalize to generate recommendations for each user in the file and output the results to another Amazon S3 file of your choosing. You can use the output of the batch recommendations job to associate personalized recommendations with user profiles in Braze as custom attributes. The Liquid tags in the message templates we saw earlier are changed to access the recommendations as custom attributes from the user profile rather than the Connected Content response.

As noted earlier, the trade-off you’re making with the batch approach is sacrificing the freshness of real-time recommendations for a more cost-effective solution. Because batch recommendations don’t require an Amazon Personalize campaign, the additional requests from Connected Content to your campaign for each user are eliminated. For Braze campaigns that target extremely large segments, this can result in a significant reduction in requests. Furthermore, if you don’t need an Amazon Personalize campaign for other purposes or you’re creating an Amazon Personalize solution dedicated to email personalization, you can forego creating a campaign entirely.

The following diagram illustrates one of the many possible approaches to designing a batch architecture. The web application components from the real-time architecture still apply; they are excluded from this diagram for brevity.

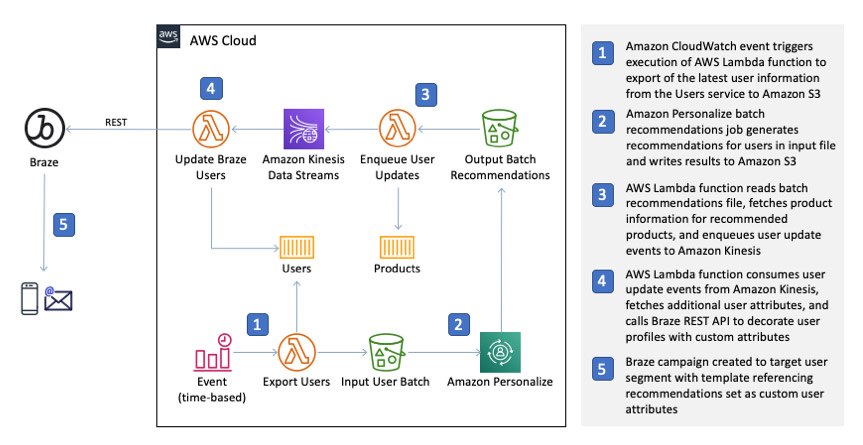
You use Amazon CloudWatch Events to periodically trigger an AWS Lambda function that builds an input file for an Amazon Personalize batch recommendations job. When the batch recommendations job is complete, another Lambda function processes the output file, decorates the recommended items with rich product information, and enqueues user update events in Amazon Kinesis Data Streams. Finally, another Lambda function consumes the stream’s events and uses the Braze User API to update user profiles.

The use of a Kinesis data stream provides a few key benefits, including decoupling the batch job from the transactional Braze user update process and the ability to pause, restart, and replay user update events.

Real-time integration walkthrough

You implement the real-time integration in the Retail Demo Store sample ecommerce application. In this post, we walk you through the process of deploying this project in your AWS account and describe how to launch the self-guided Braze workshop bundled with the application.

You complete the following steps:

  1. Deploy the Retail Demo Store project to your AWS account using the supplied AWS CloudFormation templates (25–30 minutes).
  2. Build Amazon Personalize solutions and campaigns that provide personalized recommendations (2 hours).
  3. Import users into Braze and build a Braze campaign that uses Connected Content to retrieve personalized recommendations from Amazon Personalize (1 hour).
  4. Clean up resources.

Prerequisites

For this walkthrough, you need the following prerequisites:

  • An AWS account
  • A user in your AWS account with the necessary privileges to deploy the project
  • A Braze account

If you don’t have a Braze account, please contact your Braze representative. We also assume that you have completed at least the Getting Started with Braze LAB course.

Step 1: Deploying the Retail Demo Store to your AWS account

From the following table, choose Launch Stack in the Region of your choice. This list of Regions doesn’t represent all possible Regions where you can deploy the project, just the Regions currently configured for deployment.

Region Launch
US East (N. Virginia)
US West (Oregon)
Europe (Ireland)

Accept all the default template parameter values and launch the template. The deployment of the project’s resources takes 25–30 minutes.

Step 2: Building Amazon Personalize campaigns

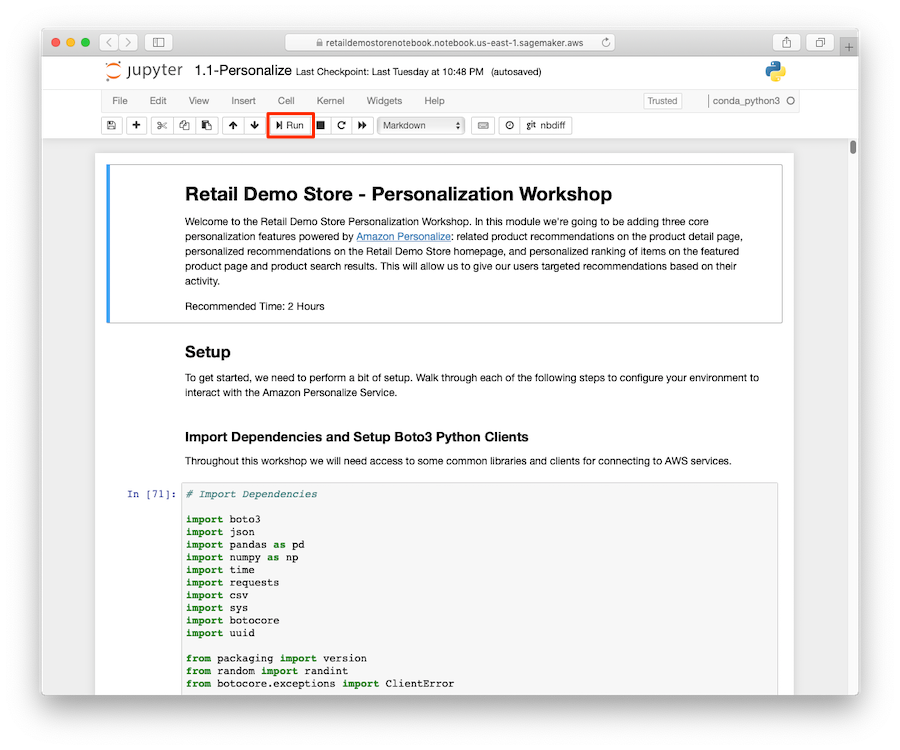
Before you can provide personalized product recommendations, you first need to train the ML models and provision the inference endpoints in Amazon Personalize that you need to retrieve recommendations. The CloudFormation template deployed in Step 1 includes an Amazon SageMaker notebook instance that provides a Jupyter notebook with detailed step-by-step instructions. The notebook takes approximately 2 hours to complete.

  1. Sign in to the AWS account where you deployed the CloudFormation template in Step 1.
  2. On the Amazon SageMaker console, choose Notebook instances.
  3. If you don’t see the RetailDemoStore notebook instance, make sure you’re in the same Region where you deployed the project.
  4. To access the notebook instance, choose Open Jupyter or Open JupyterLab.
  5. When the Jupyter web interface is loaded for the notebook instance, choose the workshop/1-Personalization/1.1-Personalize.ipynb.

The notebooks are organized in a directory structure, so you may have to choose the workshop folder to see the notebook subdirectories.

  1. When you have the 1.1-Personalize notebook open, step through the workshop by reading and running each cell.

You can choose Run from the Jupyter toolbar sequentially run the code in the cells.

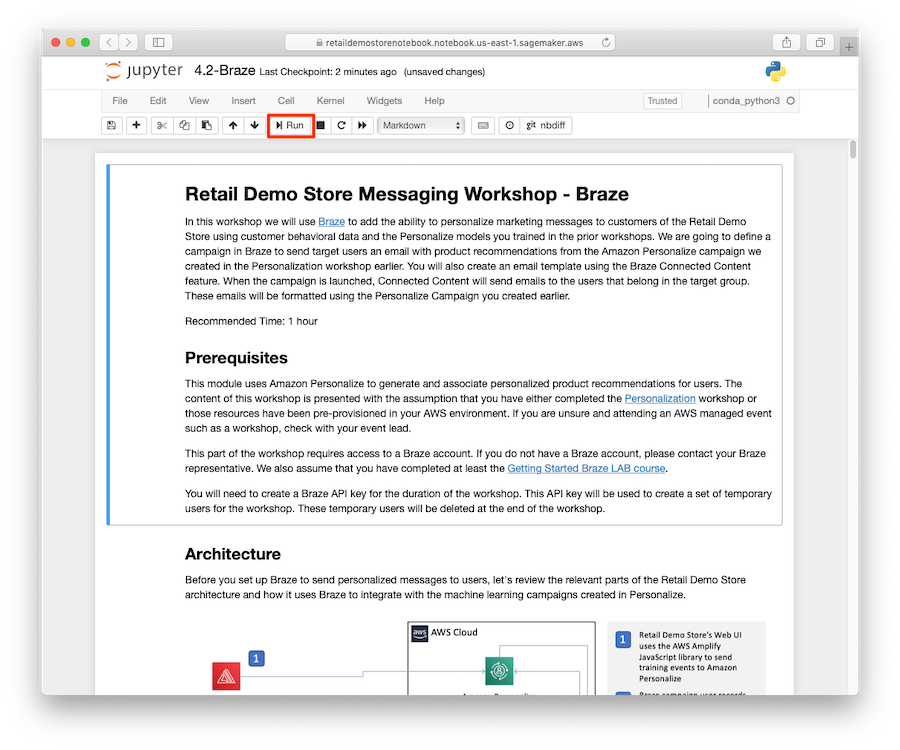
Step 3: Sending personalized messages from Braze

With the Amazon Personalize solutions and campaigns to produce personalized recommendations in place, you can now import users into your Braze account, build a messaging template that uses Braze Connected Content to retrieve recommendations from Amazon Personalize, and build a Braze campaign to send targeted emails to your users.

Similar to the Personalization workshop in Step 1, the Braze messaging workshop steps you through the process. This notebook takes approximately 1 hour to complete.

  1. If necessary, repeat the instructions in Step 1 to open a Jupyter or JupyterLab browser window from the Amazon SageMaker notebook instance in your Retail Demo Store deployment.
  2. When the Jupyter web interface is loaded for the notebook instance, choose the workshop/4-Messaging/4.2-Braze.ipynb notebook.

As with before, you may have to choose the workshop folder to see the notebook subdirectories.

  1. When you have the 4.2-Braze notebook open, step through the workshop by reading and running each cell.

Step 4: Cleaning up

To avoid incurring future charges, delete the resources the Retail Demo Store project created by deleting the CloudFormation stack you used during deployment. For more information about the source code for this post and the full Retail Demo Store project, see the GitHub repo.

Conclusion

As marketers compete for the attention of customers through outbound messaging, there is increasing pressure to effectively target the right users, at the right time, on the right channel, and with the right messaging. Braze provides the solution to the first three challenges. You can solve the final challenge with Braze Connected Content and Amazon Personalize, and deliver highly personalized product and content recommendations that reflect each customer’s current interests.

How are you using outbound messaging to reach your customers? Is there an opportunity to increase engagement with your customers with more relevant and personalized content?

About Braze

Braze is an AWS Advanced Technology Partner and holder of the AWS Digital Customer Experience and Retail competencies. Top global brands such as ABC News, Urban Outfitters, Rakuten, and Gap are sending tens of billions of messages per month to over 2 billion monthly active users with Braze.


About the Author

James Jory is a Solutions Architect in Applied AI with AWS. He has a special interest in personalization and recommender systems and a background in ecommerce, marketing technology, and customer data analytics. In his spare time, he enjoys camping and auto racing simulation.


Read More

Introducing the Model Card Toolkit for Easier Model Transparency Reporting

Introducing the Model Card Toolkit for Easier Model Transparency Reporting

Posted by Huanming Fang and Hui Miao, Software Engineers, Google Research

Machine learning (ML) model transparency is important across a wide variety of domains that impact peoples’ lives, from healthcare to personal finance to employment. The information needed by downstream users will vary, as will the details that developers need in order to decide whether or not a model is appropriate for their use case. This desire for transparency led us to develop a new tool for model transparency, Model Cards, which provide a structured framework for reporting on ML model provenance, usage, and ethics-informed evaluation and give a detailed overview of a model’s suggested uses and limitations that can benefit developers, regulators, and downstream users alike.

Over the past year, we’ve launched Model Cards publicly and worked to create Model Cards for open-source models released by teams across Google. For example, the MediaPipe team creates state-of-the-art computer vision models for a number of common tasks, and has included Model Cards for each of their open-source models in their GitHub repository. Creating Model Cards like these takes substantial time and effort, often requiring a detailed evaluation and analysis of both data and model performance. In many cases, one needs to additionally evaluate how a model performs on different subsets of data, noting any areas where the model underperforms. Further, Model Card creators may want to report on the model’s intended uses and limitations, as well as any ethical considerations potential users might find useful, compiling and presenting the information in a format that’s accessible and understandable.

To streamline the creation of Model Cards for all ML practitioners, we are sharing the Model Card Toolkit (MCT), a collection of tools that support developers in compiling the information that goes into a Model Card and that aid in the creation of interfaces that will be useful for different audiences. To demonstrate how the MCT can be used in practice, we have also released a Colab tutorial that builds a Model Card for a simple classification model trained on the UCI Census Income dataset.

Introducing the MCT
To guide the Model Card creator to organize model information, we provide a JSON schema, which specifies the fields to include in the Model Card. Using the model provenance information stored with ML Metadata (MLMD), the MCT automatically populates the JSON with relevant information, such as class distributions in the data and model performance statistics. We also provide a ModelCard data API to represent an instance of the JSON schema and visualize it as a Model Card. The Model Card creator can choose which metrics and graphs to display in the final Model Card, including metrics that highlight areas where the model’s performance might deviate from its overall performance.

Once the MCT has populated the Model Card with key metrics and graphs, the Model Card creator can supplement this with information regarding the model’s intended usage, limitations, trade-offs, and any other ethical considerations that would otherwise be unknown to people using the model. If a model underperforms for certain slices of data, the limitations section would be another place to acknowledge this, along with suggested mitigation strategies to help developers address these issues. This type of information is critical in helping developers decide whether or not a model is suitable for their use case, and helps Model Card creators provide context so that their models are used appropriately. Right now, we’re providing one UI template to visualize the Model Card, but you can create different templates in HTML should you want to visualize the information in other formats.

Currently, the MCT is available to anyone using TensorFlow Extended (TFX) in open source or on Google Cloud Platform. Users who are not serving their ML models via TFX can still leverage the JSON schema and the methods to visualize via the HTML template.

Here is an example of the completed Model Card from the Colab tutorial, which leverages the MCT and the provided UI template.

Conclusion
Currently, the MCT includes a standard template for reporting on ML models broadly, but we’re continuing to create UI templates for more specific applications of ML. If you’d like to join the conversation about what fields are important and how best to leverage the MCT for different use cases, you can get started here or with the Colab tutorial. Let us know how you’ve leveraged the MCT for your use case by emailing us at model-cards@google.com. You can learn more about Google’s efforts to promote responsible AI in the TensorFlow ecosystem on our TensorFlow Responsible AI page.

Acknowledgements
Huanming Fang, Hui Miao, Karan Shukla, Dan Nanas, Catherina Xu, Christina Greer, Tulsee Doshi, Tiffany Deng, Margaret Mitchell, Timnit Gebru, Andrew Zaldivar, Mahima Pushkarna, Meena Natarajan, Roy Kim, Parker Barnes, Tom Murray, Susanna Ricco, Lucy Vasserman, and Simone Wu

Read More

Translating documents, spreadsheets, and presentations in Office Open XML format using Amazon Translate

Translating documents, spreadsheets, and presentations in Office Open XML format using Amazon Translate

Now you can translate .docx, .xlsx, and .pptx documents using Amazon Translate.

Every organization creates documents, spreadsheets, and presentations to communicate and share information with a large group and keep records for posterity. These days, we interact with people who don’t share the same language as ours. The need for translating such documents has become even more critical in a globally interconnected world. Some large organizations hire a team of professional translators to help with document translation, which involves a lot of time and overhead cost. Multiple tools are available online that enable you to copy and paste text to get the translated equivalent in the language of your choice, but there are few secure and easy methods that allow for native support of translating such documents while keeping formatting intact.

Amazon Translate now supports translation of Office Open XML documents in DOCX, PPTX, and XLSX format. Amazon Translate is a fully managed neural machine translation service that delivers high-quality and affordable language translation in 55 languages. For the full list of languages, see Supported Languages and Language Codes. The document translation feature is available wherever batch translation is available. For more information, see Asynchronous Batch Processing.

In this post, we walk you through a step-by-step process to translate documents on the AWS Management Console. You can also access the Amazon Translate BatchTranslation API for document translation via the AWS Command Line Interface (AWS CLI) or the AWS SDK.

Solution overview

This post walks you through the following steps:

  1. Create an AWS Identity and Access Management (IAM) role that can access your Amazon Simple Storage Service (Amazon S3) buckets.
  2. Sort your documents by file type and language.
  3. Perform the batch translation.

Creating an IAM role to access your S3 buckets

In this post, we create a role that has access to all the S3 buckets in your account to translate documents, spreadsheets, and presentations. You provide this role to Amazon Translate to let the service access your input and output S3 locations. For more information, see AWS Identity and Access Management Documentation.

  1. Sign in to your personal AWS account.
  2. On the IAM console, under Access management, choose Roles.
  3. Choose Create role.
  4. Choose Another AWS account.
  5. For Account ID, enter your ID.
  6. Go to the next page.
  7. For Filter policies, search and add the AmazonS3FullAccess policy.
  8. Go to the next page.
  9. Enter a name for the role, for example, TranslateBatchAPI.
  10. Go to the role you just created.
  11. On the Trust relationships tab, choose Edit trust relationship.
  12. Enter the following service principals:
    "Service": [
    "translate.aws.internal",
    "translate.amazonaws.com"
    ],

    For example, see the following screenshot.

Sorting your documents

Amazon Translate batch translation works on documents stored in a folder inside an S3 bucket. Batch translation doesn’t work if the file is saved in the root of the S3 bucket. Batch translation also doesn’t support translation of nested files. So you first need to upload the documents you wish to translate in a folder inside an S3 bucket. Sort the documents such that the folders contain files of the same type (DOCX, PPTX, XLSX) and are in the same language. If you have multiple documents of different file types that you need to translate, sort the files such that each Amazon S3 prefix has only one type of document format written in one language.

  1. On the Amazon S3 console, choose Create bucket.
  2. Walk through the steps to create your buckets.

For this post, we create two buckets: input-translate-bucket and output-translate-bucket.

The buckets contain the following folders for each file type:

  • docx
  • pptx
  • xlsx

Performing batch translation

To implement your batch translation, complete the following steps:

  1. On to the Amazon Translate console, choose Batch Translation.
  2. Choose Create job.

For this post, we walk you through translating documents in DOCX format.

  1. For Name, enter BatchTranslation.
  2. For Source language, choose En.
  3. For Target language, choose Es.
  4. For Input S3 location, enter s3://input-translate-bucket/docx/.
  5. For File format, choose docx.
  6. For Output S3 location, enter s3://output-translate-bucket/.
  7. For Access permissions, select Use an existing IAM role.
  8. For IAM role, enter TranslateBatchAPI.

Because this is an asynchronous translation, the translation begins after the machine resource for the translation is allocated. This can take up to 15 minutes. For more information about performing batch translation jobs, see Starting a Batch Translation Job.

The following screenshot shows the details of your BatchTranslation job.

When the translation is complete, you can find the output in a folder in your S3 bucket. See the following screenshot.

Conclusion

In this post, we discussed implementing asynchronous batch translation to translate documents in DOCX format. You can repeat the same procedure for spreadsheets and presentations. The translation is simple and you pay only for the number of characters (including spaces) you translate in each format. You can start translating office documents today in all Regions where batch translation is supported. If you’re new to Amazon Translate, try out the Free Tier, which offers 2 million characters per month for the first 12 months, starting from your first translation request.


About the Author

Watson G. Srivathsan is the Sr. Product Manager for Amazon Translate, AWS’s natural language processing service. On weekends you will find him exploring the outdoors in the Pacific Northwest.

Read More

Simplifying application onboarding with Amazon CodeGuru Profiler

Simplifying application onboarding with Amazon CodeGuru Profiler

Amazon CodeGuru Profiler provides recommendations to help you continuously fine-tune your application’s performance. It does this by collecting runtime performance data from your live applications. It looks for your most expensive lines of code continuously and provides intelligent recommendations. This helps you more easily understand your applications’ runtime behavior so you can optimize their performance, improve latency, and reduce infrastructure cost.

From a central dashboard, you get different visualizations of your profiling data and details to what CodeGuru Profiler recommends of your application’s performance profile. You also get a report with details on the impact of the issue on your application, what’s causing the issue, and a recommendation on what to change to resolve the issue.

In this post, I introduce you to two enhancements that make it even easier and faster for your applications to start using the machine learning (ML)-based capabilities of CodeGuru Profiler:

  • Resource-based authorizations – You can use resource-based permissions to authorize an identity in your code to upload the profiled data instead of manually configuring AWS Identity and Access Manager (IAM). If the role or user already exists in IAM, you simply select the role or user on the CodeGuru Profiler console.
  • Ability to start the profiler agent on the command line – You can now start the profiler agent on the command line using the -javaagent This means that you no longer need to recompile your application or set build dependencies; you simply download the latest JAR file and add the -javaagent switch to the command line and run. The whole process takes just minutes to complete.

What you can do with CodeGuru Profiler

CodeGuru Profiler is designed to run in your production environment with minimal CPU overhead to help improve your application’s performance and reduce infrastructure costs. With CodeGuru Profiler, you can:

  • Troubleshoot latency and CPU utilization issues in your application
  • Identify application performance issues
  • Identify cost optimization opportunities and where you can reduce the infrastructure costs of running your application

CodeGuru Profiler works with your applications that are hosted on Amazon Elastic Compute Cloud (Amazon EC2), serverless applications running on AWS Fargate and AWS Lambda, and containerized applications running on Amazon Elastic Container Service (Amazon ECS) and Amazon Elastic Kubernetes Service (Amazon EKS). CodeGuru Profiler also works on-premises. It currently supports applications written in all Java virtual machine (JVM) languages, such as Java, Kotlin, and Scala.

Profiling groups

In CodeGuru Profiler, a profiling group is a set of applications that are profiled together as a single unit. The profiling agent sends application data to a single profiling group, where data from all applications in the profiling group are aggregated and analyzed. Your groups are managed on the Profiling groups page on the CodeGuru console. You can see a list of all your profiling groups, their status, or create or delete profiling groups. For more information, see Setting up Amazon CodeGuru Profiler.

A profiling group can profile a single application running on multiple hosts. It can also profile different but related applications. You can profile an application, regardless of what repository the code is in.

Resource-based authorization enabled

The improvements made to application onboarding remove many manual steps, enable resource-based authorization, and remove the need to configure IAM permissions each time you add a new application for profiling. This new setup option helps reduce configuration errors and enables quick onboarding of your application into the profiling group.

In this section, we show you how to grant the required permissions on the CodeGuru Profiler console. The first time you onboard your application, your admin needs to create the IAM role or user that can submit profiling data and configure the agent. That way, the roles and users can appear in the permissions drop-down on the CodeGuru Profiler console. After this setup is complete, you don’t need to go on the IAM console to set permissions.

Creating a profiling group with resource-based authorization

To create a profiling group with resource-based authorization enabled, complete the following steps:

  1. On the CodeGuru Profiler console, choose Create profiling group.


  1. For Name, enter test-group.
  2. Choose Create.

We can now show you the resource-based authorization enhancement in action. Prior to the recent enhancement, you needed to set up access credentials to give an application permission to submit data to your account. You can now do this in a few clicks on the Profiling groups page.

  1. In the Set permissions section, choose Give access to users and roles.
  2. For Application permissions, choose the IAM users and roles that you want to give permissions to so they can submit data to CodeGuru Profiler.
  3. Choose Save.

That’s it! You have set permissions for users and roles in your profiling group.

Starting the profiler agent without modifying your application’s code

Next, we walk you through a use case to demonstrate how easy and quick it is to start the profiler agent without modifying the application code.

Prerequisites

To complete this part of the post, you need the following:

  • AWS account
  • Laptop or desktop computer with internet access
  • Terminal emulator of your choice
  • Corretto 8 or JDK version 8 or later installed on your EC2 instance
  • Maven installed on your EC2 instance

You no longer need to modify your application code or add dependencies to run the agent. The benefit to starting the agent with the -javaagent parameter is that you can profile existing applications without recompiling or changing your application’s code. You can still use the previous approach to start the profiling agent. For example, this approach is applicable as the only option to use for Lambda and Spark jobs.

To onboard your application, you complete the following steps:

  1. Create your profiling group and set an environment variable for your Region.
  2. Download the latest Java JAR file from the CodeGuru Profiler console.
  3. Restart your JVM by running the -javaagent parameter

This post has some additional steps because we also set up the demo application to start profiling and onboard two different profiler groups: DemoApplication-WithIssues and DemoApplicationWithoutIssues.

Cloning the demo application

To clone the demo application to your EC2 instance, enter the following code:

git clone  https://github.com/aws-samples/aws-codeguru-profiler-demo-application
cd aws-codeguru-profiler-demo-application 

After you change directories to aws-codeguru-profiler-demo-application, you should see the pom.xml file.

Creating a profiling group

At the command line, enter the following commands, starting with the steps that you always need to perform to onboard the profiler (with aws configure, set up your AWS credentials and default Region, which are the same credentials you created the resource policies for):

aws codeguruprofiler create-profiling-group --profiling-group-name DemoApplication-WithIssues
aws codeguruprofiler create-profiling-group --profiling-group-name DemoApplication-WithoutIssues

Setting up the demo application

To complete the project, you create an Amazon Simple Storage Service (Amazon S3) bucket and an Amazon Simple Queue Service (Amazon SQS) queue. Creating an S3 bucket and SQS queue aren’t part of the onboarding process; you use these services for business logic. The SQS queue is polled for names of images to process and the images get loaded into an S3 bucket, does some image transformation, and then the results back to the S3 bucket.

To create these resources, enter the following code:

aws s3 mb s3://demo-application-test-bucket-YOUR BUCKET NAME
aws sqs create-queue --queue-name DemoApplicationQueue

For this post, replace YOUR BUCKET NAME with a random set of numbers. This helps make sure that your bucket contains a globally unique name.

Next, we set the environment variables by using the following commands. These steps are necessary for this particular application and not related to onboarding the profiler. Also, don’t forget to use your test-bucket name. Replace the referenced Amazon SQS URL with your Amazon SQS URL, which you can find on the Details tab for the queue on the Amazon SQS console.

export DEMO_APP_BUCKET_NAME="demo-application-test-bucket-10245"
export DEMO_APP_SQS_URL="https://sqs.us-east-1.amazonaws.com/12345678/DemoApplicationQueue"
export AWS_CODEGURU_TARGET_REGION=REPLACE WITH YOUR-AWS-REGION

Downloading the Java agent JAR file

First, set the environment variable:

export AWS_CODEGURU_PROFILER_GROUP_NAME=DemoApplication-WithIssues

To create a JAR file in the target directory, enter the following code:

mvn clean install

The process can take up to 1 minute to complete.

For this post, you don’t need to download the CodeGuru Profiler Java agent JAR file. It’s included with the demo application that you downloaded from GitHub. However, when you onboard your application for profiling, you need to download the JAR file from the CodeGuru Profiler console. See the following screenshot.

Running the demo application

Next, you restart your JVM by running the -javaagent switch. Make sure that the application file name is included in the command. When you run this project, the JAR file version may have been updated from the version you see in the following code:

java -javaagent:codeguru-profiler-java-agent-standalone-1.0.0.jar 
-jar target/DemoApplication-1.0-jar-with-dependencies.jar with-issues

The profiling group setup is successful when you see the following message:

INFO: Profiling scheduled, sampling rate is PT1S

You will see messages running on the screen for several minutes. You have the option to enter exit, enter on your keyboard. If you do that, reconnect back into your EC2 instance through SSH to verify that the application is still running in the background, using the following command:

ps -ef |grep javaagent

Checking the CodeGuru console for the profiling group

To verify that your application is profiling, return to the CodeGuru console. You should see the profiling group go from Inactive to Pending status, and then end in Profiling status.

When your profiling group shows the status Profiling, you can visualize the application’s runtime data. It takes about 5 minutes for the CodeGuru Profiling agent to submit code review data. After about 10 more minutes, you can see the flame graph visualizations. Within 1 hour, you have your first recommendation report.

If you want to run this project again, without issues, repeat the previous steps with the following changes:

  • Set the export variables per your setup. As we discussed earlier when running the demo app WithIssues, these environment variables are specific to running the demo app and not part of the profiler onboarding.
    export DEMO_APP_SQS_URL=https://sqs.YOUR-AWS-REGION.queue.amazonaws.com/YOUR-ACCOUNT-ID/DemoApplicationQueue
    export DEMO_APP_BUCKET_NAME=demo-application-test-bucket-1092734-YOUR-BUCKET-NAME
    export AWS_CODEGURU_TARGET_REGION=YOUR-AWS-REGION
    

  • Run the demo application with the following code:
    export AWS_CODEGURU_PROFILER_GROUP_NAME=DemoApplication-WithoutIssues
    mvn clean install ## This command will generate the DemoApplication-1.0-jar-with-dependencies.jar
    java -javaagent:codeguru-profiler-java-agent-standalone-1.0.0.jar 
      -jar target/DemoApplication-1.0-jar-with-dependencies.jar without-issues

For more information about visualizations in CodeGuru Profiler, see the section Understanding CodeGuru Profiler’s visualizations in Optimizing application performance with Amazon CodeGuru Profiler.

Cleaning up

To avoid incurring any future charges, delete the resources you created with this project:

  • Profiling group DemoApplication-WithIssues
  • SQS queue and the S3 bucket
  • EC2 instance

Conclusion

We’re excited to help you make it even quicker and easier to onboard your applications using CodeGuru Profiler. In this post, we reviewed and learned how to use two recent enhancements to CodeGuru Profiler: resource-based permission setting and starting the profiler agent using the -javaagent switch, without needing to modify your application’s code.

CodeGuru Profiler is part of Amazon CodeGuru (Preview), an ML-based service that performs automated code reviews and application performance recommendations. It finds issues in your code and deviations from performance engineering best practices using AWS APIs, SDKs, and a variety of libraries to make specific recommendations to remediate identified issues. CodeGuru is powered by ML capabilities, best practices, and lessons learned from millions of code reviews and thousands of applications profiled on both open-source projects and internally at Amazon.

We hope that you find that using these feature enhancements is straightforward, quick, and easy. Let us know your progress on our GitHub project page!


About the Author

Charles Gibson is an Enterprise Transformation Architect in Professional Services at Amazon Web Services. He helps customers migrate and modernize their businesses on the AWS Cloud. Charles enjoys cooking Northern Italian food for friends and family.


Read More

TensorFlow 2 MLPerf submissions demonstrate best-in-class performance on Google Cloud

TensorFlow 2 MLPerf submissions demonstrate best-in-class performance on Google Cloud

Posted by Pankaj Kanwar, Peter Brandt, and Zongwei Zhou from the TensorFlow Team

MLPerf, the industry standard for measuring machine learning performance, has released the latest benchmark results from the MLPerf Training v0.7 round. We’re happy to share that Google’s submissions demonstrate leading top-line performance (fastest time to reach target quality), with the ability to scale up to 4,000+ accelerators and the flexibility of the TensorFlow 2 developer experience on Google Cloud.

In this blog post, we’ll explore the TensorFlow 2 MLPerf submissions, which showcase how enterprises can run valuable workloads that MLPerf represents on cutting-edge ML accelerators in Google Cloud, including widely deployed generations of GPUs and Cloud TPUs. Our accompanying blog post highlights our record-setting large-scale training results.

TensorFlow 2: designed for performance and usability

At the TensorFlow Developer Summit earlier this year, we highlighted that TensorFlow 2 would emphasize usability and real-world performance. When competing to win benchmarks, engineers have often relied on low-level API calls and hardware-specific code that may not be practical in everyday enterprise settings. With TensorFlow 2, we aim to provide high performance out of the box with more straightforward code, avoiding the significant issues that low-level optimizations can cause with respect to code reusability, code health, and engineering productivity.

Time to converge (in minutes) using Google Cloud VMs with 8 NVIDIA V100 GPUs from Google’s MLPerf Training v0.7 Closed submission in the “Available” category.

TensorFlow’s Keras APIs (see this collection of guides) offer usability and portability across a wide array of hardware architectures. For example, model developers can use the Keras mixed precision API and Distribution Strategy API to enable the same codebase to run on multiple hardware platforms with minimal friction. Google’s MLPerf submissions in the Available-in-Cloud category were implemented using these APIs. These submissions demonstrate that near-identical TensorFlow code written using high level Keras APIs can deliver high performance across the two leading widely-available ML accelerator platforms in the industry: NVIDIA’s V100 GPUs and Google’s Cloud TPU v3 Pods.

Note: All results shown in the charts are retrieved from www.mlperf.org on July 29, 2020. MLPerf name and logo are trademarks. See www.mlperf.org for more information. Results shown: 0.7-1 and 0.7-2.

Time to convergence (in minutes) using Google Cloud TPU v3 Pod slices containing 16 TPU chips from Google’s MLPerf Training v0.7 Closed submission in the “Available” category.

Looking under the hood: performance enhancements with XLA

Google’s submissions on GPUs and on Cloud TPU Pods leverage the XLA compiler to optimize TensorFlow performance. XLA is a core part of the TPU compiler stack, and it can optionally be enabled for GPU. XLA is a graph-based just-in-time compiler that performs a variety of different types of whole-program optimizations, including extensive fusion of ML operations.

Operator fusion reduces the memory capacity and bandwidth requirements for ML models. Furthermore, fusion reduces the launch overhead of operations, particularly on GPUs. Overall, XLA optimizations are general, portable, interoperate well with cuDNN and cuBLAS libraries, and can often provide a compelling alternative to writing low-level kernels by hand.

Google’s TensorFlow 2 submissions in the Available-in-Cloud category use the @tf.function API introduced in TensorFlow 2.0. The @tf.function API offers a simple way to enable XLA selectively, providing fine-grained control over exactly which functions will be compiled.

The performance improvements delivered by XLA are impressive: on a Google Cloud VM with 8 Volta V100 GPUs attached (each with 16 GB of GPU memory), XLA boosts BERT training throughput from 23.1 sequences per second to 168 sequences per second, a ~7x improvement. XLA also increases the runnable batch size per GPU by 5X. Reduced memory usage by XLA also enables advanced training techniques such as gradient accumulation.

Impact of enabling XLA (in minutes) on the BERT model using 8 V100 GPUs on Google Cloud as demonstrated by Google’s MLPerf Training 0.7 Closed submission compared to unverified MLPerf results on the same system with optimization(s) disabled.

State-of-the-art accelerators on Google Cloud

Google Cloud is the only public-cloud platform that provides access to both state-of-the-art GPUs and Cloud TPUs, which allows AI researchers and data scientists the freedom to choose the right hardware for every task.

Cutting-edge models such as BERT, which are extensively used within Google and industry-wide for a variety of natural language processing tasks, can now be trained on Google Cloud leveraging the same infrastructure that is used for training internal workloads within Google. Using Google Cloud, you can train BERT for 3 million sequences on a Cloud TPU v3 Pod slice with 16 TPU chips in under an hour at a total cost of under $32.

Conclusion

Google’s MLPerf 0.7 Training submissions showcase the performance, usability, and portability of TensorFlow 2 across state-of-the-art ML accelerator hardware. Get started today with the usability and power of TensorFlow 2 on Google Cloud GPUs, Google Cloud TPUs, and TensorFlow Enterprise with Google Cloud Deep Learning VMs.

Acknowledgements

The MLPerf submission on GPUs is the result of a close collaboration with NVIDIA. We’d like to thank all engineers at NVIDIA who helped us with this submission.
Read More