An optimized solution for face recognition

The human brain seems to care a lot about faces. It’s dedicated a specific area to identifying them, and the neurons there are so good at their job that most of us can readily recognize thousands of individuals. With artificial intelligence, computers can now recognize faces with a similar efficiency — and neuroscientists at MIT’s McGovern Institute for Brain Research have found that a computational network trained to identify faces and other objects discovers a surprisingly brain-like strategy to sort them all out.

The finding, reported March 16 in Science Advances, suggests that the millions of years of evolution that have shaped circuits in the human brain have optimized our system for facial recognition.

“The human brain’s solution is to segregate the processing of faces from the processing of objects,” explains Katharina Dobs, who led the study as a postdoc in the lab of McGovern investigator Nancy Kanwisher, the Walter A. Rosenblith Professor of Cognitive Neuroscience at MIT. The artificial network that she trained did the same. “And that’s the same solution that we hypothesize any system that’s trained to recognize faces and to categorize objects would find,” she adds.

“These two completely different systems have figured out what a — if not the — good solution is. And that feels very profound,” says Kanwisher.

Functionally specific brain regions

More than 20 years ago, Kanwisher and her colleagues discovered a small spot in the brain’s temporal lobe that responds specifically to faces. This region, which they named the fusiform face area, is one of many brain regions Kanwisher and others have found that are dedicated to specific tasks, such as the detection of written words, the perception of vocal songs, and understanding language.

Kanwisher says that as she has explored how the human brain is organized, she has always been curious about the reasons for that organization. Does the brain really need special machinery for facial recognition and other functions? “‘Why questions’ are very difficult in science,” she says. But with a sophisticated type of machine learning called a deep neural network, her team could at least find out how a different system would handle a similar task.

Dobs, who is now a research group leader at Justus Liebig University Giessen in Germany, assembled hundreds of thousands of images with which to train a deep neural network in face and object recognition. The collection included the faces of more than 1,700 different people and hundreds of different kinds of objects, from chairs to cheeseburgers. All of these were presented to the network, with no clues about which was which. “We never told the system that some of those are faces, and some of those are objects. So it’s basically just one big task,” Dobs says. “It needs to recognize a face identity, as well as a bike or a pen.”

As the program learned to identify the objects and faces, it organized itself into an information-processing network with that included units specifically dedicated to face recognition. Like the brain, this specialization occurred during the later stages of image processing. In both the brain and the artificial network, early steps in facial recognition involve more general vision processing machinery, and final stages rely on face-dedicated components.

It’s not known how face-processing machinery arises in a developing brain, but based on their findings, Kanwisher and Dobs say networks don’t necessarily require an innate face-processing mechanism to acquire that specialization. “We didn’t build anything face-ish into our network,” Kanwisher says. “The networks managed to segregate themselves without being given a face-specific nudge.”

Kanwisher says it was thrilling seeing the deep neural network segregate itself into separate parts for face and object recognition. “That’s what we’ve been looking at in the brain for 20-some years,” she says. “Why do we have a separate system for face recognition in the brain? This tells me it is because that is what an optimized solution looks like.”

Now, she is eager to use deep neural nets to ask similar questions about why other brain functions are organized the way they are. “We have a new way to ask why the brain is organized the way it is,” she says. “How much of the structure we see in human brains will arise spontaneously by training networks to do comparable tasks?”

Read More

Efficiently Initializing Reinforcement Learning With Prior Policies

Reinforcement learning (RL) can be used to train a policy to perform a task via trial and error, but a major challenge in RL is learning policies from scratch in environments with hard exploration challenges. For example, consider the setting depicted in the door-binary-v0 environment from the adroit manipulation suite, where an RL agent must control a hand in 3D space to open a door placed in front of it.

An RL agent must control a hand in 3D space to open a door placed in front of it. The agent receives a reward signal only when the door is completely open.

Since the agent receives no intermediary rewards, it cannot measure how close it is to completing the task, and so must explore the space randomly until it eventually opens the door. Given how long the task takes and the precise control required, this is extremely unlikely.

For tasks like this, we can avoid exploring the state space randomly by using prior information. This prior information helps the agent understand which states of the environment are good, and should be further explored. We could use offline data (i.e., data collected by human demonstrators, scripted policies, or other RL agents) to train a policy, then use it to initialize a new RL policy. In the case where we use neural networks to represent the policies, this would involve copying the pre-trained policy’s neural network over to the new RL policy. This procedure makes the new RL policy behave like the pre-trained policy. However, naïvely initializing a new RL policy like this often works poorly, especially for value-based RL methods, as shown below.

A policy is pre-trained on the antmaze-large-diverse-v0 D4RL environment with offline data (negative steps correspond to pre-training). We then use the policy to initialize actor-critic fine-tuning (positive steps starting from step 0) with this pre-trained policy as the initial actor. The critic is initialized randomly. The actor’s performance immediately drops and does not recover, as the untrained critic provides a poor learning signal and causes the good initial policy to be forgotten.

With the above in mind, in “Jump-Start Reinforcement Learning” (JSRL), we introduce a meta-algorithm that can use a pre-existing policy of any form to initialize any type of RL algorithm. JSRL uses two policies to learn tasks: a guide-policy, and an exploration-policy. The exploration-policy is an RL policy that is trained online with new experience that the agent collects from the environment, and the guide-policy is a pre-existing policy of any form that is not updated during online training. In this work, we focus on scenarios where the guide-policy is learned from demonstrations, but many other kinds of guide-policies can be used. JSRL creates a learning curriculum by rolling in the guide-policy, which is then followed by the self-improving exploration-policy, resulting in performance that compares to or improves on competitive IL+RL methods.

The JSRL Approach
The guide-policy can take any form: it could be a scripted policy, a policy trained with RL, or even a live human demonstrator. The only requirements are that the guide-policy is reasonable (i.e., better than random exploration), and it can select actions based on observations of the environment. Ideally, the guide-policy can reach poor or medium performance in the environment, but cannot further improve itself with additional fine-tuning. JSRL then allows us to leverage the progress of this guide-policy to take the performance even higher.

At the beginning of training, we roll out the guide-policy for a fixed number of steps so that the agent is closer to goal states. The exploration-policy then takes over and continues acting in the environment to reach these goals. As the performance of the exploration-policy improves, we gradually reduce the number of steps that the guide-policy takes, until the exploration-policy takes over completely. This process creates a curriculum of starting states for the exploration-policy such that in each curriculum stage, it only needs to learn to reach the initial states of prior curriculum stages.

Here, the task is for the robot arm to pick up the blue block. The guide-policy can move the arm to the block, but it cannot pick it up. It controls the agent until it grips the block, then the exploration-policy takes over, eventually learning to pick up the block. As the exploration-policy improves, the guide-policy controls the agent less and less.

Comparison to IL+RL Baselines
Since JSRL can use a prior policy to initialize RL, a natural comparison would be to imitation and reinforcement learning (IL+RL) methods that train on offline datasets, then fine-tune the pre-trained policies with new online experience. We show how JSRL compares to competitive IL+RL methods on the D4RL benchmark tasks. These tasks include simulated robotic control environments, along with datasets of offline data from human demonstrators, planners, and other learned policies. Out of the D4RL tasks, we focus on the difficult ant maze and adroit dexterous manipulation environments.

Example ant maze (left) and adroit dexterous manipulation (right) environments.

For each experiment, we train on an offline dataset and then run online fine-tuning. We compare against algorithms designed specifically for each setting, which include AWAC, IQL, CQL, and behavioral cloning. While JSRL can be used in combination with any initial guide-policy or fine-tuning algorithm, we use our strongest baseline, IQL, as a pre-trained guide and for fine-tuning. The full D4RL dataset includes one million offline transitions for each ant maze task. Each transition is a sequence of format (S, A, R, S’) which specifies what state the agent started in (S), the action the agent took (A), the reward the agent received (R), and the state the agent ended up in (S’) after taking action A. We find that JSRL performs well with as few as ten thousand offline transitions.

Average score (max=100) on the antmaze-medium-diverse-v0 environment from the D4RL benchmark suite. JSRL can improve even with limited access to offline transitions.

Vision-Based Robotic Tasks
Utilizing offline data is especially challenging in complex tasks such as vision-based robotic manipulation due to the curse of dimensionality. The high dimensionality of both the continuous-control action space and the pixel-based state space present scaling challenges for IL+RL methods in terms of the amount of data required to learn good policies. To study how JSRL scales to such settings, we focus on two difficult simulated robotic manipulation tasks: indiscriminate grasping (i.e., lifting any object) and instance grasping (i.e., lifting a specific target object).

A simulated robot arm is placed in front of a table with various categories of objects. When the robot lifts any object, a sparse reward is given for the indiscriminate grasping task. For the instance grasping task, a sparse reward is only given when a specific target object is grasped.

We compare JSRL against methods that are able to scale to complex vision-based robotics settings, such as QT-Opt and AW-Opt. Each method has access to the same offline dataset of successful demonstrations and is allowed to run online fine-tuning for up to 100,000 steps.

In these experiments, we use behavioral cloning as a guide-policy and combine JSRL with QT-Opt for fine-tuning. The combination of QT-Opt+JSRL improves faster than all other methods while achieving the highest success rate.

Mean grasping success for indiscriminate and instance grasping environments using 2k successful demonstrations.

Conclusion
We proposed JSRL, a method for leveraging a prior policy of any form to improve exploration for initializing RL tasks. Our algorithm creates a learning curriculum by rolling in a pre-existing guide-policy, which is then followed by the self-improving exploration-policy. The job of the exploration-policy is greatly simplified since it starts exploring from states closer to the goal. As the exploration-policy improves, the effect of the guide-policy diminishes, leading to a fully capable RL policy. In the future, we plan to apply JSRL to problems such as Sim2Real, and explore how we can leverage multiple guide-policies to train RL agents.

Acknowledgements
This work would not have been possible without Ikechukwu Uchendu, Ted Xiao, Yao Lu, Banghua Zhu, Mengyuan Yan, Joséphine Simon, Matthew Bennice, Chuyuan Fu, Cong Ma, Jiantao Jiao, Sergey Levine, and Karol Hausman. Special thanks to Tom Small for creating the animations for this post.

Read More

DALL·E 2

DALL·E 2 is a new AI system that can create realistic images and art from a description in natural language.OpenAI

Does this artificial intelligence think like a human?

In machine learning, understanding why a model makes certain decisions is often just as important as whether those decisions are correct. For instance, a machine-learning model might correctly predict that a skin lesion is cancerous, but it could have done so using an unrelated blip on a clinical photo.

While tools exist to help experts make sense of a model’s reasoning, often these methods only provide insights on one decision at a time, and each must be manually evaluated. Models are commonly trained using millions of data inputs, making it almost impossible for a human to evaluate enough decisions to identify patterns.

Now, researchers at MIT and IBM Research have created a method that enables a user to aggregate, sort, and rank these individual explanations to rapidly analyze a machine-learning model’s behavior. Their technique, called Shared Interest, incorporates quantifiable metrics that compare how well a model’s reasoning matches that of a human.

Shared Interest could help a user easily uncover concerning trends in a model’s decision-making — for example, perhaps the model often becomes confused by distracting, irrelevant features, like background objects in photos. Aggregating these insights could help the user quickly and quantitatively determine whether a model is trustworthy and ready to be deployed in a real-world situation.

“In developing Shared Interest, our goal is to be able to scale up this analysis process so that you could understand on a more global level what your model’s behavior is,” says lead author Angie Boggust, a graduate student in the Visualization Group of the Computer Science and Artificial Intelligence Laboratory (CSAIL).

Boggust wrote the paper with her advisor, Arvind Satyanarayan, an assistant professor of computer science who leads the Visualization Group, as well as Benjamin Hoover and senior author Hendrik Strobelt, both of IBM Research. The paper will be presented at the Conference on Human Factors in Computing Systems.

Boggust began working on this project during a summer internship at IBM, under the mentorship of Strobelt. After returning to MIT, Boggust and Satyanarayan expanded on the project and continued the collaboration with Strobelt and Hoover, who helped deploy the case studies that show how the technique could be used in practice.

Human-AI alignment

Shared Interest leverages popular techniques that show how a machine-learning model made a specific decision, known as saliency methods. If the model is classifying images, saliency methods highlight areas of an image that are important to the model when it made its decision. These areas are visualized as a type of heatmap, called a saliency map, that is often overlaid on the original image. If the model classified the image as a dog, and the dog’s head is highlighted, that means those pixels were important to the model when it decided the image contains a dog.

Shared Interest works by comparing saliency methods to ground-truth data. In an image dataset, ground-truth data are typically human-generated annotations that surround the relevant parts of each image. In the previous example, the box would surround the entire dog in the photo. When evaluating an image classification model, Shared Interest compares the model-generated saliency data and the human-generated ground-truth data for the same image to see how well they align.

The technique uses several metrics to quantify that alignment (or misalignment) and then sorts a particular decision into one of eight categories. The categories run the gamut from perfectly human-aligned (the model makes a correct prediction and the highlighted area in the saliency map is identical to the human-generated box) to completely distracted (the model makes an incorrect prediction and does not use any image features found in the human-generated box).

“On one end of the spectrum, your model made the decision for the exact same reason a human did, and on the other end of the spectrum, your model and the human are making this decision for totally different reasons. By quantifying that for all the images in your dataset, you can use that quantification to sort through them,” Boggust explains.

The technique works similarly with text-based data, where key words are highlighted instead of image regions.

Rapid analysis

The researchers used three case studies to show how Shared Interest could be useful to both nonexperts and machine-learning researchers.

In the first case study, they used Shared Interest to help a dermatologist determine if he should trust a machine-learning model designed to help diagnose cancer from photos of skin lesions. Shared Interest enabled the dermatologist to quickly see examples of the model’s correct and incorrect predictions. Ultimately, the dermatologist decided he could not trust the model because it made too many predictions based on image artifacts, rather than actual lesions.

“The value here is that using Shared Interest, we are able to see these patterns emerge in our model’s behavior. In about half an hour, the dermatologist was able to make a confident decision of whether or not to trust the model and whether or not to deploy it,” Boggust says.

In the second case study, they worked with a machine-learning researcher to show how Shared Interest can evaluate a particular saliency method by revealing previously unknown pitfalls in the model. Their technique enabled the researcher to analyze thousands of correct and incorrect decisions in a fraction of the time required by typical manual methods.

In the third case study, they used Shared Interest to dive deeper into a specific image classification example. By manipulating the ground-truth area of the image, they were able to conduct a what-if analysis to see which image features were most important for particular predictions.   

The researchers were impressed by how well Shared Interest performed in these case studies, but Boggust cautions that the technique is only as good as the saliency methods it is based upon. If those techniques contain bias or are inaccurate, then Shared Interest will inherit those limitations.

In the future, the researchers want to apply Shared Interest to different types of data, particularly tabular data which is used in medical records. They also want to use Shared Interest to help improve current saliency techniques. Boggust hopes this research inspires more work that seeks to quantify machine-learning model behavior in ways that make sense to humans.

This work is funded, in part, by the MIT-IBM Watson AI Lab, the United States Air Force Research Laboratory, and the United States Air Force Artificial Intelligence Accelerator.

Read More

Robots dress humans without the full picture

Robots are already adept at certain things, such as lifting objects that are too heavy or cumbersome for people to manage. Another application they’re well suited for is the precision assembly of items like watches that have large numbers of tiny parts — some so small they can barely be seen with the naked eye.

“Much harder are tasks that require situational awareness, involving almost instantaneous adaptations to changing circumstances in the environment,” explains Theodoros Stouraitis, a visiting scientist in the Interactive Robotics Group at MIT’s Computer Science and Artificial Intelligence Laboratory (CSAIL).

“Things become even more complicated when a robot has to interact with a human and work together to safely and successfully complete a task,” adds Shen Li, a PhD candidate in the MIT Department of Aeronautics and Astronautics.

Li and Stouraitis — along with Michael Gienger of the Honda Research Institute Europe, Professor Sethu Vijayakumar of the University of Edinburgh, and Professor Julie A. Shah of MIT, who directs the Interactive Robotics Group — have selected a problem that offers, quite literally, an armful of challenges: designing a robot that can help people get dressed. Last year, Li and Shah and two other MIT researchers completed a project involving robot-assisted dressing without sleeves. In a new work, described in a paper that appears in an April 2022 issue of IEEE Robotics and Automation, Li, Stouraitis, Gienger, Vijayakumar, and Shah explain the headway they’ve made on a more demanding problem — robot-assisted dressing with sleeved clothes. 

The big difference in the latter case is due to “visual occlusion,” Li says. “The robot cannot see the human arm during the entire dressing process.” In particular, it cannot always see the elbow or determine its precise position or bearing. That, in turn, affects the amount of force the robot has to apply to pull the article of clothing — such as a long-sleeve shirt — from the hand to the shoulder.

To deal with the issue of obstructed vision, the team has developed a “state estimation algorithm” that allows them to make reasonably precise educated guesses as to where, at any given moment, the elbow is and how the arm is inclined — whether it is extended straight out or bent at the elbow, pointing upwards, downwards, or sideways — even when it’s completely obscured by clothing. At each instance of time, the algorithm takes the robot’s measurement of the force applied to the cloth as input and then estimates the elbow’s position — not exactly, but placing it within a box or volume that encompasses all possible positions. 

That knowledge, in turn, tells the robot how to move, Stouraitis says. “If the arm is straight, then the robot will follow a straight line; if the arm is bent, the robot will have to curve around the elbow.” Getting a reliable picture is important, he adds. “If the elbow estimation is wrong, the robot could decide on a motion that would create an excessive, and unsafe, force.” 

The algorithm includes a dynamic model that predicts how the arm will move in the future, and each prediction is corrected by a measurement of the force that’s being exerted on the cloth at a particular time. While other researchers have made state estimation predictions of this sort, what distinguishes this new work is that the MIT investigators and their partners can set a clear upper limit on the uncertainty and guarantee that the elbow will be somewhere within a prescribed box.   

The model for predicting arm movements and elbow position and the model for measuring the force applied by the robot both incorporate machine learning techniques. The data used to train the machine learning systems were obtained from people wearing “Xsens” suits with built-sensors that accurately track and record body movements. After the robot was trained, it was able to infer the elbow pose when putting a jacket on a human subject, a man who moved his arm in various ways during the procedure — sometimes in response to the robot’s tugging on the jacket and sometimes engaging in random motions of his own accord.

This work was strictly focused on estimation — determining the location of the elbow and the arm pose as accurately as possible — but Shah’s team has already moved on to the next phase: developing a robot that can continually adjust its movements in response to shifts in the arm and elbow orientation. 

In the future, they plan to address the issue of “personalization” — developing a robot that can account for the idiosyncratic ways in which different people move. In a similar vein, they envision robots versatile enough to work with a diverse range of cloth materials, each of which may respond somewhat differently to pulling.

Although the researchers in this group are definitely interested in robot-assisted dressing, they recognize the technology’s potential for far broader utility. “We didn’t specialize this algorithm in any way to make it work only for robot dressing,” Li notes. “Our algorithm solves the general state estimation problem and could therefore lend itself to many possible applications. The key to it all is having the ability to guess, or anticipate, the unobservable state.” Such an algorithm could, for instance, guide a robot to recognize the intentions of its human partner as it works collaboratively to move blocks around in an orderly manner or set a dinner table. 

Here’s a conceivable scenario for the not-too-distant future: A robot could set the table for dinner and maybe even clear up the blocks your child left on the dining room floor, stacking them neatly in the corner of the room. It could then help you get your dinner jacket on to make yourself more presentable before the meal. It might even carry the platters to the table and serve appropriate portions to the diners. One thing the robot would not do would be to eat up all the food before you and others make it to the table.  Fortunately, that’s one “app” — as in application rather than appetite — that is not on the drawing board.

This research was supported by the U.S. Office of Naval Research, the Alan Turing Institute, and the Honda Research Institute Europe.

Read More

Reproducibility in Deep Learning and Smooth Activations

Ever queried a recommender system and found that the same search only a few moments later or on a different device yields very different results? This is not uncommon and can be frustrating if a person is looking for something specific. As a designer of such a system, it is also not uncommon for the metrics measured to change from design and testing to deployment, bringing into question the utility of the experimental testing phase. Some level of such irreproducibility can be expected as the world changes and new models are deployed. However, this also happens regularly as requests hit duplicates of the same model or models are being refreshed.

Lack of replicability, where researchers are unable to reproduce published results with a given model, has been identified as a challenge in the field of machine learning (ML). Irreproducibility is a related but more elusive problem, where multiple instances of a given model are trained on the same data under identical training conditions, but yield different results. Only recently has irreproducibility been identified as a difficult problem, but due to its complexity, theoretical studies to understand this problem are extremely rare.

In practice, deep network models are trained in highly parallelized and distributed environments. Nondeterminism in training from random initialization, parallelism, distributed training, data shuffling, quantization errors, hardware types, and more, combined with objectives with multiple local optima contribute to the problem of irreproducibility. Some of these factors, such as initialization, can be controlled, but it is impractical to control others. Optimization trajectories can diverge early in training by following training examples in the order seen, leading to very different models. Several recently published solutions [1, 2, 3] based on advanced combinations of ensembling, self-ensembling, and distillation can mitigate the problem, but usually at the cost of accuracy and increased complexity, maintenance and improvement costs.

In “Real World Large Scale Recommendation Systems Reproducibility and Smooth Activations”, we consider a different practical solution to this problem that does not incur the costs of other solutions, while still improving reproducibility and yielding higher model accuracy. We discover that the Rectified Linear Unit (ReLU), which is very popular as the nonlinearity function (i.e., activation function) used to transform values in neural networks, exacerbates the irreproducibility problem. On the other hand, we demonstrate that smooth activation functions, which have derivatives that are continuous for the whole domain, unlike those of ReLU, are able to substantially reduce irreproducibility levels. We then propose the Smooth reLU (SmeLU) activation function, which gives comparable reproducibility and accuracy benefits to other smooth activations but is much simpler.

The ReLU function (left) as function of the input signal, and its gradient (right) as function of the input.

Smooth Activations
An ML model attempts to learn the best model parameters that fit the training data by minimizing a loss, which can be imagined as a landscape with peaks and valleys, where the lowest point attains an optimal solution. For deep models, the landscape may consist of many such peaks and valleys. The activation function used by the model governs the shape of this landscape and how the model navigates it.

ReLU, which is not a smooth function, imposes an objective whose landscape is partitioned into many regions with multiple local minima, each providing different model predictions. With this landscape, the order in which updates are applied is a dominant factor in determining the optimization trajectory, providing a recipe for irreproducibility. Because of its non-continuous gradient, functions expressed by a ReLU network will contain sudden jumps in the gradient, which can occur internally in different layers of the deep network, affecting updates of different internal units, and are likely strong contributors to irreproducibility.

Suppose a sequence of model updates attempts to push the activation of some unit down from a positive value. The gradient of the ReLU function is 1 for positive unit values, so with every update it pushes the unit to become smaller and smaller (to the left in the panel above). At the point the activation of this unit crosses the threshold from a positive value to a negative one, the gradient suddenly changes from magnitude 1 to magnitude 0. Training attempts to keep moving the unit leftwards, but due to the 0 gradient, the unit cannot move further in that direction. Therefore, the model must resort to updating other units that can move.

We find that networks with smooth activations (e.g., GELU, Swish and Softplus) can be substantially more reproducible. They may exhibit a similar objective landscape, but with fewer regions, giving a model fewer opportunities to diverge. Unlike the sudden jumps with ReLU, for a unit with decreasing activations, the gradient gradually reduces to 0, which gives other units opportunities to adjust to the changing behavior. With equal initialization, moderate shuffling of training examples, and normalization of hidden layer outputs, smooth activations are able to increase the chances of converging to the same minimum. Very aggressive data shuffling, however, loses this advantage.

The rate that a smooth activation function transitions between output levels, i.e., its “smoothness”, can be adjusted. Sufficient smoothness leads to improved accuracy and reproducibility. Too much smoothness, though, approaches linear models with a corresponding degradation of model accuracy, thus losing the advantages of using a deep network.

Smooth activations (top) and their gradients (bottom) for different smoothness parameter values β as a function of the input values. β determines the width of the transition region between 0 and 1 gradients. For Swish and Softplus, a greater β gives a narrower region, for SmeLU, a greater β gives a wider region.

Smooth reLU (SmeLU)
Activations like GELU and Swish require complex hardware implementations to support exponential and logarithmic functions. Further, GELU must be computed numerically or approximated. These properties can make deployment error-prone, expensive, or slow. GELU and Swish are not monotonic (they start by slightly decreasing and then switch to increasing), which may interfere with interpretability (or identifiability), nor do they have a full stop or a clean slope 1 region, properties that simplify implementation and may aid in reproducibility. 

The Smooth reLU (SmeLU) activation function is designed as a simple function that addresses the concerns with other smooth activations. It connects a 0 slope on the left with a slope 1 line on the right through a quadratic middle region, constraining continuous gradients at the connection points (as an asymmetric version of a Huber loss function).

SmeLU can be viewed as a convolution of ReLU with a box. It provides a cheap and simple smooth solution that is comparable in reproducibility-accuracy tradeoffs to more computationally expensive and complex smooth activations. The figure below illustrates the transition of the loss (objective) surface as we gradually transition from a non-smooth ReLU to a smoother SmeLU. A transition of width 0 is the basic ReLU function for which the loss objective has many local minima. As the transition region widens (SmeLU), the loss surface becomes smoother. If the transition is too wide, i.e., too smooth, the benefit of using a deep network wanes and we approach the linear model solution — the objective surface flattens, potentially losing the ability of the network to express much information.

Loss surfaces (as functions of a 2D input) for two sample loss functions (middle and right) as the activation function’s transition region widens, going from from ReLU to an increasingly smoother SmeLU (left). The loss surface becomes smoother with increasing the smoothness of the SmeLU function.

<!–

Loss surfaces (as functions of a 2D input) for two sample loss functions (middle and right) as the activation function’s transition region widens, going from from ReLU to an increasingly smoother SmeLU (left). The loss surface becomes smoother with increasing the smoothness of the SmeLU function.

–>

Performance
SmeLU has benefited multiple systems, specifically recommendation systems, increasing their reproducibility by reducing, for example, recommendation swap rates. While the use of SmeLU results in accuracy improvements over ReLU, it also replaces other costly methods to address irreproducibility, such as ensembles, which mitigate irreproducibility at the cost of accuracy. Moreover, replacing ensembles in sparse recommendation systems reduces the need for multiple lookups of model parameters that are needed to generate an inference for each of the ensemble components. This substantially improves training and inference efficiency.

To illustrate the benefits of smooth activations, we plot the relative prediction difference (PD) as a function of change in some loss for the different activations. We define relative PD as the ratio between the absolute difference in predictions of two models and their expected prediction, averaged over all evaluation examples. We have observed that in large scale systems, it is sufficient, and inexpensive, to consider only two models for very consistent results.

The figure below shows curves on the PD-accuracy loss plane. For reproducibility, being lower on the curve is better, and for accuracy, being on the left is better. Smooth activations can yield a ballpark 50% reduction in PD relative to ReLU, while still potentially resulting in improved accuracy. SmeLU yields accuracy comparable to other smooth activations, but is more reproducible (lower PD) while still outperforming ReLU in accuracy.

Relative PD as a function of percentage change in the evaluation ranking loss, which measures how accurately items are ranked in a recommendation system (higher values indicate worse accuracy), for different activations.

<!–

Relative PD as a function of percentage change in the evaluation ranking loss, which measures how accurately items are ranked in a recommendation system (higher values indicate worse accuracy), for different activations.

–>

Conclusion and Future Work
We demonstrated the problem of irreproducibility in real world practical systems, and how it affects users as well as system and model designers. While this particular issue has been given very little attention when trying to address the lack of replicability of research results, irreproducibility can be a critical problem. We demonstrated that a simple solution of using smooth activations can substantially reduce the problem without degrading other critical metrics like model accuracy. We demonstrate a new smooth activation function, SmeLU, which has the added benefits of mathematical simplicity and ease of implementation, and can be cheap and less error prone.

Understanding reproducibility, especially in deep networks, where objectives are not convex, is an open problem. An initial theoretical framework for the simpler convex case has recently been proposed, but more research must be done to gain a better understanding of this problem which will apply to practical systems that rely on deep networks.

Acknowledgements
We would like to thank Sergey Ioffe for early discussions about SmeLU; Lorenzo Coviello and Angel Yu for help in early adoptions of SmeLU; Shiv Venkataraman for sponsorship of the work; Claire Cui for discussion and support from the very beginning; Jeremiah Willcock, Tom Jablin, and Cliff Young for substantial implementation support; Yuyan Wang, Mahesh Sathiamoorthy, Myles Sussman, Li Wei, Kevin Regan, Steven Okamoto, Qiqi Yan, Todd Phillips, Ed Chi, Sunita Verna, and many many others for many discussions, and for integrations in many different systems; Matt Streeter and Yonghui Wu for feedback on the paper and this post; Tom Small for help with the illustrations in this post.

Read More

Customize the Amazon SageMaker XGBoost algorithm container

The built-in Amazon SageMaker XGBoost algorithm provides a managed container to run the popular XGBoost machine learning (ML) framework, with added convenience of supporting advanced training or inference features like distributed training, dataset sharding for large-scale datasets, A/B model testing, or multi-model inference endpoints. You can also extend this powerful algorithm to accommodate different requirements.

Packaging the code and dependencies in a single container is a convenient and robust approach for long-term code maintenance, reproducibility, and auditing purposes. Modifying the container directly follows the base container faithfully and avoids duplicating existing functions already supported by the base container. In this post, we review the inner workings of the SageMaker XGBoost algorithm container and provide pragmatic scripts to directly customize the container.

SageMaker XGBoost container structure

The SageMaker built-in XGBoost algorithm is packaged as a stand-alone container, available on GitHub, and can be extended under the developer-friendly Apache 2.0 open-source license. The container packages the open-source XGBoost algorithm and ancillary tools to run the algorithm in the SageMaker environment integrated with other AWS Cloud services. This allows you to train XGBoost models on a variety of data sources, make batch predictions on offline data, or host an inference endpoint in a real-time pipeline.

The container supports training and inference operations with different entry points. For inference mode, the entry can be found in the main function in the serving.py script. For real-time inference serving, the container runs a Flask-based web server that when invoked, receives an HTTP-encoded request containing the data, decodes the data into the XGBoost’s DMatrix format, loads the model, and returns an HTTP-encoded response back. These methods are encapsulated under the ScoringService class, which can also be customized through the script mode to a great extent (see the Appendix below).

The entry point for training mode (algorithm mode) is the main function in the training.py. The main function sets up the training environment and calls the training job function. It’s flexible enough to allow for distributed or single-node training, or utilities like cross validation. The heart of the training process can be found in the train_job function.

Docker files packaging the container can be found in the GitHub repo. Note that the container is built in two steps: a base container is built first, followed by the final container on top.

Solution overview

You can modify and rebuild the container through the source code. However, this involves collecting and rebuilding all dependencies and packages from scratch. In this post, we discuss a more straightforward approach that modifies the container on top of the already-built and publicly-available SageMaker XGBoost algorithm container image directly.

In this approach, we pull a copy of the public SageMaker XGBoost image, modify the scripts or add packages, and rebuild the container on top. The modified container can be stored in a private repository. This way, we avoid rebuilding intermediary dependencies and instead build directly on top of the already-built libraries packaged in the official container.

The following figure shows an overview of the script used to pull the public base image, modify and rebuild the image, and upload it to a private Amazon Elastic Container Registry (Amazon ECR) repository. The bash script in the accompanying code of this post performs all the workflow steps shown in the diagram. The accompanying notebook shows an example where the URI of a specific version of the SageMaker XGBoost algorithm is first retrieved and passed to the bash script, which replaces two of the Python scripts in the image, rebuilds it, and pushes the modified image to a private Amazon ECR repository. You can modify the accompanying code to suit your needs.

­

Prerequisites

The GitHub repository contains the code accompanying this post. You can run the sample notebook in your AWS account, or use the provided AWS CloudFormation stack to deploy the notebook using a SageMaker notebook. You need the following prerequisites:

  • An AWS account.
  • Necessary permissions to run SageMaker batch transform and training jobs, and Amazon ECR privileges. The CloudFormation template creates sample AWS Identity and Access Management (IAM) roles.

Deploy the solution

To create your solution resources using AWS CloudFormation, choose Launch Stack:

The stack deploys a SageMaker notebook preconfigured to clone the GitHub repository. The walkthrough notebook includes the steps to pull the public SageMaker XGBoost image for a given version, modify it, and push the custom container to a private Amazon ECR repository. The notebook uses the public Abalone dataset as a sample, trains a model using the SageMaker XGBoost built-in training mode, and reuses this model in the custom image to perform batch transform jobs that produce inference together with SHAP values.

Conclusion

SageMaker built-in algorithms provide a variety of features and functionalities, and can be extended further under the Apache 2.0 open-source license. In this post, we reviewed how to extend the production built-in container for the SageMaker XGBoost algorithm to meet production requirements like backward code and API compatibility.

The sample notebook and helper scripts provide a convenient starting point to customize SageMaker XGBoost container image the way you would like it. Give it a try!

Appendix: Script mode

Script mode provides a way to modify many SageMaker built-in algorithms by providing an interface to replace the functions responsible for transforming the inputs and loading the model. Script mode isn’t as flexible as directly modifying the container, but it provides a completely Python-based route to customize the built-in algorithm with no need to work directly with Docker.

In script mode, a user-module is provided to customize data decoding, loading of the model, and making predictions. The user module can define a transformer_fn that handles all aspects of processing the request to preparing the response. Or instead of defining transformer_fn, you can provide custom methods model_fn, input_fn, predict_fn, and output_fn individually to customize loading the model and decoding and preparing the input for prediction. For a more thorough overview of script mode, see Bring Your Own Model with SageMaker Script Mode.


About the Authors

Peyman Razaghi is a Data Scientist at AWS. He holds a PhD in information theory from the University of Toronto and was a post-doctoral research scientist at the University of Southern California (USC), Los Angeles. Before joining AWS, Peyman was a staff systems engineer at Qualcomm contributing to a number of notable international telecommunication standards. He has authored several scientific research articles peer-reviewed in statistics and systems-engineering area, and enjoys parenting and road cycling outside work.

Read More

Detect adversarial inputs using Amazon SageMaker Model Monitor and Amazon SageMaker Debugger

Research over the past few years has shown that machine learning (ML) models are vulnerable to adversarial inputs, where an adversary can craft inputs to strategically alter the model’s output (in image classification, speech recognition, or fraud detection). For example, imagine you have deployed a model that identifies your employees based on images of their faces. As demonstrated in the whitepaper Accessorize to a Crime: Real and Stealthy Attacks on State-of-the-Art Face Recognition, malicious employees may apply subtle but carefully designed modifications to their image and fool the model to authenticate them as other employees. Obviously, such adversarial inputs—especially if there are a significant amount of them—can have a devastating business impact.

Ideally, we want to detect each time an adversarial input is sent to the model to quantify how adversarial inputs are impacting your model and business. To this end, a wide class of methods analyze individual model inputs to check for adversarial behavior. However, active research in adversarial ML has led to increasingly sophisticated adversarial inputs, many of which are known to make detection ineffective. The reason for this shortcoming is that it’s difficult to draw conclusions from an individual input as to whether it’s adversarial or not. To this end, a recent class of methods focuses on distributional-level checks by analyzing multiple inputs at a time. The key idea behind these new methods is that considering multiple inputs at a time enables more powerful statistical analysis that isn’t possible with individual inputs. However, in the face of a determined adversary with deep knowledge of the model, even these advanced detection methods can fail.

However, we can defeat even these determined adversaries by providing the defense methods with additional information. Specifically, instead of just the analyzing model inputs, analyzing the latent representations collected from the intermediate layers in a deep neural network significantly strengthens the defense.

In this post, we walk you through how to detect adversarial inputs using Amazon SageMaker Model Monitor and Amazon SageMaker Debugger for an image classification model hosted on Amazon SageMaker.

To reproduce the different steps and results listed in this post, clone the repository detecting-adversarial-samples-using-sagemaker into your Amazon SageMaker notebook instance and run the notebook.

Detecting adversarial inputs

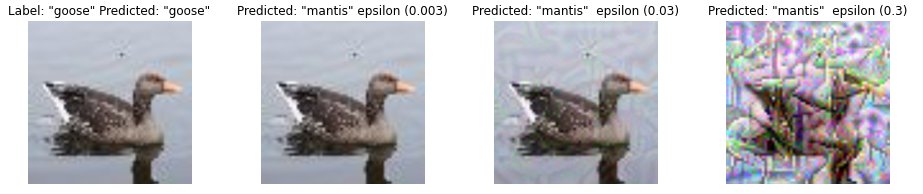
We show you how to detect adversarial inputs using the representations collected from a deep neural network. The following four images show the original training image on the left (taken from the Tiny ImageNet dataset) and three images produced by the Projected Gradient Descent (PGD) attack [1] with different perturbation parameters ϵ. The model used here was ResNet18. The ϵ parameter defines the amount of adversarial noise added to the images. The original image (left) is correctly predicted as class 67 (goose). The adversarially modified images 2, 3, and 4 are incorrectly predicted as class 51 (mantis) by the ResNet18 model. We can also see that images generated with small ϵ are perceptually indistinguishable from the original input image.

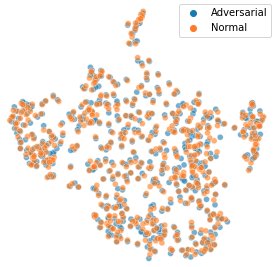
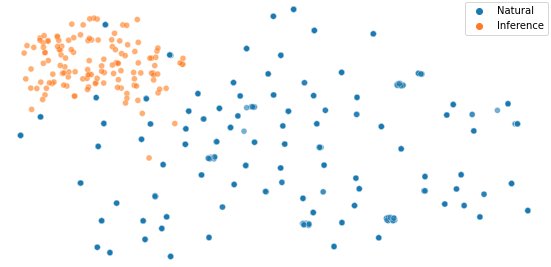
Next, we create a set of normal and adversarial images and use t-Distributed Stochastic Neighbor Embedding (t-SNE [2]) to visually compare their distributions. t-SNE is a dimensionality reduction method that maps high-dimensional data into a 2- or 3-dimensional space. Each data point in the following image presents an input image. Orange data points present the normal inputs taken from the test set, and blue data points indicate the corresponding adversarial images generated with an epsilon of 0.003. If normal and adversarial inputs are distinguishable, then we would expect separate clusters in the t-SNE visualization. Because both belong to the same cluster, this means that a detection technique that focuses solely on changes in the model input distribution can’t distinguish these inputs.

Let’s take a closer look at the layer representations produced by different layers in the ResNet18 model. ResNet18 consists of 18 layers; in the following image, we visualize the t-SNE embeddings for the representations for six of these layers.

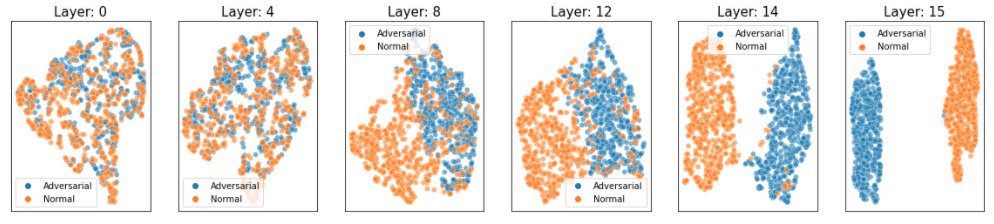
As the preceding figure shows, natural and adversarial inputs become more distinguishable for deeper layers of the ResNet18 model.

Based on these observations, we use a statistical method that measures distinguishability with hypothesis testing. The method consists of a two-sample test using maximum mean discrepancy (MMD). MMD is a kernel-based metric for measuring the similarity between two distributions generating the data. A two-sample test takes two sets that contain inputs drawn from two distributions, and determines whether these distributions are the same. We compare the distribution of inputs observed in the training data and compare it with the distribution of the inputs received during inference.

Our method uses these inputs to estimate the p-value using MMD. If the p-value is greater than a user-specific significance threshold (5% in our case), we conclude that both distributions are different. The threshold tunes the trade-off between false positives and false negatives. A higher threshold, such as 10%, decreases the false negative rate (there are fewer cases when both distributions were different but the test failed to indicate that). However, it also results in more false positives (the test indicates both distributions are different even when that isn’t the case). On the other hand, a lower threshold, such as 1%, results in fewer false positives but more false negatives.

Instead of applying this method solely on the raw model inputs (images), we use the latent representations produced by the intermediate layers of our model. To account for its probabilistic nature, we apply the hypothesis test 100 times on 100 randomly selected natural inputs and 100 randomly selected adversarial inputs. Then we report the detection rate as the percentage of tests that resulted in a detection event according to our 5% significance threshold. The higher detection rate is a stronger indication that the two distributions are different. This procedure gives us the following detection rates:

  • Layer 1: 3%
  • Layer 4: 7%
  • Layer 8: 84%
  • Layer 12: 95%
  • Layer 14: 100%
  • Layer 15: 100%

In the initial layers, the detection rate is rather low (less than 10%), but increases to 100% in the deeper layers. Using the statistical test, the method can confidently detect adversarial inputs in deeper layers. It is often sufficient to simply use the representations generated by the penultimate layer (the last layer before the classification layer in a model). For more sophisticated adversarial inputs, it’s useful to use representations from other layers and aggregate the detection rates.

Solution overview

In the previous section, we saw how to detect adversarial inputs using representations from the penultimate layer. Next, we show how to automate these tests on SageMaker by using Model Monitor and Debugger. For this example, we first train an image classification ResNet18 model on the tiny ImageNet dataset. Next, we deploy the model on SageMaker and create a custom Model Monitor schedule that runs the statistical test. Afterwards, we run inference with normal and adversarial inputs to see how effective the method is.

Capture tensors using Debugger

During model training, we use Debugger to capture representations generated by the penultimate layer, which are used later on to derive information about the distribution of normal inputs. Debugger is a feature of SageMaker that enables you to capture and analyze information such as model parameters, gradients, and activations during model training. These parameter, gradient, and activation tensors are uploaded to Amazon Simple Storage Service (Amazon S3) while the training is in progress. You can configure rules that analyze these for issues such as overfitting and vanishing gradients. For our use case, we only want to capture the penultimate layer of the model (.*avgpool_output) and the model outputs (predictions). We specify a Debugger hook configuration that defines a regular expression for the layer representations to be collected. We also specify a save_interval that instructs Debugger to collect this data during the validation phase every 100 forward passes. See the following code:

from sagemaker.debugger import DebuggerHookConfig, CollectionConfig

debugger_hook_config = DebuggerHookConfig(
      collection_configs=[ 
          CollectionConfig(
                name="custom_collection",
                parameters={ "include_regex": ".*avgpool_output|.*ResNet_output",
                             "eval.save_interval": "100" })])

Run SageMaker training

We pass the Debugger configuration into the SageMaker estimator and start the training:

import sagemaker 
from sagemaker.pytorch import PyTorch

role = sagemaker.get_execution_role()

pytorch_estimator = PyTorch(entry_point='train.py',
                            source_dir='code',
                            role=role,
                            instance_type='ml.p3.2xlarge',
                            instance_count=1,
                            framework_version='1.8',
                            py_version='py3',
                            hyperparameters = {'epochs': 25, 
                                               'learning_rate': 0.001},
                            debugger_hook_config=debugger_hook_config
                           )
pytorch_estimator.fit()

Deploy an image classification model

After the model training is complete, we deploy the model as an endpoint on SageMaker. We specify an inference script that defines the model_fn and transform_fn functions. These functions specify how the model is loaded and how incoming data needs to be preprocessed to perform the model inference. For our use case, we enable Debugger to capture relevant data during inference. In the model_fn function, we specify a Debugger hook and a save_config that specifies that for each inference request, the model inputs (images), the model outputs (predictions), and the penultimate layer are recorded (.*avgpool_output). We then register the hook on the model. See the following code:

def model_fn(model_dir):
    
    #create model    
    model = create_and_load_model(model_dir)
    
    
    #hook configuration
    tensors_output_s3uri = os.environ.get('tensors_output')
    
    #capture layers for every inference request
    save_config = smd.SaveConfig(mode_save_configs={
        smd.modes.PREDICT: smd.SaveConfigMode(save_interval=1),
    })
   
    #configure Debugger hook
    hook = smd.Hook(
        tensors_output_s3uri,
        save_config=save_config,
        include_regex='.*avgpool_output|.*ResNet_output_0|*ResNet_input',
    )
    
    #register hook
    hook.register_module(model) 
    
    #set mode
    hook.set_mode(modes.PREDICT)
    
    return model

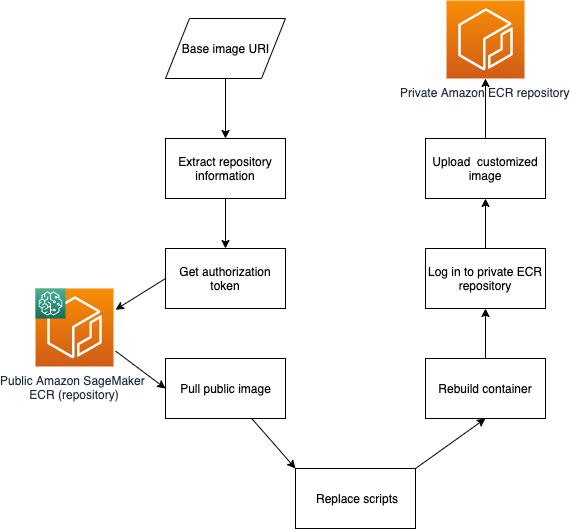
Now we deploy the model, which we can do from the notebook in two ways. We can either call pytorch_estimator.deploy() or create a PyTorch model that points to the model artifact files in Amazon S3 that have been created by the SageMaker training job. In this post, we do the latter. This allows us to pass in environment variables into the Docker container, which is created and deployed by SageMaker. We need the environment variable tensors_output to tell the script where to upload the tensors that are collected by SageMaker Debugger during inference. See the following code:

from sagemaker.pytorch import PyTorchModel

sagemaker_model = PyTorchModel(
    model_data=pytorch_estimator.model_data,
    role=role,
    source_dir='code',
    entry_point='inference.py',
    env={
          'tensors_output': f's3://{sagemaker_session.default_bucket()}/data_capture/inference',
        },
    framework_version='1.8',
    py_version='py3',
)

Next, we deploy the predictor on an ml.m5.xlarge instance type:

predictor = sagemaker_model.deploy(
    initial_instance_count=1,
    instance_type='ml.m5.xlarge',
    data_capture_config=data_capture_config,
    deserializer=sagemaker.deserializers.JSONDeserializer(),
)

Create a custom Model Monitor schedule

When the endpoint is up and running, we create a customized Model Monitor schedule. This is a SageMaker processing job that runs on a periodic interval (such as hourly or daily) and analyzes the inference data. Model Monitor provides a pre-configured container that analyzes and detects data drift. In our case, we want to customize it to fetch the Debugger data and run the MMD two-sample test on the retrieved layer representations.

To customize it, we first define the Model Monitor object, which specifies on which instance type these jobs are going to run and the location of our custom Model Monitor container:

from sagemaker.model_monitor import ModelMonitor

monitor = ModelMonitor(
    base_job_name='ladis-monitor',
    role=role,
    image_uri=processing_repository_uri,
    instance_count=1,
    instance_type='ml.m5.large',
    env={ 'training_data':f'{pytorch_estimator.latest_job_debugger_artifacts_path()}', 
          'inference_data': f's3://{sagemaker_session.default_bucket()}/data_capture/inference'},
)

We want to run this job on an hourly basis, so we specify CronExpressionGenerator.hourly() and the output locations where analysis results are uploaded to. For that we need to define ProcessingOutput for the SageMaker processing output:

from sagemaker.model_monitor import CronExpressionGenerator, MonitoringOutput
from sagemaker.processing import ProcessingInput, ProcessingOutput

#inputs and outputs for scheduled monitoring job
destination = f's3://{sagemaker_session.default_bucket()}/data_capture/results'
processing_output = ProcessingOutput(
    output_name='result',
    source='/opt/ml/processing/results',
    destination=destination,
)
output = MonitoringOutput(source=processing_output.source, destination=processing_output.destination)

#create schedule
monitor.create_monitoring_schedule(
    output=output,
    endpoint_input=predictor.endpoint_name,
    schedule_cron_expression=CronExpressionGenerator.hourly(),
)

Let’s look closer at what our custom Model Monitor container is running. We create an evaluation script, which loads the data captured by Debugger. We also create a trial object, which enables us to access, query, and filter the data that Debugger saved. With the trial object, we can iterate over the steps saved during the inference and training phases trial.steps(mode).

First, we fetch the model outputs (trial.tensor("ResNet_output_0")) as well as the penultimate layer (trial.tensor_names(regex=".*avgpool_output")). We do this for the inference and validation phases of training (modes.EVAL and modes.PREDICT). The tensors from the validation phase serve as an estimation of the normal distribution, which we then use to compare the distribution of inference data. We created a class LADIS (Detecting Adversarial Input Distributions via Layerwise Statistics). This class provides the relevant functionalities to perform the two-sample test. It takes the list of tensors from the inference and validation phases and runs the two-sample test. It returns a detection rate, which is a value between 0–100%. The higher the value, the more likely that the inference data follows a different distribution. Furthermore, we compute a score for each sample that indicates how likely a sample is adversarial and the top 100 samples are recorded, so that users can further inspect them. See the following code:

import LADIS
import sample_selection

#access tensors saved during training
trial = create_trial("s3://xxx/training/debug-output/")

#iterate over validation steps saved by Debugger during training
for step in trial.steps(mode=modes.EVAL):
       
   #get model outputs
   tensor = trial.tensor("ResNet_output_0").value(step, mode=modes.EVAL)
   prediction = np.argmax(tensor)
   val_predictions.append(prediction)
   
   #get outputs from penultimate layer 
   for layer in trial.tensor_names(regex=".*avgpool_output"):
      tensor = trial.tensor(layer).value(step, mode=modes.EVAL)])
      val_pen_layer[layer].append(tensor)
      
#access tensors saved during inference
trial = create_trial("s3://xxx/data_capture/inference/")

#iterate over inference steps saved by Debugger
for step in trial.steps(mode=modes.PREDICT):
       
   #get model outputs
   tensor = trial.tensor("ResNet_output_0").value(step, mode=modes.PREDICT)
   prediction = np.argmax(tensor)
   inference_predictions.append(prediction)
    
   #get penultimate layer
   for layer in trial.tensor_names(regex=".*avgpool_output"):
      tensor = trial.tensor(layer).value(step, mode=modes.PREDICT)])
      inference_pen_layer[layer].append(tensor)


#create LADIS object 
ladis = LADIS.LADIS(val_pen_layer, val_predictions, 
                    inference_pen_layer, inference_predictions)

#run MMD test
detection_rate = ladis.get_detection_rate(layers=[0], combine=True)

#determine how much each sample contribute to the detection
for index in range(len(query_latent['avgpool_output_0'])):
    
    stats.append(sample_selection.compute_ME_stat(val_latent['avgpool_output_0', 
                            inference_pen_layer['avgpool_output_0'],
                            inference_pen_layer['avgpool_output_0'][index]))

#find top 100 samples that were the most impactful for detection
samples = sorted(stats)[:100]

Test against adversarial inputs

Now that our custom Model Monitor schedule has been deployed, we can produce some inference results.

First, we run with data from the holdout set and then with adversarial inputs:

test_dataset = datasets.CIFAR10('data/cifar10', train=False, download=True, transform=None)

#run inference loop over holdout dataset
for index, (image, label) in enumerate(zip(test_dataset.data, test_dataset.targets)):

    #predict
    result = predictor.predict(image)

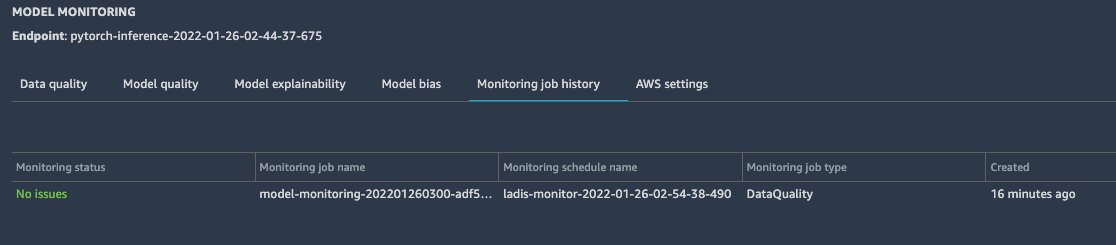
We can then check the Model Monitor display in Amazon SageMaker Studio or use Amazon CloudWatch logs to see if an issue was found.

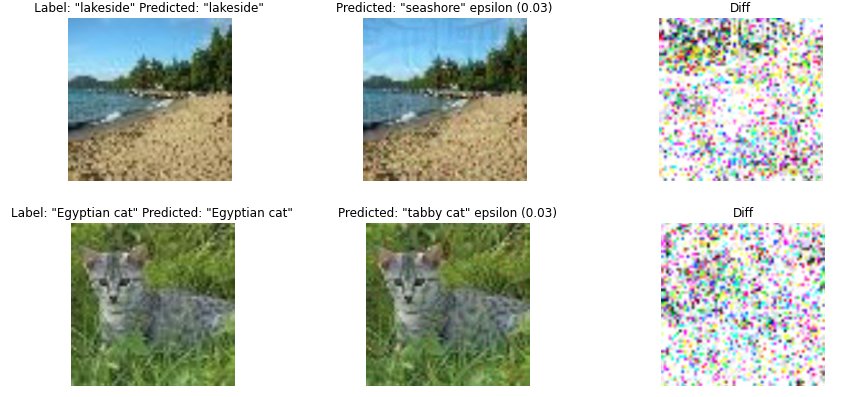
Next, we use the adversarial inputs against the model hosted on SageMaker. We use the test dataset of the Tiny ImageNet dataset and apply the PGD attack, which introduces perturbations at the pixel level such that the model doesn’t recognize correct classes. In the following images, the left column shows two original test images, the middle column shows their adversarially perturbed versions, and the right column shows the difference between both images.

Now we can check the Model Monitor status and see that some of the inference images were drawn from a different distribution.

Results and user action

The custom Model Monitor job determines scores for each inference request, which indicates how likely the sample is adversarial according to the MMD test. These scores are gathered for all inference requests. Their score with the corresponding Debugger step number is recorded in a JSON file and uploaded to Amazon S3. After the Model Monitoring job is complete, we download the JSON file, retrieve step numbers, and use Debugger to retrieve the corresponding model inputs for these steps. This allows us to inspect the images that were detected as adversarial.

The following code block plots the first two images that have been identified as the most likely to be adversarial:

#access inference data
trial = create_trial(f"s3://{sagemaker_session.default_bucket()}/data_capture/inference")
steps = trial.steps(mode=modes.PREDICT)

#load constraint_violations.json file generated by custom ModelMonitor
results = monitor.latest_monitoring_constraint_violations().body_dict)

for index in range(2):
    # get results: step and score
    step = results['violations'][index]['description']['Step']
    score = round( results['violations'][index]['description']['Score'],3)
    
    # get input image
    image = trial.tensor('ResNet_input_0').value(step, mode=modes.PREDICT)[0,:,:,:]
    
    # get predicted class
    predicted = np.argmax(trial.tensor('ResNet_output_0').value(step, mode=modes.PREDICT))
    
    # visualize image 
    plot_image(image, predicted)

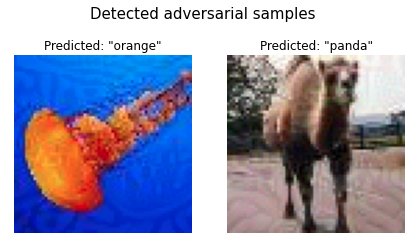
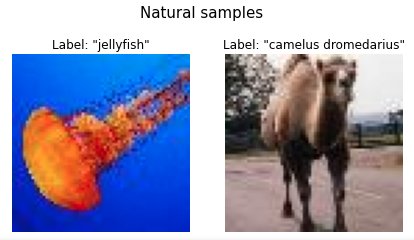
In our example test run, we get the following output. The jellyfish image was incorrectly predicted as an orange, and the camel image as a panda. Obviously, the model failed on these inputs and didn’t even predict a similar image class, such as goldfish or horse. For comparison, we also show the corresponding natural samples from the test set on the right side. We can observe that the random perturbations introduced by the attacker are very visible in the background of both images.

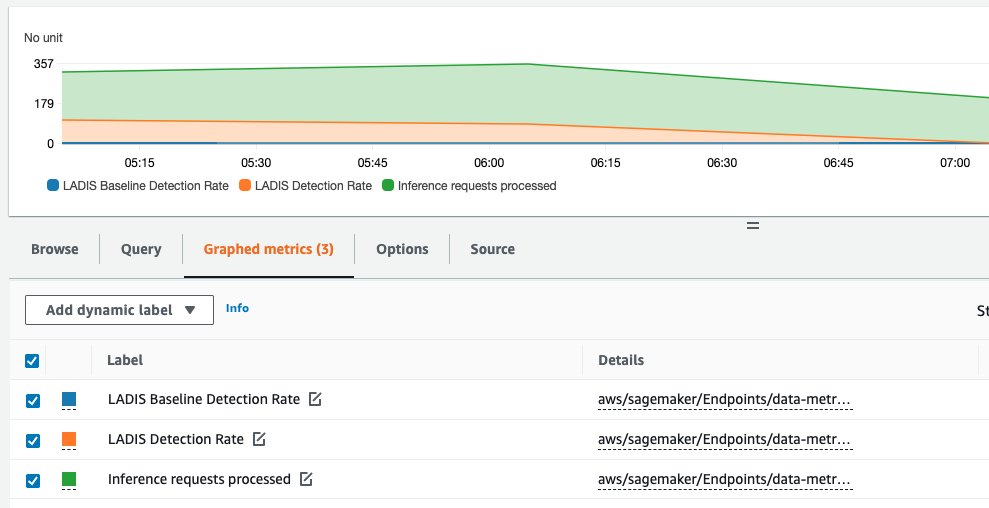
The custom Model Monitor job publishes the detection rate to CloudWatch, so we can investigate how this rate changed over time. A significant change between two data points may indicate that an adversary was trying to fool the model at a specific time frame. Additionally, you can also plot the number of inference requests being processed in each Model Monitor job and the baseline detection rate, which is computed over the validation dataset. The baseline rate is usually close to 0 and only serves as a comparison metric.

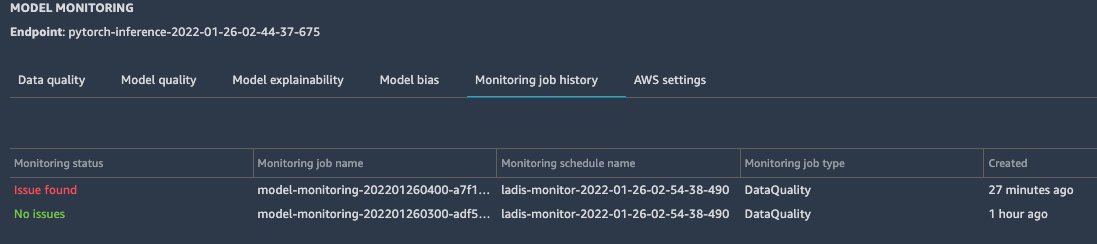
The following screenshot shows the metrics generated by our test runs, which ran three Model Monitoring jobs over 3 hours. Each job processes approximately 200–300 inference requests at a time. The detection rate is 100% between 5:00 PM and 6:00 PM, and drops afterwards.

Furthermore, we can also inspect the distributions of representations generated by the intermediate layers of the model. With Debugger, we can access the data from the validation phase of the training job and the tensors from the inference phase, and use t-SNE to visualize their distribution for certain predicted classes. See the following code:

import seaborn as sns
from sklearn.manifold import TSNE


#compute TSNE embeddings
tsne = TSNE(n_components=2, verbose=1, perplexity=40, n_iter=300)
embedding = tsne.fit_transform(np.concatenate((val_penultimate_layer, inference_penultimate_layer)))

# plot results
sns.scatterplot(x=embedding[:,0], y= embedding[:,1], hue=labels, alpha=0.6, palette=sns.color_palette(None, len(np.unique(labels))), legend="full")
plt.figure(figsize=(10,5))

In our test case, we get the following t-SNE visualization for the second image class. We can observe that the adversarial samples are clustered differently than the natural ones.

Summary

In this post, we showed how to use a two-sample test using maximum mean discrepancy to detect adversarial inputs. We demonstrated how you can deploy such detection mechanisms using Debugger and Model Monitor. This workflow allows you to monitor your models hosted on SageMaker at scale and detect adversarial inputs automatically. To learn more about it, check out our GitHub repo.

References

[1] Aleksander Madry, Aleksandar Makelov, Ludwig Schmidt, Dimitris Tsipras, and Adrian Vladu. Towards deep learning models resistant to adversarial attacks. In International Conference on Learning Representations, 2018.

[2] Laurens van der Maaten and Geoffrey Hinton. Visualizing data using t-SNE. Journal of Machine Learning Research, 9:2579–2605, 2008. URL http://www.jmlr.org/papers/v9/vandermaaten08a.html.


About the Authors

Nathalie Rauschmayr is a Senior Applied Scientist at AWS, where she helps customers develop deep learning applications.

Yigitcan Kaya is a fifth year PhD student at University of Maryland and an applied scientist intern at AWS, working on security of machine learning and applications of machine learning for security.

Bilal Zafar is an Applied Scientist at AWS, working on Fairness, Explainability and Security in Machine Learning.

Sergul Aydore is a Senior Applied Scientist at AWS working on Privacy and Security in Machine Learning

Read More