Colab’s ‘Pay As You Go’ Offers More Access to Powerful NVIDIA Compute for Machine Learning

Posted by Chris Perry, Google Colab Product Lead

Google Colab is launching a new paid tier, Pay As You Go, giving anyone the option to purchase additional compute time in Colab with or without a paid subscription. This grants access to Colab’s  powerful NVIDIA GPUs and gives you more control over your machine learning environment.

Colab is fully committed to supporting all of our users whether or not they pay for additional compute, and our free-of-charge tier stays in its current form. Today’s announcement reflects additions to paid options only.

Colab helps you accomplish more with machine learning

Google Colab is the easiest way to start machine learning. From the Colab notebooks powering TensorFlow’s tutorials and guides to Deepmind’s AlphaFold example, Colab is helping the world learn ML and share the results broadly, democratizing machine learning.

Colab Pay As You Go further expands the potantial for using Colab. Pay As You Go allows anyone to purchase more compute time with Colab, regardless of whether or not they have a monthly subscription. Customers can use this feature to dramatically increase their usage allotments of Colab over what was possible before. Try it out at colab.research.google.com/signup

Previously, Colab’s paid quota service throttled compute usage to smooth out quota exhaustion over the entire month of a subscription to ensure a paid user would be able to access Colab compute as much as possible over their month’s subscription: we didn’t want users to fully exhaust their quota on day one and spend the rest of the month frustrated by lack of access to runtimes. Now with Pay As You Go, we are relaxing usage throttling for all paid users (though this will remain the case for users in our free of charge tier).

Paid users now have the flexibility to exhaust compute quota, measured in compute units, at whatever rate they choose. As compute units are exhausted, a user can choose to purchase more with Pay As You Go at their discretion. Once a user has exhausted their compute units their Colab usage quota will revert to our free of charge tier limits.

Increasing your power with NVIDIA GPUs

Paid Colab users can now choose between a standard or premium GPU in Colab, giving you the ability to upgrade your GPU when you need more power. Standard GPUs are typically NVIDIA T4 Tensor Core GPUs, while premium GPUs are typically NVIDIA V100 or A100 Tensor Core GPUs. Getting a specific GPU chip type assignment is not guaranteed and depends on a number of factors, including availability and your paid balance with Colab. If you want guaranteed access to a specific machine configuration, we recommend purchasing a VM on GCP Marketplace.

When you need more power, select premium GPU in your runtime settings: Runtime > Change runtime type > GPU class > Premium. Premium GPUs will deplete your paid balance in Colab faster than standard GPUs.

Colab is the right choice for ML projects

Colab is the right choice for your machine learning project: TensorFlow and many excellent ML libraries come pre-installed, pre-warmed GPUs are a click away, and sharing your notebook with a collaborator is as easy as sharing a Google doc. Collaborators can access runtimes with GPU accelerators without need for payment. Pay As You Go makes Colab an even more useful product for any ML project you’re looking into.

Read More

How Sophos trains a powerful, lightweight PDF malware detector at ultra scale with Amazon SageMaker

This post is co-authored by Salma Taoufiq and Harini Kannan from Sophos.

As a leader in next-generation cybersecurity, Sophos strives to protect more than 500,000 organizations and millions of customers across over 150 countries against evolving threats. Powered by threat intelligence, machine learning (ML), and artificial intelligence from Sophos X-Ops, Sophos delivers a broad and varied portfolio of advanced products and services to secure and defend users, networks, and endpoints against phishing, ransomware, malware, and the wide range of cyberattacks out there.

The Sophos Artificial Intelligence (AI) group (SophosAI) oversees the development and maintenance of Sophos’s major ML security technology. Security is a big-data problem. To evade detection, cybercriminals are constantly crafting novel attacks. This translates into colossal threat datasets that the group must work with to best defend customers. One notable example is the detection and elimination of files that were cunningly laced with malware, where the datasets are in terabytes.

In this post, we focus on Sophos’s malware detection system for the PDF file format specifically. We showcase how SophosAI uses Amazon SageMaker distributed training with terabytes of data to train a powerful lightweight XGBoost (Extreme Gradient Boosting) model. This allows their team to iterate over large training data faster with automatic hyperparameter tuning and without managing the underlying training infrastructure.

The solution is currently seamlessly integrated into the production training pipeline and the model deployed on millions of user endpoints via the Sophos endpoint service.

Use case context

Whether you want to share an important contract or preserve the fancy design of your CV, the PDF format is the most common choice. Its widespread use and the general perception that such documents are airtight and static have lulled users into a false sense of security. PDF has, therefore, become an infection vector of choice in attackers’ arsenal. Malicious actions using PDFs are most often achieved via embedding a JavaScript payload that is run by the PDF reader to download a virus from a URI, sabotage the user’s machine, or steal sensitive information.

Sophos detects malicious PDF files at various points of an attack using an ensemble of deterministic and ML models. One such approach is illustrated in the following diagram, where the malicious PDF file is delivered through email. As soon as a download attempt is made, it triggers the malicious executable script to connect to the attacker’s Command and Control server. SophosAI’s PDF detector blocks the download attempt after detecting that it’s malicious.

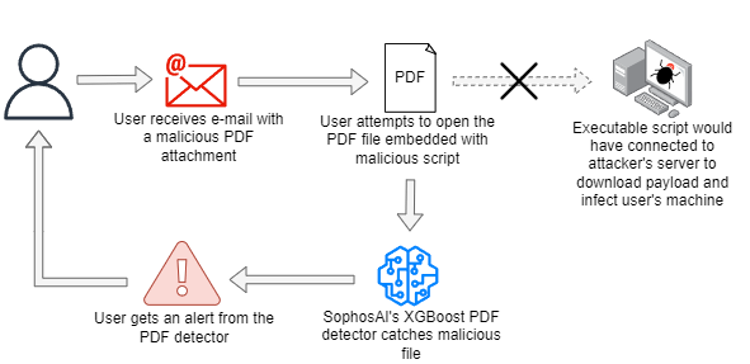
Other ways include blocking the PDF files in the endpoint, sending the malicious files to a sandbox (where it’s scored using multiple models), submitting the malicious file to a scoring infrastructure and generating a security report, and so on.

Motivation

To build a tree-based detector that can convict malicious PDFs with high confidence, while allowing for low endpoint computing power consumption and fast inference responses, the SophosAI team found the XGBoost algorithm to be a perfect candidate for the task. Such research avenues are important for Sophos for two reasons. Having powerful yet small models deployed at the level of customer endpoints has a high impact on the company’s product reviews by analysts. It also, and more importantly, provides a better user experience overall.

Technical challenge

Because the goal was to have a model with a smaller memory footprint than their existing PDF malware detectors (both on disk and in memory), SophosAI turned XGBoost, a classification algorithm with a proven record of producing drastically smaller models than neural networks while achieving impressive performance on tabular data. Before venturing into modeling XGBoost experiments, an important consideration was the sheer size of the dataset. Indeed, Sophos’s core dataset of PDF files is in terabytes.

Therefore, the main challenge was training the model with a large dataset without having to downsample. Because it’s crucial for the detector to learn to spot any PDF-based attacks — even needle-in-the-haystack and completely novel ones to better defend Sophos customers — it’s of the utmost importance to use all available diverse datasets.

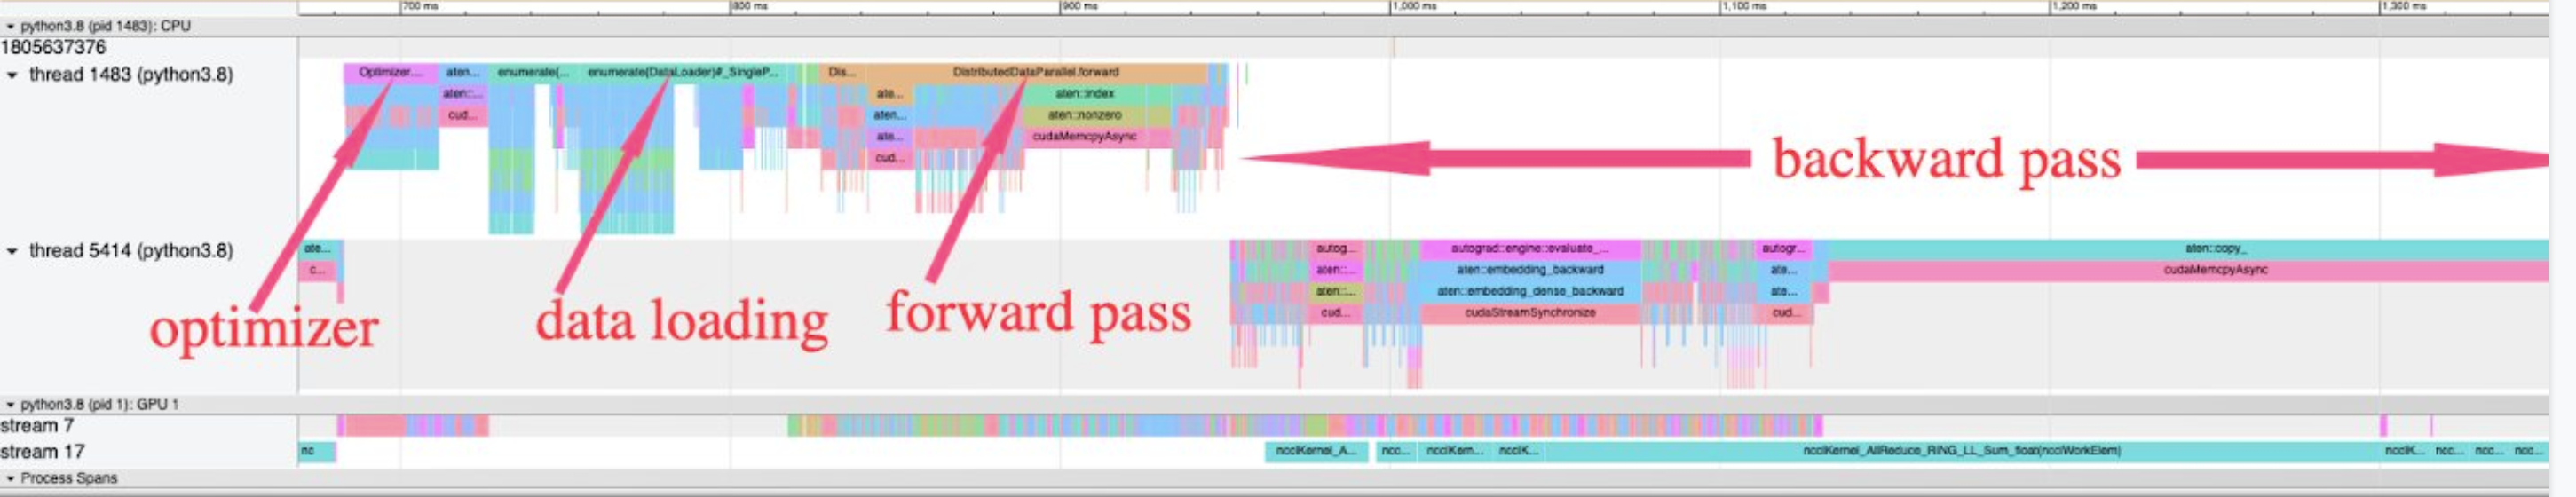
Unlike neural networks, where you can train in batches, for XGBoost, we need the entire training dataset in memory. The largest training dataset for this project is over 1 TB, and there is no way to train on such a scale without utilizing the methodologies of a distributed training framework.

Solution overview

SageMaker is a fully managed ML service providing various tools to build, train, optimize, and deploy ML models. The SageMaker built-in libraries of algorithms consist of 21 popular ML algorithms, including XGBoost. (For more information, see Simplify machine learning with XGBoost and Amazon SageMaker.) With the XGBoost built-in algorithm, you can take advantage of the open-source SageMaker XGBoost Container by specifying a framework version greater than 1.0-1, which has improved flexibility, scalability, extensibility, and Managed Spot Training, and supports input formats like Parquet, which is the format used for the PDF dataset.

The main reason SophosAI chose SageMaker is the ability to benefit from the fully managed distributed training on multi-node CPU instances by simply specifying more than one instance. SageMaker automatically splits the data across nodes, aggregates the results across peer nodes, and generates a single model. The instances can be Spot Instances, thereby significantly reducing the training costs. With the built-in algorithm for XGBoost, you can do this without any additional custom script. Distributed versions of XGBoost also exist as open source, such as XGBoost-Ray and XGBoost4J-Spark, but their use requires building, securing, tuning, and self-managing distributed computing clusters, which represents significant effort additional to scientific development.

Additionally, SageMaker automatic model tuning, also known as hyperparameter tuning, finds the best version of a model by running many training jobs with ranges of hyperparameters that you specify. It then chooses the hyperparameter values that result in a model that performs the best, as measured by a metric for the given ML task.

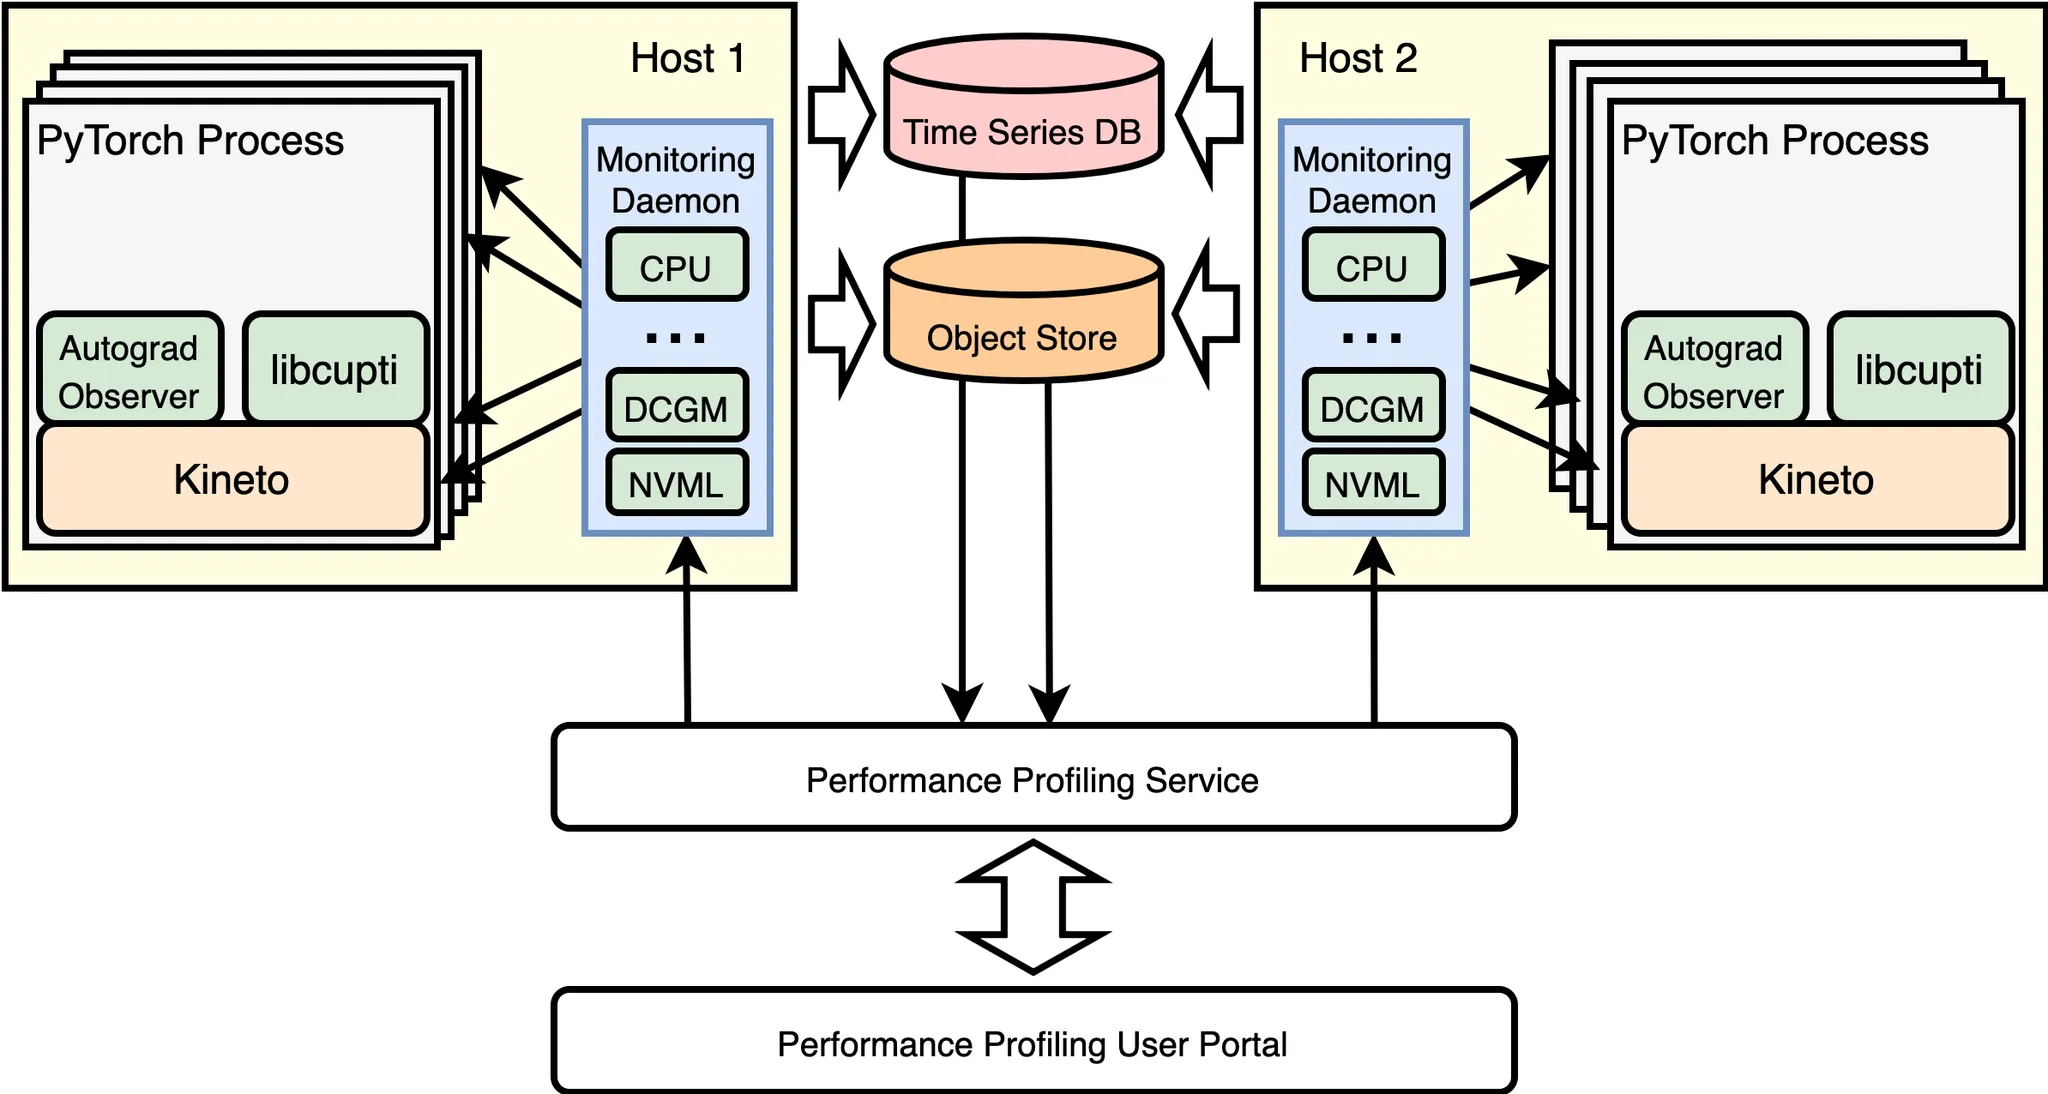
The following diagram illustrates the solution architecture.

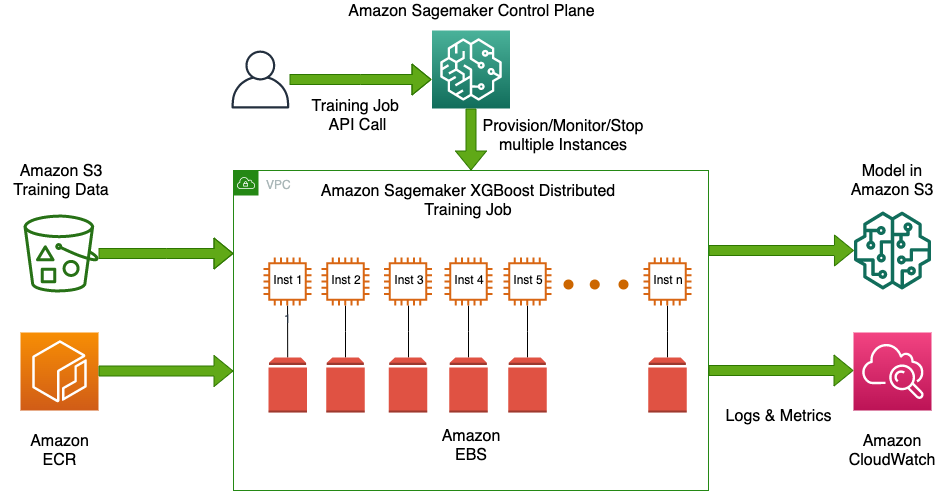
It’s worth noting that, when SophosAI started XGBoost experiments before turning to SageMaker, attempts were made to use large-memory Amazon Elastic Compute Cloud (Amazon EC2) instances (for example, r5a.24xlarge and x1.32xlarge) to train the model on as large of a sample of the data as possible. However, these attempts took more than 10 hours on average and usually failed due to running out of memory.

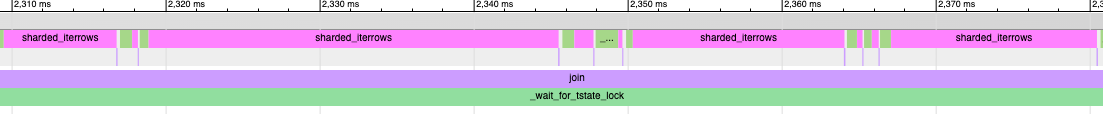
In contrast, by using the SageMaker XGBoost algorithm and a hassle-free distributed training mechanism, SophosAI could train a booster model at scale on the colossal PDF training dataset in a matter of 20 minutes. The team only had to store the data on Amazon Simple Storage Service (Amazon S3) as Parquet files of similar size, and choose an EC2 instance type and the desired number of instances, and SageMaker managed the underlying compute cluster infrastructure and distributed training between multiple nodes of the cluster. Under the hood, SageMaker splits the data across nodes using ShardedByS3Key to distribute the file objects equally between each instance and uses XGBoost implementation of the Rabit protocol (reliable AllReduce and broadcast interface) to launch distributed processing and communicate between primary and peer nodes. (For more details on the histogram aggregation and broadcast across nodes, refer to XGBoost: A Scalable Tree Boosting System.)

Beyond just training one model, with SageMaker, XGBoost hyperparameter tuning was also made quick and easy with the ability to run different experiments simultaneously to fine-tune the best combination of hyperparameters. The tunable hyperparameters include both booster-specific and objective function-specific hyperparameters. Two search strategies are offered: random or Bayesian. The Bayesian search strategy has proven to be valuable because it helps find better hyperparameters than a mere random search, in fewer experimental iterations.

Dataset information

SophosAI’s PDF malware detection modeling relies on a variety of features such as n-gram histograms and byte entropy features (For more information, refer to MEADE: Towards a Malicious Email Attachment Detection Engine). Metadata and features extracted from collected PDF files are stored in a distributed data warehouse. A dataset of over 3,500 features is then computed, further split based on time into training and test sets and stored in batches as Parquet files in Amazon S3 to be readily accessible by SageMaker for training jobs.

The following table provides information about the training and test data.

Dataset Number of Samples Number of Parquet Files Total Size
Training 70,391,634 5,500 ~1010 GB
Test 1,242,283 98 ~18 GB

The data sizes have been computed following the formula:

Data Size = N × (nF + nL) × 4

The formula has the following parameters:

  • N is the number of samples in the dataset
  • nF is the number of features, with nF = 3585
  • nL is the number of ground truth labels, with   nL = 1
  • 4 is the number of bytes needed for the features’ data type: float32

Additionally, the following pie charts provide the label distribution of both the training and test sets, eliciting the class imbalance faced in the PDF malware detection task.

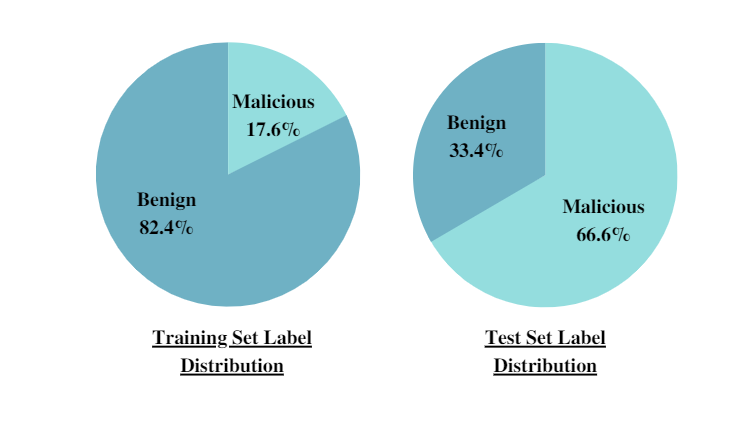
The distribution shifts from the training set to the One-month test set. A time-based split of the dataset into training and testing is applied in order to simulate the real-life deployment scenario and avoid temporal snooping. This strategy also allowed SophosAI to evaluate the model’s true generalization capabilities when faced with previously unseen brand-new PDF attacks, for example.

Experiments and results

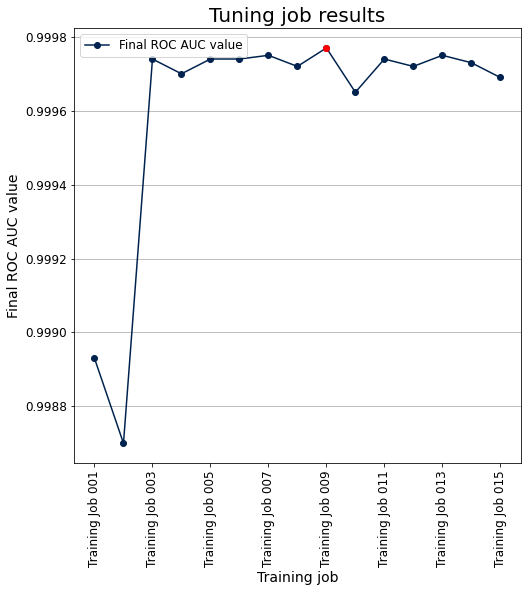
To kickstart experiments, the SophosAI team trained a baseline XGBoost model with default parameters. Then they started performing hyperparameter fine-tuning with SageMaker using the Bayesian strategy, which is as simple as specifying the hyperparameters to be tuned and the desired range of values, the evaluation metric (ROC (Receiver Operating Characteristic) AUC in this case) and the training and validation sets. For the PDF malware detector, SophosAI prioritized hyperparameters including the number of boosting rounds (num_round), the maximum tree depth (max_depth), the learning rate (eta), and the columns sampling ratio when building trees (colsample_bytree). Eventually, the best hyperparameters were obtained and used to train a model on the full dataset, and finally evaluated on the holdout test set.

The following plot shows the objective metric (ROC AUC) vs. the 15 training jobs run within the tuning job. The best hyperparameters are those corresponding to the ninth training job.

At the beginning of SophosAI’s experiments on SageMaker, an especially important question to answer was: what type of instances and how many of them are needed to train XGBoost on the data on hand? This is crucial because using the wrong number or type of instance can be a waste of time and money; the training is bound to fail due to running out of memory, or, if using too many too-large instances, this can become unnecessarily expensive.

XGBoost is a memory-bound (as opposed to compute-bound) algorithm. So, a general-purpose compute instance (for example, M5) is a better choice than a compute-optimized instance (for example, C4). To make an informed decision, there is a simple SageMaker guideline for picking the number of instances required to run training on the full dataset:

Total Training Data Size × Safety Factor(*) < Instance Count × Instance Type’s Total Memory

In this case: Total Training Data Size × Safety Factor (12) = 12120 GB

The following table summarizes the requirements when the chosen instance type is ml.m5.24xlarge.

Training Size × Safety Factor (12) Instance Memory ml.m5.24xlarge Minimum Instance Count Required for Training
12120 GB 384 GB 32

*Due to the nature of XGBoost distributed training, which requires the entire training dataset to be loaded into a DMatrix object before training and additional free memory, a safety factor of 10–12 is recommended.

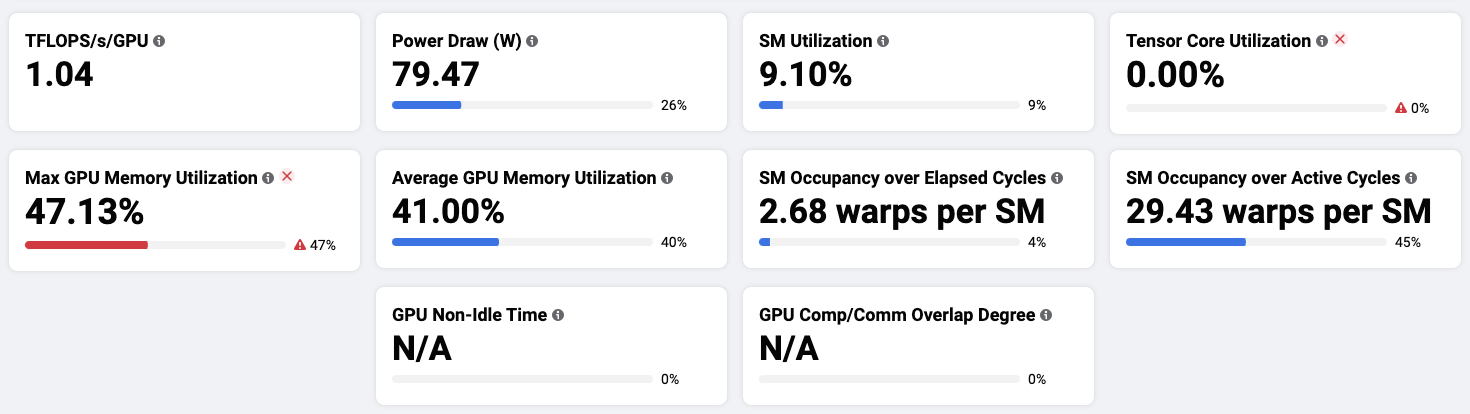
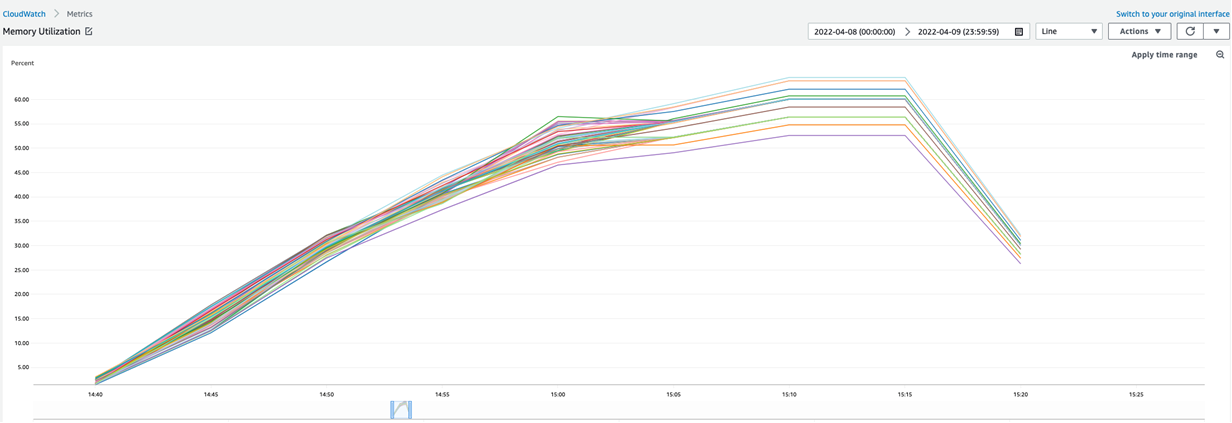
To take a closer look at the memory utilization for a full SageMaker training of XGBoost on the provided dataset, we provide the corresponding graph obtained from the training’s Amazon CloudWatch monitoring. For this training job, 40 ml.m5.24xlarge instances were used and maximum memory utilization reached around 62 %.

The engineering cost saved by integrating a managed ML service like SageMaker into the data pipeline is around 50%. The option to use Spot Instances for training and hyperparameter tuning jobs cut costs by an additional 63%.

Conclusion

With SageMaker, the SophosAI team could successfully resolve a complex high-priority project by building a lightweight PDF malware detection XGBoost model that is much smaller on disk (up to 25 times smaller) and in-memory (up to 5 times smaller) than its detector predecessor. It’s a small but mighty malware detector with ~0.99 AUC and a true positive rate of 0.99 and a false positive rate of . This model can be quickly retrained, and its performance can be easily monitored over time, because it takes less than 20 minutes to train it on more than 1 TB of data.

You can leverage SageMaker built-in algorithm XGBoost for building models with your tabular data at scale. Additionally, you can also try the new built-in Amazon SageMaker algorithms LightGBM, CatBoost, AutoGluon-Tabular and Tab Transformer as described in this blog.


About the authors

Salma Taoufiq is a Senior Data Scientist at Sophos, working at the intersection of machine learning and cybersecurity. With an undergraduate background in computer science, she graduated from the Central European University with a MSc. in Mathematics and Its Applications. When not developing a malware detector, Salma is an avid hiker, traveler, and consumer of thrillers.

Harini Kannan is a Data Scientist at SophosAI. She has been in security data science for ~4 years. She was previously the Principal Data Scientist at Capsule8, which got acquired by Sophos. She has given talks at CAMLIS, BlackHat (USA), Open Data Science Conference (East), Data Science Salon, PyData (Boston), and Data Connectors. Her areas of research include detecting hardware-based attacks using performance counters, user behavior analysis, interpretable ML, and unsupervised anomaly detection.

Hasan Poonawala is a Senior AI/ML Specialist Solutions Architect at AWS, based in London, UK. Hasan helps customers design and deploy machine learning applications in production on AWS. He has over 12 years of work experience as a data scientist, machine learning practitioner and software developer. In his spare time, Hasan loves to explore nature and spend time with friends and family.

Digant Patel is an Enterprise Support Lead at AWS. He works with customers to design, deploy and operate in cloud at scale. His areas of interest are MLOps and DevOps practices and how it can help customers in their cloud journey. Outside of work, he enjoys photography, playing volleyball and spending time with friends and family.

Read More

The Wheel Deal: ‘Racer RTX’ Demo Revs to Photorealistic Life, Built on NVIDIA Omniverse

NVIDIA artists ran their engines at full throttle for the stunning Racer RTX demo, which debuted at last week’s GTC keynote, showcasing the power of NVIDIA Omniverse and the new GeForce RTX 4090 GPU.

“Our goal was to create something that had never been done before,” said Gabriele Leone, creative director at NVIDIA, who led a team of over 30 artists working around the globe with nearly a dozen design tools to complete the project in just three months.

That something is a fully simulated, real-time playable environment — inspired by the team’s shared favorite childhood game, Re-Volt. In Racer RTX, radio-controlled cars zoom through Los Angeles streets, a desert and a chic loft bedroom.

The demo consists entirely of simulation, rather than animation. This means that its 1,800+ hand-modeled and textured 3D models — whether the radio-controlled cars or the dominos they knock over while racing — didn’t require traditional 3D design tasks like baking or pre-compute, which is the presetting of lighting for environments and other properties for assets.

Instead, the assets react to the changing virtual environment in real time while obeying the laws of physics. This is enabled by the real-time, advanced physics simulation engine, PhysX, which is built into NVIDIA Omniverse, a platform for connecting and building custom 3D pipelines and metaverse applications.

Dust trails are left behind by the cars depending on the turbulence from passing vehicles. And sand deforms under racers’ wheels according to how the tires drift.

And with the Omniverse RTX Renderer, lighting can be physically simulated with a click, changing throughout the environment and across surfaces based on whether it’s dawn, day or dusk in the scenes, which are set in Los Angeles’ buzzing beach town of Venice.


Connecting Apps and Workflows

Racer RTX was created to test the limits of the new NVIDIA Ada Lovelace architecture — and steer creators and developers toward a new future of their work.

“We wanted to demonstrate the next generation of content creation, where worlds will no longer be prebaked, but physically accurate, full simulations,” Leone said.

The result showcases high-fidelity, hyper-realistic physics and real-time ray tracing enabled by Omniverse — in 4K resolution at 60 frames per second, running with Ada and the new DLSS 3 technology.

“Our globally spread team used nearly a dozen different design and content-creation tools — bringing everything together in Omniverse using the ground-truth, extensible Universal Scene Description framework,” Leone added.

The NVIDIA artists began the project by sketching initial concept art and taking a slew of reference photos in the westside of LA. Next, they turned to software like Autodesk 3ds Max, Autodesk Maya, Blender, Cinema4D and many more to create the 3D assets, the vast majority of which were modeled by hand.

“Racer RTX” features over 1,800 unique 3D models.

To add texture to the props, the artists used Adobe Substance 3D Designer and Adobe Substance 3D Painter. They then exported the files from these apps using the USD open 3D framework — and brought them into Omniverse Create for real-time collaboration in the virtual world.

Hyper-Realistic Physics

The RC cars in Racer RTX are each modeled with up to 70 individual pieces, including joints and suspensions, all with physics properties.

“Each car, each domino, every object in the demo has a different center of mass and weight depending on real-world parameters, so they act differently according to the laws of physics,” Leone said. “We can change the material of the floors, too, from sand to wood to ice — and use Omniverse’s native PhysX feature to make the vehicles drift along the surface with physically accurate friction.”

Radio-controlled cars race through Los Angeles streets in “Racer RTX.”

And to make the dust kick up behind the cars as they would in the real world, the artists used the NVIDIA Flow application for smoke, fluid and fire simulation.

In addition, the team created their own tools for the project-specific workflow, including Omniverse extensions — core building blocks that enable anyone to create and extend functionalities of Omniverse apps with just a few lines of Python code — to randomize and align objects in the scene.

The extensions, 3D assets and environments for the Racer RTX demo will be packaged together and available for download in the coming months, so owners of the GeForce RTX 4090 GPU can gear up to explore the environment.

Learn More About Omniverse

Dive deeper into the making of Racer RTX in an on-demand NVIDIA GTC session — where Leone is joined by Andrew Averkin, senior art manager; Chase Telegin, technical director of software; and Nikolay Usov, senior environment artist at NVIDIA, to discuss how they built the large-scale, photorealistic virtual world.

Creators and developers across the world can download NVIDIA Omniverse for free, and enterprise teams can use the platform for their 3D projects.

Check out artwork from other “Omnivores” and submit projects in the gallery. Connect your workflows to Omniverse with software from Adobe, Autodesk, Epic Games, Maxon, Reallusion and more.

Follow NVIDIA Omniverse on Instagram, Twitter, YouTube and Medium for additional resources and inspiration. Check out the Omniverse forums, and join our Discord server and Twitch channel to chat with the community.

Watch NVIDIA founder and CEO Jensen Huang’s GTC keynote in replay:

The post The Wheel Deal: ‘Racer RTX’ Demo Revs to Photorealistic Life, Built on NVIDIA Omniverse appeared first on NVIDIA Blog.

Read More

All This and Mor-a Are Yours With Exclusive ‘Genshin Impact’ GeForce NOW Membership Reward

It’s good to be a GeForce NOW member.

Genshin Impact’s new Version 3.1 update launches this GFN Thursday, just in time for the game’s second anniversary. Even better: GeForce NOW members can get an exclusive starter pack reward, perfect for their first steps in HoYoverse’s open-world adventure, action role-playing game.

And don’t forget the nine new games joining the GeForce NOW library this week, because there’s always something new to play.

Get the Party Started in ‘Genshin Impact’

Genshin Impact Version 3.1, “King Deshret and the Three Magi,” has arrived in time for the game’s second anniversary. The latest update introduces the massive desert area, new characters, events, gifts and more — and it’s the perfect time for new players to start their adventure, streaming on GeForce NOW.

Genshin Impact 3.1 on GeForce NOW
Explore the area of death, mystery and technology alongside new characters in the update.

Step into the starkly beautiful desert to uncover the legends of King Deshret and clues to the past buried in the sand. In addition, three Sumeru characters, Candace, Cyno and Nilou, join the playable cast.

Far beyond the sweltering sands, celebrations for Mondstadt’s Weinlesefest are arriving as the crisp autumn wind blows, delivering more events with “Wind Chaser” and “Star-Seeker’s Sojourn,” mini-games, and rich rewards.

Genshin Impact GeForce NOW Membership Reward
Claim rewards to begin the adventures in “Genshin Impact.”

Members who’ve opted in to GeForce NOW’s Rewards program will receive an email for a Genshin Impact starter kit that can be claimed through the NVIDIA Rewards redemption portal. The kit will become available in game once players reach Adventure Rank 10.

The reward includes 30,000 Mora to purchase various items, three “Mystic Enhancement Ores” to enhance weapons and three “Hero’s Wit” points to level up characters.

Haven’t opted in for members’ rewards yet? Log in to your NVIDIA account and select “GEFORCE NOW” from the header, then scroll down to “REWARDS” and click the “UPDATE REWARDS SETTINGS” button. Check the box in the dialogue window that shows up to start receiving special offers and in-game goodies.

Better hurry — these rewards are available for a limited time on a first-come, first-serve basis. To get first dibs, upgrade to a GeForce NOW Priority or RTX 3080 membership to receive rewards before anyone else.

Moar Games Plz

Kena Bridge of Spirits on GeForce NOW
Untangle the past as Kena, a young Spirit Guide in search of the sacred Mountain Shrine in this story-driven action adventure.

Ready to get into the action? Here’s what’s joining the GeForce NOW library this week:

  • Dome Keeper (New release on Steam)
  • Terra Invicta (New release on Steam)
  • The Legend of Heroes: Trails from Zero (New release on Steam and Epic Games Store)
  • Kena: Bridge of Spirits (New release on Steam)
  • Brewmaster: Beer Brewing Simulator (New release on Steam, Sept. 29)
  • Ground Branch (Steam)
  • Jagged Alliance: Rage! (Steam)
  • River City Saga: Three Kingdoms (Steam)
  • Weable (Steam)

To start off your weekend gaming adventures, we’ve got a question for you. Let us know where you’d go on Twitter or in the comments below.

The post All This and Mor-a Are Yours With Exclusive ‘Genshin Impact’ GeForce NOW Membership Reward appeared first on NVIDIA Blog.

Read More

Performance Debugging of Production PyTorch Models at Meta

1. Meta’s AI Performance Profiling (MAIProf)

Figure 1: A simplified illustration of the Meta’s AI performance profiling (MAIProf) infrastructure.

Figure 1 gives a simplified illustration of the AI performance profiling infrastructure at Meta. ML research and performance engineers submit through the User Portal a profiling request for a training job to the Profiling Service, which subsequently broadcasts the request to all the GPU hosts running the training job. When the Monitoring Daemon on a GPU host receives the profiling request, it will notify the Kineto GPU tracer (built on top of NVIDIA’s libcupti) inside the PyTorch program corresponding to the training job. As a result, Kineto traces will be collected and uploaded to the Object Store asynchronously (in more details: there is one Kineto trace collected for each individual GPU, each is treated and stored as a blob; an example will be given in Section 2). Meanwhile, MAIProf also collects a variety of aggregated performance metrics: the Monitoring Daemon on every GPU host continuously reads performance counters from NVIDIA’s DCGM/NVML and logs them to a Time Series DB.

Once both trace and metrics collections are completed, the Profiling Service will automatically download traces from the Object Store for trace analysis and performance metrics from the Time Series DB for metric analysis. Finally, an overall profiling report with detailed and insightful analysis is delivered to the user.

To serve production uses, we deliberately made the following design choices for MAIProf:

  • No source-code change required in the PyTorch models: profiling is triggered by sampling the execution of an unmodified model for a user-specified amount of time.
  • Provide a holistic view of performance: MAIProf performs system-wide analysis that cover both CPU and GPU. Under the hood, it invokes various CPU tools (e.g., Python tracer, Autograd Observer) and GPU tools (e.g., Kineto, DCGM) and correlates their results.
  • Provide multiple tools that target a wide range of AI partitioners: At Meta, there are engineers with different backgrounds who may need to tune their AI workload performance. Some of them are AI experts while others are general software engineers. Therefore, MAIProf provides a variety of tools for different levels of performance debugging, from high-level automatic trace comprehension to low-level trace analysis.
  • Support distributed GPU profiling: MAIProf can collect profiling data from multiple hosts, each with multiple GPUs. It then shows a combined view/analysis of the entire system.
  • Highly scalable: MAIProf is built as a service on top of existing infrastructures in Meta data centers such as a scalable storage system called Manifold. Its profiling capability can be easily scaled by adding more machines in the service pool with the increase of workloads.

2. Case Study: Optimizing a Protection PyTorch Model

To be concrete, we use a case study on a protection PyTorch model used in production. First, we discuss our steps for identifying the performance bottlenecks in the model with MAIProf. Then we describe the corresponding optimizations applied and their impacts.

2.1 Performance Bottlenecks

Step 1:

Inspect the CPU and GPU utilization on the same timeline, as shown in Figure 2.

Figure 2: CPU usage over time (the top) vs. GPU usage over time (the bottom).

The first performance anomaly we noticed in Figure 2 is the pattern: “GPU-idle, GPU-active, GPU-idle, GPU-active …” throughout the training. Overall, the GPU is idle for more than half of the training time (this is bad for performance because the GPU is a higher-performance device and so we want it to be utilized as much as possible).

Step 2:

Collect a Python function call trace on the CPU with MAIProf while the GPU is idle, which is shown in Figure 3.

Figure 3: A Python call trace.

The Python trace shows that most of the CPU time is spent inside a Python function sharded_iterrows(). From the source code of the model, we learned that this function processes a big feature table in parallel. The number of worker threads used is controlled by a configurable parameter (num_worker_threads). Also, after investigating how the feature table is generated, we understood the performance anomaly: the training dataset is too large to fit in the CPU memory all at once; it needs to be broken into multiple sub-datasets, each has sufficient data for running 10 epochs. Consequently, a new sub-dataset needs to be read from the disk to memory every 10 epochs, during which the GPU is totally idle.

Step 3:

Collect GPU performance metrics, which is shown in Figure 4.

Figure 4: GPU performance metrics in MAIProf.

We made the following observations from Figure 4:

  • The streaming multiprocessor (SM) runs the model’s CUDA kernels. Its utilization [1] is 9.1%, indicating that the parallel compute units on the GPU are not well utilized.
  • Tensor Core utilization is 0, meaning that Tensor Core (the mixed-precision compute unit on GPU) [2] is not used at all.
  • Max GPU memory utilization is 47.13%, indicating that half of the GPU memory is left unused.

Step 4:

Collect a GPU trace (aka Kineto trace) of the training loop as shown in Figure 5.

Figure 5: A GPU trace (aka Kineto trace) of the training loop.

Since commonly used PyTorch functions are already annotated, their names are automatically shown on the trace. With them, we can roughly divide the trace into the four phases in a training iteration: (1) data loading, (2) forward pass, (3) backward pass, (4) gradient optimization (note: In Figure 5, the “optimizer” phase is from the previous batch while the other three phases are from the current batch).

2.2 Optimizations

We performed four simple optimizations that target the bottlenecks identified above, each requiring only a change in a config parameter or at most a few source lines. They are listed in Figure 6.

Optimization Amount of changes Bottlenecks addressed
Tune num_worker_threads by trying a few possible values within the number of CPU cores on each host. 1 source line GPU totally idle time
Double the batch sizes 2 config parameters GPU memory under-utilization
Use automatic mixed precision in PyTorch 13 source lines Zero Tensor Core utilization
Use mulitensor optimizer in PyTorch 1 source line Many small GPU kernels in the optimizer

Figure 6: Four simple optimizations applied.

3. Concluding Remarks

Performance tuning for PyTorch in production environments is increasingly important. A capable performance-debugging tool is a key to this process. We demonstrate with a case study on a production model that MAIProf is a powerful infrastructure for identifying optimization opportunities.

At Meta, MAIProf has been used by 100s of engineers, from performance novices to experts, to identify many more types of bottlenecks. These include slow data loading, small and/or slow GPU kernels, distributed training issues such as load imbalance and excessive communication. MAIProf covers major classes of models, including recommendation, vision, and natural language processing. In summary, it is now an indispensable tool for tuning the performance of production PyTorch workloads.

References

[1] https://docs.nvidia.com/gameworks/content/developertools/desktop/analysis/report/ cudaexperiments/kernellevel/achievedoccupancy.htm

[2] https://www.nvidia.com/en-us/data-center/tensor-cores/

Read More