ZOO Digital provides end-to-end localization and media services to adapt original TV and movie content to different languages, regions, and cultures. It makes globalization easier for the world’s best content creators. Trusted by the biggest names in entertainment, ZOO Digital delivers high-quality localization and media services at scale, including dubbing, subtitling, scripting, and compliance.
Typical localization workflows require manual speaker diarization, wherein an audio stream is segmented based on the identity of the speaker. This time-consuming process must be completed before content can be dubbed into another language. With manual methods, a 30-minute episode can take between 1–3 hours to localize. Through automation, ZOO Digital aims to achieve localization in under 30 minutes.
In this post, we discuss deploying scalable machine learning (ML) models for diarizing media content using Amazon SageMaker, with a focus on the WhisperX model.
Background
ZOO Digital’s vision is to provide a faster turnaround of localized content. This goal is bottlenecked by the manually intensive nature of the exercise compounded by the small workforce of skilled people that can localize content manually. ZOO Digital works with over 11,000 freelancers and localized over 600 million words in 2022 alone. However, the supply of skilled people is being outstripped by the increasing demand for content, requiring automation to assist with localization workflows.
With an aim to accelerate the localization of content workflows through machine learning, ZOO Digital engaged AWS Prototyping, an investment program by AWS to co-build workloads with customers. The engagement focused on delivering a functional solution for the localization process, while providing hands-on training to ZOO Digital developers on SageMaker, Amazon Transcribe, and Amazon Translate.
Customer challenge
After a title (a movie or an episode of a TV series) has been transcribed, speakers must be assigned to each segment of speech so that they can be correctly assigned to the voice artists that are cast to play the characters. This process is called speaker diarization. ZOO Digital faces the challenge of diarizing content at scale while being economically viable.
Solution overview
In this prototype, we stored the original media files in a specified Amazon Simple Storage Service (Amazon S3) bucket. This S3 bucket was configured to emit an event when new files are detected within it, triggering an AWS Lambda function. For instructions on configuring this trigger, refer to the tutorial Using an Amazon S3 trigger to invoke a Lambda function. Subsequently, the Lambda function invoked the SageMaker endpoint for inference using the Boto3 SageMaker Runtime client.
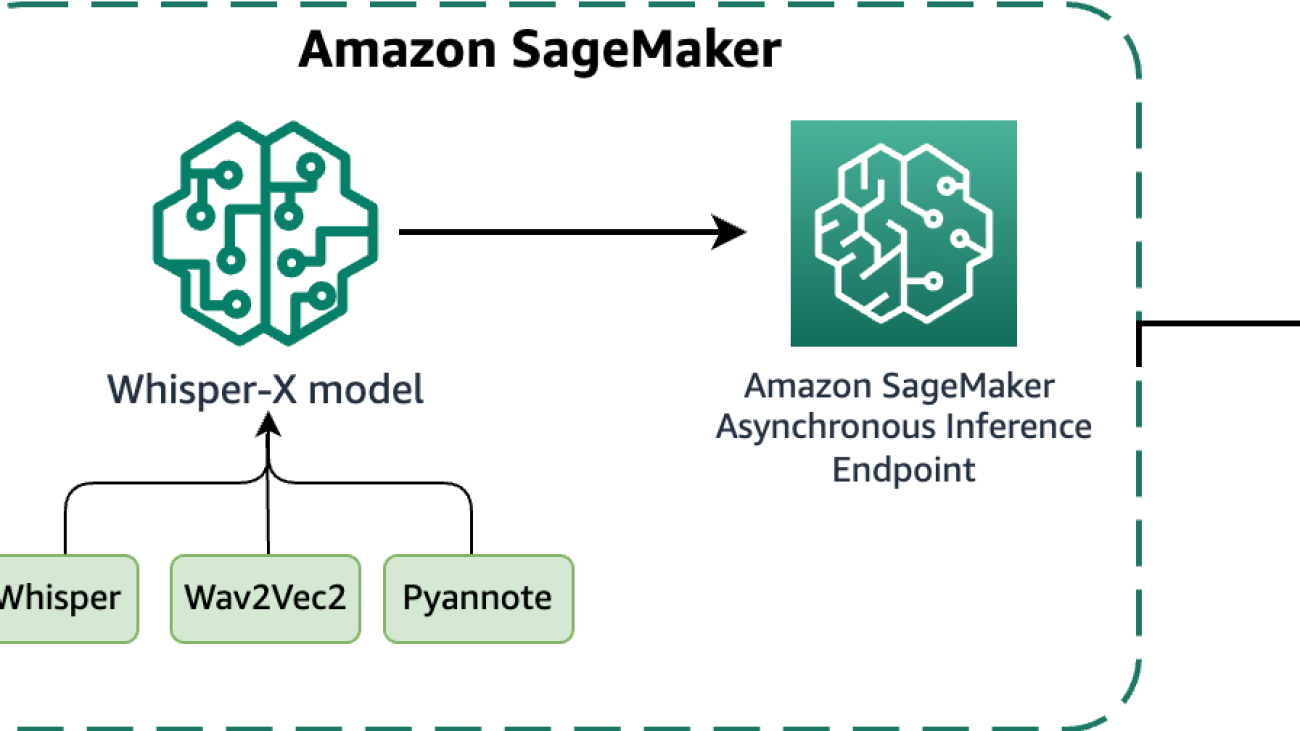
The WhisperX model, based on OpenAI’s Whisper, performs transcriptions and diarization for media assets. It’s built upon the Faster Whisper reimplementation, offering up to four times faster transcription with improved word-level timestamp alignment compared to Whisper. Additionally, it introduces speaker diarization, not present in the original Whisper model. WhisperX utilizes the Whisper model for transcriptions, the Wav2Vec2 model to enhance timestamp alignment (ensuring synchronization of transcribed text with audio timestamps), and the pyannote model for diarization. FFmpeg is used for loading audio from source media, supporting various media formats. The transparent and modular model architecture allows flexibility, because each component of the model can be swapped out as needed in the future. However, it’s essential to note that WhisperX lacks full management features and isn’t an enterprise-level product. Without maintenance and support, it may not be suitable for production deployment.
In this collaboration, we deployed and evaluated WhisperX on SageMaker, using an asynchronous inference endpoint to host the model. SageMaker asynchronous endpoints support upload sizes up to 1 GB and incorporate auto scaling features that efficiently mitigate traffic spikes and save costs during off-peak times. Asynchronous endpoints are particularly well-suited for processing large files, such as movies and TV series in our use case.
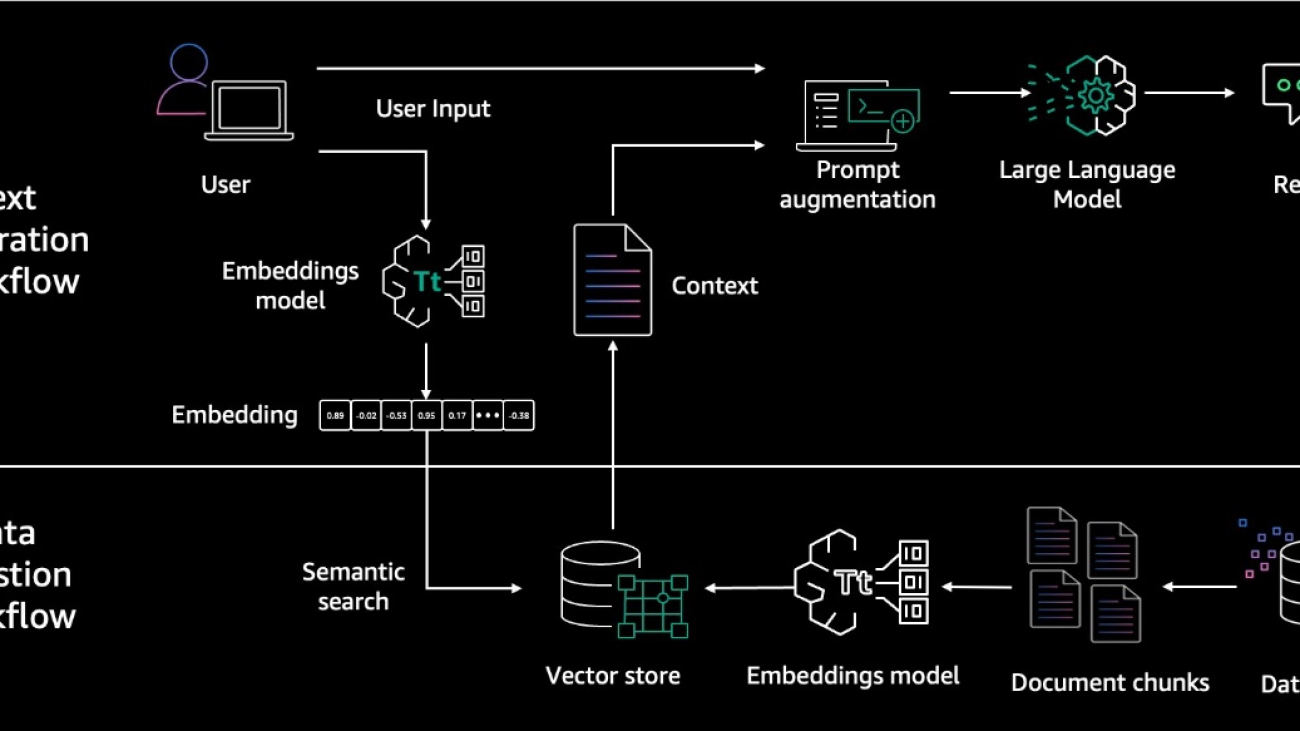
The following diagram illustrates the core elements of the experiments we conducted in this collaboration.

In the following sections, we delve into the details of deploying the WhisperX model on SageMaker, and evaluate the diarization performance.
Download the model and its components
WhisperX is a system that includes multiple models for transcription, forced alignment, and diarization. For smooth SageMaker operation without the need to fetch model artifacts during inference, it’s essential to pre-download all model artifacts. These artifacts are then loaded into the SageMaker serving container during initiation. Because these models aren’t directly accessible, we offer descriptions and sample code from the WhisperX source, providing instructions on downloading the model and its components.
WhisperX uses six models:
- A Faster Whisper model
- A Voice Activity Detection (VAD) model
- A Wav2Vec2 model
- pyannote’s Speaker Diarization model
- pyannote’s Segmentation model
- SpeechBrain’s Speaker Embedding model
Most of these models can be obtained from Hugging Face using the huggingface_hub library. We use the following download_hf_model() function to retrieve these model artifacts. An access token from Hugging Face, generated after accepting the user agreements for the following pyannote models, is required:
import huggingface_hub
import yaml
import torchaudio
import urllib.request
import os

CONTAINER_MODEL_DIR = "/opt/ml/model"
WHISPERX_MODEL = "guillaumekln/faster-whisper-large-v2"
VAD_MODEL_URL = "https://whisperx.s3.eu-west-2.amazonaws.com/model_weights/segmentation/0b5b3216d60a2d32fc086b47ea8c67589aaeb26b7e07fcbe620d6d0b83e209ea/pytorch_model.bin"
WAV2VEC2_MODEL = "WAV2VEC2_ASR_BASE_960H"
DIARIZATION_MODEL = "pyannote/speaker-diarization"

def download_hf_model(model_name: str, hf_token: str, local_model_dir: str) -> str:
    """
    Fetches the provided model from HuggingFace and returns the subdirectory it is downloaded to
    :param model_name: HuggingFace model name (and an optional version, appended with @[version])
    :param hf_token: HuggingFace access token authorized to access the requested model
    :param local_model_dir: The local directory to download the model to
    :return: The subdirectory within local_modeL_dir that the model is downloaded to
    """
    model_subdir = model_name.split('@')[0]
    huggingface_hub.snapshot_download(model_subdir, token=hf_token, local_dir=f"{local_model_dir}/{model_subdir}", local_dir_use_symlinks=False)
    return model_subdir
The VAD model is fetched from Amazon S3, and the Wav2Vec2 model is retrieved from the torchaudio.pipelines module. Based on the following code, we can retrieve all the models’ artifacts, including those from Hugging Face, and save them to the specified local model directory:
def fetch_models(hf_token: str, local_model_dir="./models"):
    """
    Fetches all required models to run WhisperX locally without downloading models every time
    :param hf_token: A huggingface access token to download the models
    :param local_model_dir: The directory to download the models to
    """
    # Fetch Faster Whisper's Large V2 model from HuggingFace
    download_hf_model(model_name=WHISPERX_MODEL, hf_token=hf_token, local_model_dir=local_model_dir)

    # Fetch WhisperX's VAD Segmentation model from S3
    vad_model_dir = "whisperx/vad"
    if not os.path.exists(f"{local_model_dir}/{vad_model_dir}"):
        os.makedirs(f"{local_model_dir}/{vad_model_dir}")

    urllib.request.urlretrieve(VAD_MODEL_URL, f"{local_model_dir}/{vad_model_dir}/pytorch_model.bin")

    # Fetch the Wav2Vec2 alignment model
    torchaudio.pipelines.__dict__[WAV2VEC2_MODEL].get_model(dl_kwargs={"model_dir": f"{local_model_dir}/wav2vec2/"})

    # Fetch pyannote's Speaker Diarization model from HuggingFace
    download_hf_model(model_name=DIARIZATION_MODEL,
                      hf_token=hf_token,
                      local_model_dir=local_model_dir)

    # Read in the Speaker Diarization model config to fetch models and update with their local paths
    with open(f"{local_model_dir}/{DIARIZATION_MODEL}/config.yaml", 'r') as file:
        diarization_config = yaml.safe_load(file)

    embedding_model = diarization_config['pipeline']['params']['embedding']
    embedding_model_dir = download_hf_model(model_name=embedding_model,
                                            hf_token=hf_token,
                                            local_model_dir=local_model_dir)
    diarization_config['pipeline']['params']['embedding'] = f"{CONTAINER_MODEL_DIR}/{embedding_model_dir}"

    segmentation_model = diarization_config['pipeline']['params']['segmentation']
    segmentation_model_dir = download_hf_model(model_name=segmentation_model,
                                               hf_token=hf_token,
                                               local_model_dir=local_model_dir)
    diarization_config['pipeline']['params']['segmentation'] = f"{CONTAINER_MODEL_DIR}/{segmentation_model_dir}/pytorch_model.bin"

    with open(f"{local_model_dir}/{DIARIZATION_MODEL}/config.yaml", 'w') as file:
        yaml.safe_dump(diarization_config, file)

    # Read in the Speaker Embedding model config to update it with its local path
    speechbrain_hyperparams_path = f"{local_model_dir}/{embedding_model_dir}/hyperparams.yaml"
    with open(speechbrain_hyperparams_path, 'r') as file:
        speechbrain_hyperparams = file.read()

    speechbrain_hyperparams = speechbrain_hyperparams.replace(embedding_model_dir, f"{CONTAINER_MODEL_DIR}/{embedding_model_dir}")

    with open(speechbrain_hyperparams_path, 'w') as file:
        file.write(speechbrain_hyperparams)
Select the appropriate AWS Deep Learning Container for serving the model
After the model artifacts are saved using the preceding sample code, you can choose pre-built AWS Deep Learning Containers (DLCs) from the following GitHub repo. When selecting the Docker image, consider the following settings: framework (Hugging Face), task (inference), Python version, and hardware (for example, GPU). We recommend using the following image: 763104351884.dkr.ecr.[REGION].amazonaws.com/huggingface-pytorch-inference:2.0.0-transformers4.28.1-gpu-py310-cu118-ubuntu20.04 This image has all the necessary system packages pre-installed, such as ffmpeg. Remember to replace [REGION] with the AWS Region you are using.
For other required Python packages, create a requirements.txt file with a list of packages and their versions. These packages will be installed when the AWS DLC is built. The following are the additional packages needed to host the WhisperX model on SageMaker:
Create an inference script to load the models and run inference
Next, we create a custom inference.py script to outline how the WhisperX model and its components are loaded into the container and how the inference process should be run. The script contains two functions: model_fn and transform_fn. The model_fn function is invoked to load the models from their respective locations. Subsequently, these models are passed to the transform_fn function during inference, where transcription, alignment, and diarization processes are performed. The following is a code sample for inference.py:
import io
import json
import logging
import tempfile
import time

import torch
import whisperx

DEVICE = 'cuda' if torch.cuda.is_available() else 'cpu'

def model_fn(model_dir: str) -> dict:
    """
    Deserialize and return the models
    """
    logging.info("Loading WhisperX model")
    model = whisperx.load_model(whisper_arch=f"{model_dir}/guillaumekln/faster-whisper-large-v2",
                                device=DEVICE,
                                language="en",
                                compute_type="float16",
                                vad_options={'model_fp': f"{model_dir}/whisperx/vad/pytorch_model.bin"})

    logging.info("Loading alignment model")
    align_model, metadata = whisperx.load_align_model(language_code="en",
                                                      device=DEVICE,
                                                      model_name="WAV2VEC2_ASR_BASE_960H",
                                                      model_dir=f"{model_dir}/wav2vec2")

    logging.info("Loading diarization model")
    diarization_model = whisperx.DiarizationPipeline(model_name=f"{model_dir}/pyannote/speaker-diarization/config.yaml",
                                                     device=DEVICE)

    return {
        'model': model,
        'align_model': align_model,
        'metadata': metadata,
        'diarization_model': diarization_model
    }

def transform_fn(model: dict, request_body: bytes, request_content_type: str, response_content_type="application/json") -> (str, str):
    """
    Load in audio from the request, transcribe and diarize, and return JSON output
    """

    # Start a timer so that we can log how long inference takes
    start_time = time.time()

    # Unpack the models
    whisperx_model = model['model']
    align_model = model['align_model']
    metadata = model['metadata']
    diarization_model = model['diarization_model']

    # Load the media file (the request_body as bytes) into a temporary file, then use WhisperX to load the audio from it
    logging.info("Loading audio")
    with io.BytesIO(request_body) as file:
        tfile = tempfile.NamedTemporaryFile(delete=False)
        tfile.write(file.read())
        audio = whisperx.load_audio(tfile.name)

    # Run transcription
    logging.info("Transcribing audio")
    result = whisperx_model.transcribe(audio, batch_size=16)

    # Align the outputs for better timings
    logging.info("Aligning outputs")
    result = whisperx.align(result["segments"], align_model, metadata, audio, DEVICE, return_char_alignments=False)

    # Run diarization
    logging.info("Running diarization")
    diarize_segments = diarization_model(audio)
    result = whisperx.assign_word_speakers(diarize_segments, result)

    # Calculate the time it took to perform the transcription and diarization
    end_time = time.time()
    elapsed_time = end_time - start_time
    logging.info(f"Transcription and Diarization took {int(elapsed_time)} seconds")

    # Return the results to be stored in S3
    return json.dumps(result), response_content_type
Within the model’s directory, alongside the requirements.txt file, ensure the presence of inference.py in a code subdirectory. The models directory should resemble the following:
Create a tarball of the models
After you create the models and code directories, you can use the following command lines to compress the model into a tarball (.tar.gz file) and upload it to Amazon S3. At the time of writing, using the faster-whisper Large V2 model, the resulting tarball representing the SageMaker model is 3 GB in size. For more information, refer to Model hosting patterns in Amazon SageMaker, Part 2: Getting started with deploying real time models on SageMaker.
Create a SageMaker model and deploy an endpoint with an asynchronous predictor
Now you can create the SageMaker model, endpoint config, and asynchronous endpoint with AsyncPredictor using the model tarball created in the previous step. For instructions, refer to Create an Asynchronous Inference Endpoint.
Evaluate diarization performance
To assess the diarization performance of the WhisperX model in various scenarios, we selected three episodes each from two English titles: one drama title consisting of 30-minute episodes, and one documentary title consisting of 45-minute episodes. We utilized pyannote’s metrics toolkit, pyannote.metrics, to calculate the diarization error rate (DER). In the evaluation, manually transcribed and diarized transcripts provided by ZOO served as the ground truth.
We defined the DER as follows:

Total is the length of the ground truth video. FA (False Alarm) is the length of segments that are considered as speech in predictions, but not in ground truth. Miss is the length of segments that are considered as speech in ground truth, but not in prediction. Error, also called Confusion, is the length of segments that are assigned to different speakers in prediction and ground truth. All the units are measured in seconds. The typical values for DER can vary depending on the specific application, dataset, and the quality of the diarization system. Note that DER can be larger than 1.0. A lower DER is better.
To be able to calculate the DER for a piece of media, a ground truth diarization is required as well as the WhisperX transcribed and diarized outputs. These must be parsed and result in lists of tuples containing a speaker label, speech segment start time, and speech segment end time for each segment of speech in the media. The speaker labels don’t need to match between the WhisperX and ground truth diarizations. The results are based mostly on the time of the segments. pyannote.metrics takes these tuples of ground truth diarizations and output diarizations (referred to in the pyannote.metrics documentation as reference and hypothesis) to calculate the DER. The following table summarizes our results.
| Video Type | DER | Correct | Miss | Error | False Alarm |
| Drama | 0.738 | 44.80% | 21.80% | 33.30% | 18.70% |
| Documentary | 1.29 | 94.50% | 5.30% | 0.20% | 123.40% |
| Average | 0.901 | 71.40% | 13.50% | 15.10% | 61.50% |
These results reveal a significant performance difference between the drama and documentary titles, with the model achieving notably better results (using DER as an aggregate metric) for the drama episodes compared to the documentary title. A closer analysis of the titles provides insights into potential factors contributing to this performance gap. One key factor could be the frequent presence of background music overlapping with speech in the documentary title. Although preprocessing media to enhance diarization accuracy, such as removing background noise to isolate speech, was beyond the scope of this prototype, it opens avenues for future work that could potentially enhance the performance of WhisperX.
Conclusion
In this post, we explored the collaborative partnership between AWS and ZOO Digital, employing machine learning techniques with SageMaker and the WhisperX model to enhance the diarization workflow. The AWS team played a pivotal role in assisting ZOO in prototyping, evaluating, and understanding the effective deployment of custom ML models, specifically designed for diarization. This included incorporating auto scaling for scalability using SageMaker.
Harnessing AI for diarization will lead to substantial savings in both cost and time when generating localized content for ZOO. By aiding transcribers in swiftly and precisely creating and identifying speakers, this technology addresses the traditionally time-consuming and error-prone nature of the task. The conventional process often involves multiple passes through the video and additional quality control steps to minimize errors. The adoption of AI for diarization enables a more targeted and efficient approach, thereby increasing productivity within a shorter timeframe.
We’ve outlined key steps to deploy the WhisperX model on the SageMaker asynchronous endpoint, and encourage you to try it yourself using the provided code. For further insights into ZOO Digital’s services and technology, visit ZOO Digital’s official site. For details on deploying the OpenAI Whisper model on SageMaker and various inference options, refer to Host the Whisper Model on Amazon SageMaker: exploring inference options. Feel free to share your thoughts in the comments.
About the Authors
 Ying Hou, PhD, is a Machine Learning Prototyping Architect at AWS. Her primary areas of interest encompass Deep Learning, with a focus on GenAI, Computer Vision, NLP, and time series data prediction. In her spare time, she relishes spending quality moments with her family, immersing herself in novels, and hiking in the national parks of the UK.
 Ethan Cumberland is an AI Research Engineer at ZOO Digital, where he works on using AI and Machine Learning as assistive technologies to improve workflows in speech, language, and localisation. He has a background in software engineering and research in the security and policing domain, focusing on extracting structured information from the web and leveraging open-source ML models for analysing and enriching collected data.
 Gaurav Kaila leads the AWS Prototyping team for UK & Ireland. His team works with customers across diverse industries to ideate & co-develop business critical workloads with a mandate to accelerate adoption of AWS services.


 Ram Vegiraju is a ML Architect with the SageMaker Service team. He focuses on helping customers build and optimize their AI/ML solutions on Amazon SageMaker. In his spare time, he loves traveling and writing.
 Qingwei Li is a Machine Learning Specialist at Amazon Web Services. He received his Ph.D. in Operations Research after he broke his advisor’s research grant account and failed to deliver the Nobel Prize he promised. Currently he helps customers in the financial service and insurance industry build machine learning solutions on AWS. In his spare time, he likes reading and teaching.
 James Wu is a Senior AI/ML Specialist Solution Architect at AWS. helping customers design and build AI/ML solutions. James’s work covers a wide range of ML use cases, with a primary interest in computer vision, deep learning, and scaling ML across the enterprise. Prior to joining AWS, James was an architect, developer, and technology leader for over 10 years, including 6 years in engineering and 4 years in marketing & advertising industries.
 Saurabh Trikande is a Senior Product Manager for Amazon SageMaker Inference. He is passionate about working with customers and is motivated by the goal of democratizing machine learning. He focuses on core challenges related to deploying complex ML applications, multi-tenant ML models, cost optimizations, and making deployment of deep learning models more accessible. In his spare time, Saurabh enjoys hiking, learning about innovative technologies, following TechCrunch and spending time with his family.
 Xu Deng is a Software Engineer Manager with the SageMaker team. He focuses on helping customers build and optimize their AI/ML inference experience on Amazon SageMaker. In his spare time, he loves traveling and snowboarding.
 Siddharth Venkatesan is a Software Engineer in AWS Deep Learning. He currently focusses on building solutions for large model inference. Prior to AWS he worked in the Amazon Grocery org building new payment features for customers world-wide. Outside of work, he enjoys skiing, the outdoors, and watching sports.
 Rohith Nallamaddi is a Software Development Engineer at AWS. He works on optimizing deep learning workloads on GPUs, building high performance ML inference and serving solutions. Prior to this, he worked on building microservices based on AWS for Amazon F3 business. Outside of work he enjoys playing and watching sports.


 Note the knowledge base creation process begins and the status is In progress. It will take a few minutes to create the vector store and knowledge base. Don’t navigate away from the page, otherwise creation will fail.


 Manish Chugh is a Principal Solutions Architect at AWS based in San Francisco, CA. He specializes in machine learning and generative AI. He works with organizations ranging from large enterprises to early-stage startups on problems related to machine learning. His role involves helping these organizations architect scalable, secure, and cost-effective workloads on AWS. He regularly presents at AWS conferences and other partner events. Outside of work, he enjoys hiking on East Bay trails, road biking, and watching (and playing) cricket.
 Mani Khanuja is a Tech Lead – Generative AI Specialists, author of the book Applied Machine Learning and High Performance Computing on AWS, and a member of the Board of Directors for Women in Manufacturing Education Foundation Board. She leads machine learning projects in various domains such as computer vision, natural language processing, and generative AI. She speaks at internal and external conferences such AWS re:Invent, Women in Manufacturing West, YouTube webinars, and GHC 23. In her free time, she likes to go for long runs along the beach.
 Pallavi Nargund is a Principal Solutions Architect at AWS. In her role as a cloud technology enabler, she works with customers to understand their goals and challenges, and give prescriptive guidance to achieve their objective with AWS offerings. She is passionate about women in technology and is a core member of Women in AI/ML at Amazon. She speaks at internal and external conferences such as AWS re:Invent, AWS Summits, and webinars. Outside of work she enjoys volunteering, gardening, cycling and hiking.