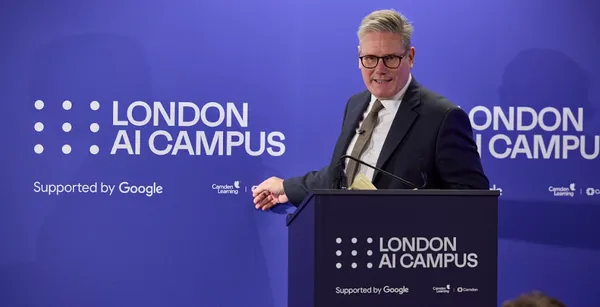
 Google has launched the AI Campus in Somers Town, Camden, home to a two-year education pilot aimed to help inspire, inform, and educate local sixth form students in the …Read More
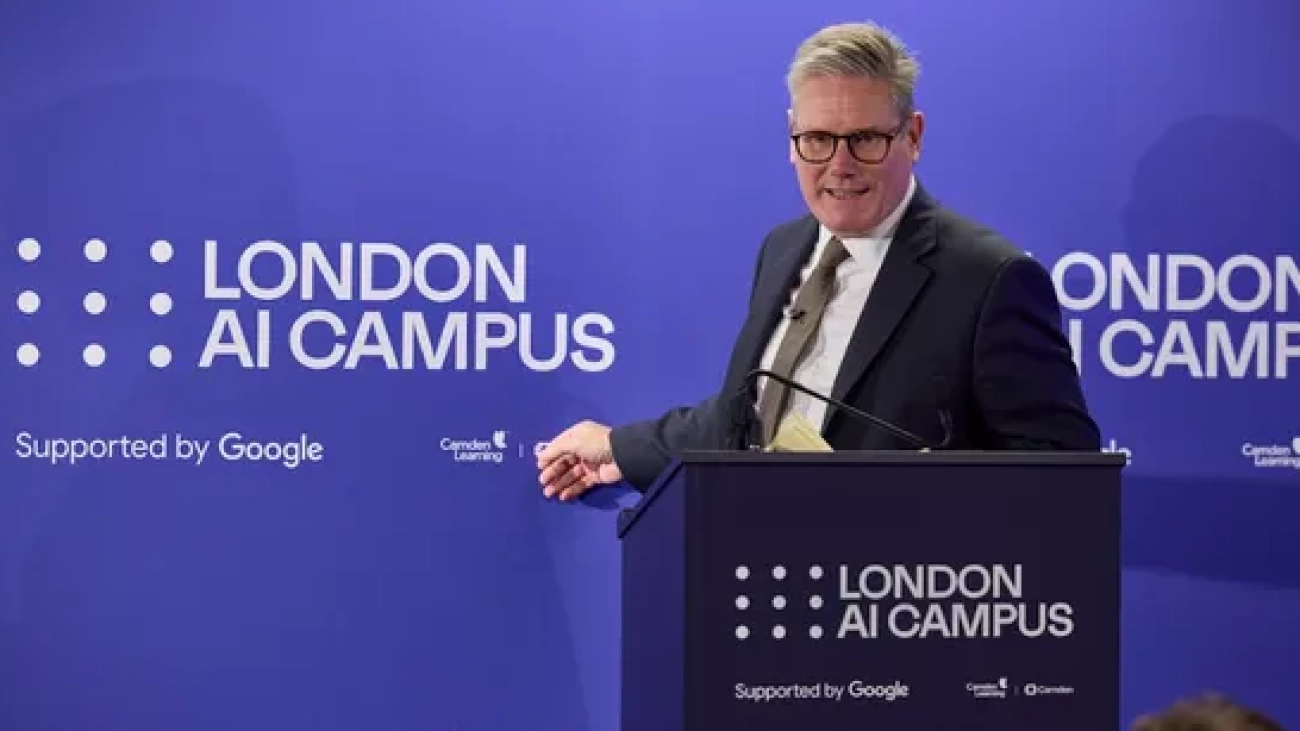
Google has launched the AI Campus in Somers Town, Camden, home to a two-year education pilot aimed to help inspire, inform, and educate local sixth form students in the …Read More

 New UK research commissioned by Google Cloud highlights the transformative potential of generative AI in the public sector.Read More

 From Google Arts & Culture to GenChess, discover new ways to experience chess with AI and explore the history of this timeless game.Read More
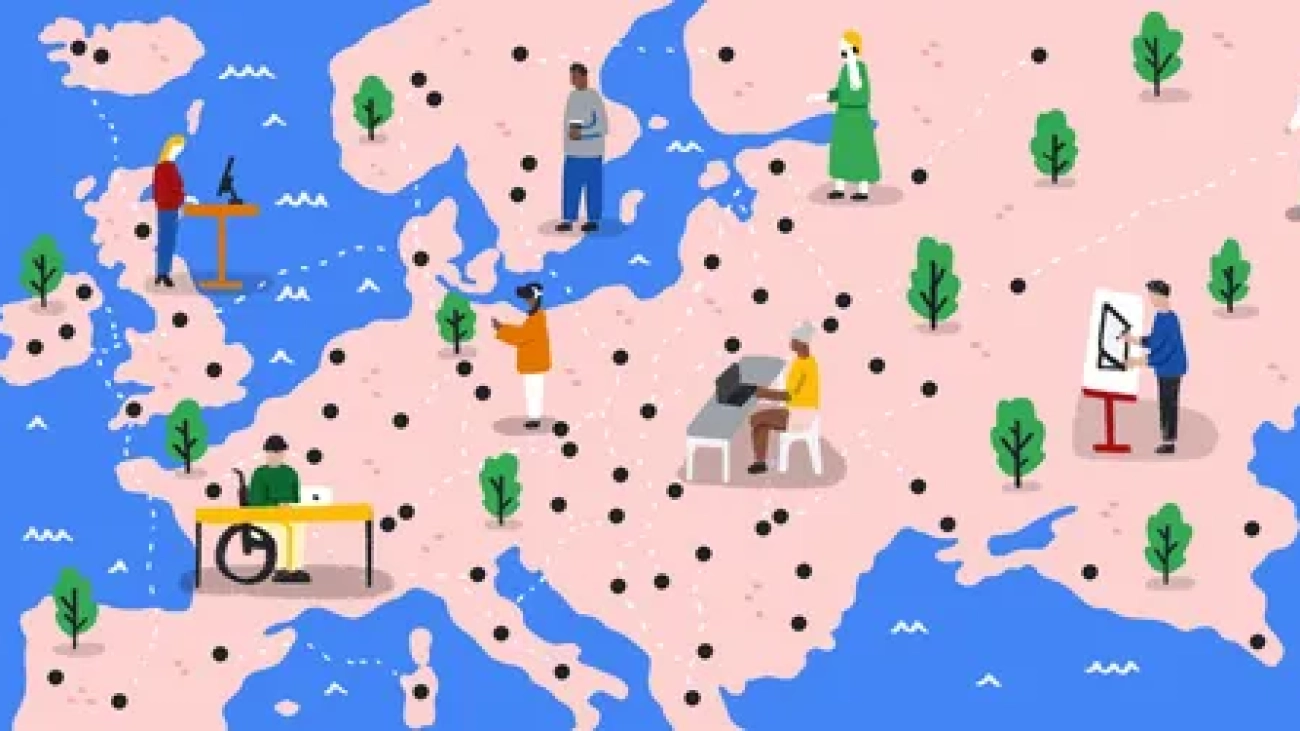
 Google.org announced the 80 organizations that will receive funding and support from the AI Opportunity Fund: Europe to help 20,000 people learn AI skills.Read More
 Google is releasing a report on music AI technology insights from co-creation sessions with artists, musicians and producers.Read More

 Whether you need help perfecting a presentation or practising a tough talk with your boss, here’s how Gemini Live can step in to help.Read More
 Go behind the scenes in our latest Lab Session.Read More
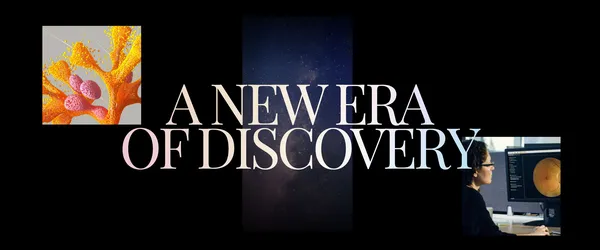 James Manyika’s opening remarks from the AI for Science Forum.Read More
 Google.org announced a $20 million commitment to support AI for scientific breakthroughs. Learn more about what the commitment entailsRead More
 Google DeepMind and the Royal Society are co-hosting the AI for Science Forum to explore how AI is rapidly accelerating science.Read More