Understanding the Shape of Large-Scale Data

Understanding the Shape of Large-Scale Data

Posted by Anton Tsitsulin, Research Intern and Bryan Perozzi, Senior Research Scientist, Graph Mining Team, Google Research

Understanding the differences and similarities between complex datasets is an interesting challenge that often arises when working with data. One way to formalize this question is to view each dataset as a graph, a mathematical model for how items relate to each other. Graphs are widely used to model relationships between objects — the Internet graph connects pages referencing each other, social graphs link together friends, and molecule graphs connect atoms bonding with each other.

Graphs are discrete objects that can model the relationships between many different types of data, including web pages (left), social connections (center), or molecules (right).

Once there is a collection of multiple graphs, it is common to want to predict some property of each one as an aggregate (i.e., one label per graph). For example, consider the task of predicting protein function from structure: each dataset here is one protein, and the prediction task is whether the final structure encodes an enzyme or not. Since one wants a model to actually compute the prediction, we need a representation that lets us generalize across different protein structures. Ideally, one would want a way to represent graphs as vectors without costly labelling. The problem becomes harder with increasing graph size — in the molecule case humans possess some knowledge about their properties, however, reasoning about larger, more complex datasets becomes increasingly difficult.

In this post we highlight some recent advances in the area of graph representation learning with “Just SLaQ When You Approximate: Accurate Spectral Distances for Web-Scale Graphs” (published at WWW’20), a publication that improves on the scalability of our earlier research, “DDGK: Learning Graph Representations for Deep Divergence Graph Kernels” (published at WWW’19). SLaQ introduces a way to scale computations to approximate a certain class of graph statistics, allowing one to quickly and efficiently characterize large graphs. We are also happy to announce that we have released the code for both papers in the Google Research GitHub repository for graph embeddings.

Fully Unsupervised Learning of Graph Similarity
In our 2019 paper, we showed that it is possible to learn representations for graph similarity with neither domain knowledge nor supervision. We propose deep divergence graph kernels (DDGK), an unsupervised method for learning representations over graphs that encode mappings of similarities between them. Unlike previous work, our unsupervised method jointly learns node representations, graph representations, and an attention-based alignment between graphs.

Here is a t-SNE visualization of the latent representations learned by DDGK to compare proteins. Blue points indicate proteins that encode enzymes and the red points are for those that do not. We can see that the encoding correlates with a structural property of the protein (whether or not it encodes enzymes), even though this context was not provided during training. (Note that this is a projection of the representations, and so the absolute axis values aren’t meaningful.)

In the example above, we demonstrate how these representations can automatically learn to represent graphs and align them in a way that encodes their latent functional similarity. Experiments on other datasets show we can capture similarities and differences across graphs of different types (language, biology, and social interactions).

The pairwise distance between different datasets encoded and aligned using DDGK. Color indicates distance in the latent space, and the scale of similarity ranges from 0 (identical) to 1.0 (very different). We see that the representations can be clustered to group similar datasets together — for example, the datasets nci1 and ptc are both datasets of chemical compounds.

Fast and Accurate Approximation of Spectral Descriptors
A graph’s spectrum is a powerful representation that encodes its properties, including connectivity patterns between graph nodes and clustering information. The spectrum has been shown to convey rich information about the properties of different objects such as the sound of a drum, 3D shapes, graphs, and general high-dimensional data. Applications of spectral graph descriptors include AutoML systems, anomaly detection in dynamic graphs, and chemical molecule characterization.

Currently, learning-based systems such as DDGK do not scale to either large graphs or large graph collections. Alternatively, one can use the spectral information without the learning component to attain more desirable scaling properties. However, computing spectral descriptors for large graphs is computationally prohibitive. Our more recent paper addresses this problem by proposing SLaQ, a method for approximating a family of graph descriptors. Our approach uses a randomized approximation algorithm for computing traces of spectrum functions that allows us to study several well-known spectral graph characteristics like Von Neumann Graph Entropy, Estrada Index, graph energy, and NetLSD.

For example, we use SLaQ to monitor anomalous changes in the Wikipedia graph structure. SLaQ allows us to discern meaningful changes in the structure of the page graph from trivial ones such as mass page renames. Our experiments show two orders of magnitude improvement in approximation accuracy, on average.

Left: The well-known Karate graph represents the social interactions of two martial arts clubs. Right: The spectral descriptors (NetLSD, VNGE, and Estrada Index) computed for the original graph in blue and the version with removed edges in red.

Conclusions
Unsupervised representation learning for graphs is an important problem, and we believe that the methods we highlight here are exciting steps forward in this area! Specifically, SLaQ allows us to compute principled representations for vast datasets, and DDGK introduces a mechanism for automatically learning alignments between datasets. We hope that our contributions will help advance the analysis of large datasets, and will be useful for understanding changes to time-varying graph datasets, like those used in recommendation systems.

Acknowledgements
We thank Marina Munkhoeva, Rami Al-Rfou, and Dustin Zelle who contributed to these works. For more information on the Graph Mining team (part of Algorithm and Optimization Group) visit our pages.

AI and Efficiency

AI and Efficiency

AI and Efficiency

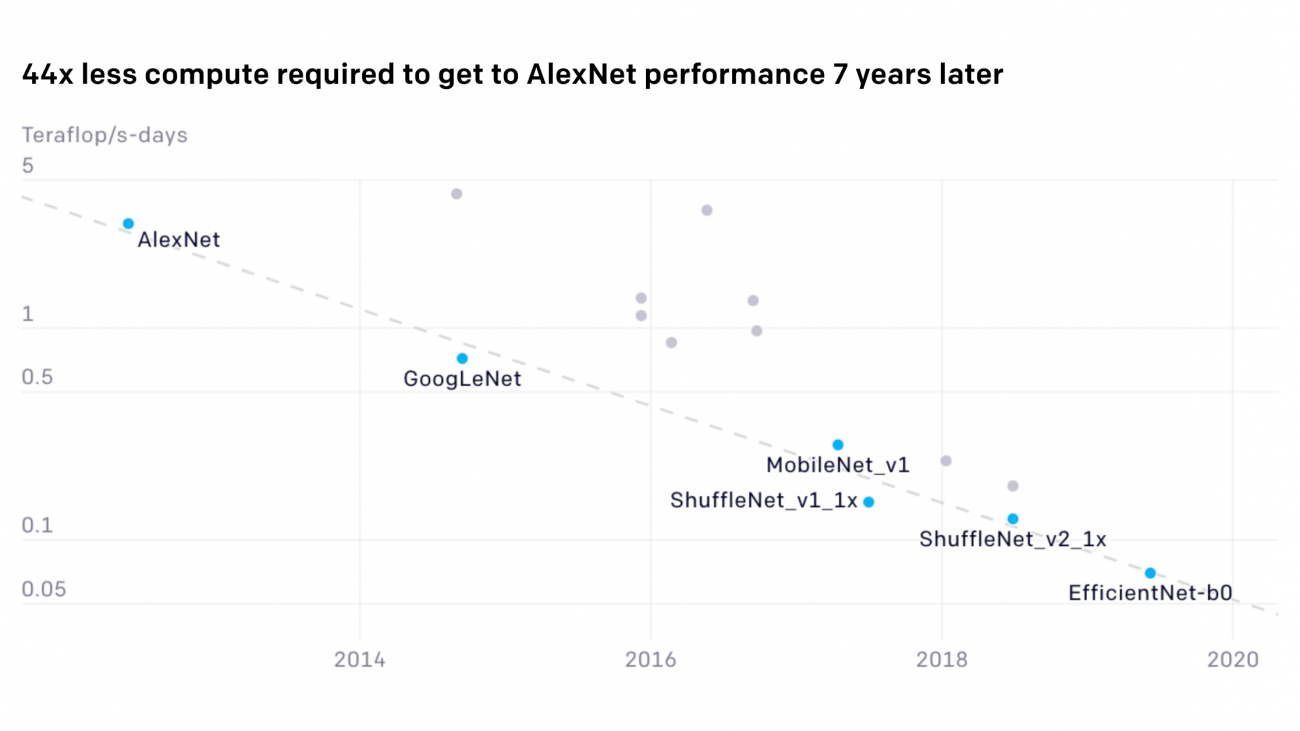
We’re releasing an analysis showing that since 2012 the amount of compute needed to train a neural net to the same performance on ImageNet classification has been decreasing by a factor of 2 every 16 months. Compared to 2012, it now takes 44 times less compute to train a neural network to the level of AlexNet (by contrast, Moore’s Law would yield an 11x cost improvement over this period). Our results suggest that for AI tasks with high levels of recent investment, algorithmic progress has yielded more gains than classical hardware efficiency.

Read Paper

Algorithmic improvement is a key factor driving the advance of AI. It’s important to search for measures that shed light on overall algorithmic progress, even though it’s harder than measuring such trends in compute.

44x less compute required to get to AlexNet performance 7 years later

Total amount of compute in teraflops/s-days used to train to AlexNet level performance. Lowest compute points at any given time shown in blue, all points measured shown in gray.

Download charts

Measuring efficiency

Algorithmic efficiency can be defined as reducing the compute needed to train a specific capability. Efficiency is the primary way we measure algorithmic progress on classic computer science problems like sorting. Efficiency gains on traditional problems like sorting are more straightforward to measure than in ML because they have a clearer measure of task difficulty.[1] However, we can apply the efficiency lens to machine learning by holding performance constant. Efficiency trends can be compared across domains like DNA sequencing (10-month doubling), solar energy (6-year doubling), and transistor density (2-year doubling).

For our analysis, we primarily leveraged open-source re-implementations to measure progress on AlexNet level performance over a long horizon. We saw a similar rate of training efficiency improvement for ResNet-50 level performance on ImageNet (17-month doubling time). We saw faster rates of improvement over shorter timescales in Translation, Go, and Dota 2:

  1. Within translation, the Transformer surpassed seq2seq performance on English to French translation on WMT’14 with 61x less training compute 3 years later.
  2. We estimate AlphaZero took 8x less compute to get to AlphaGoZero level performance 1 year later.
  3. OpenAI Five Rerun required 5x less training compute to surpass OpenAI Five (which beat the world champions, OG) 3 months later.

It can be helpful to think of compute in 2012 not being equal to compute in 2019 in a similar way that dollars need to be inflation-adjusted over time. A fixed amount of compute could accomplish more in 2019 than in 2012. One way to think about this is that some types of AI research progress in two stages, similar to the “tick tock” model of development seen in semiconductors; new capabilities (the “tick”) typically require a significant amount of compute expenditure to obtain, then refined versions of those capabilities (the “tock”) become much more efficient to deploy due to process improvements.

Increases in algorithmic efficiency allow researchers to do more experiments of interest in a given amount of time and money. In addition to being a measure of overall progress, algorithmic efficiency gains speed up future AI research in a way that’s somewhat analogous to having more compute.

Other measures of AI progress

In addition to efficiency, many other measures shed light on overall algorithmic progress in AI. Training cost in dollars is related, but less narrowly focused on algorithmic progress because it’s also affected by improvement in the underlying hardware, hardware utilization, and cloud infrastructure. Sample efficiency is key when we’re in a low data regime, which is the case for many tasks of interest. The ability to train models faster also speeds up research and can be thought of as a measure of the parallelizability of learning capabilities of interest. We also find increases in inference efficiency in terms of GPU time, parameters, and flops meaningful, but mostly as a result of their economic implications[2] rather than their effect on future research progress. Shufflenet achieved AlexNet-level performance with an 18x inference efficiency increase in 5 years (15-month doubling time), which suggests that training efficiency and inference efficiency might improve at similar rates. The creation of datasets/​environments/​benchmarks is a powerful method of making specific AI capabilities of interest more measurable.

Primary limitations

  1. We have only a small number of algorithmic efficiency data points on a few tasks. It’s unclear the degree to which the efficiency trends we’ve observed generalize to other AI tasks. Systematic measurement could make it clear whether an algorithmic equivalent to Moore’s Law[3] in the domain of AI exists, and if it exists, clarify its nature. We consider this a highly interesting open question. We suspect we’re more likely to observe similar rates of efficiency progress on similar tasks. By similar tasks, we mean tasks within these sub-domains of AI, on which the field agrees we’ve seen substantial progress, and that have comparable levels of investment (compute and/or researcher time).
  2. Even though we believe AlexNet represented a lot of progress, this analysis doesn’t attempt to quantify that progress. More generally, the first time a capability is created, algorithmic breakthroughs may have reduced the resources required from totally infeasible[4] to merely high. We think new capabilities generally represent a larger share of overall conceptual progress than observed efficiency increases of the type shown here.
  3. This analysis focuses on the final training run cost for an optimized model rather than total development costs. Some algorithmic improvements make it easier to train a model by making the space of hyperparameters that will train stably and get good final performance much larger. On the other hand, architecture searches increase the gap between the final training run cost and total training costs.
  4. We don’t speculate[5] on the degree to which we expect efficiency trends will extrapolate in time, we merely present our results and discuss the implications if the trends persist.

Measurement and AI policy

We believe that policymaking related to AI will be improved by a greater focus on the measurement and assessment of AI systems, both in terms of technical attributes and societal impact. We think such measurement initiatives can shed light on important questions in policy; our AI and Compute analysis suggests policymakers should increase funding for compute resources for academia, so that academic research can replicate, reproduce, and extend industry research. This efficiency analysis suggests that policymakers could develop accurate intuitions about the cost of deploying AI capabilities—and how these costs are going to alter over time—by more closely assessing the rate of improvements in efficiency for AI systems.

Tracking efficiency going forward

If large scale compute continues to be important to achieving state of the art (SOTA) overall performance in domains like language and games then it’s important to put effort into measuring notable progress achieved with smaller amounts of compute (contributions often made by academic institutions). Models that achieve training efficiency state of the arts on meaningful capabilities are promising candidates for scaling up and potentially achieving overall top performance. Additionally, figuring out the algorithmic efficiency improvements are straightforward[6] since they are just a particularly meaningful slice of the learning curves that all experiments generate.

We also think that measuring long run trends in efficiency SOTAs will help paint a quantitative picture of overall algorithmic progress. We observe that hardware and algorithmic efficiency gains are multiplicative and can be on a similar scale over meaningful horizons, which suggests that a good model of AI progress should integrate measures from both.

Our results suggest that for AI tasks with high levels of investment (researcher time and/or compute) algorithmic efficiency might outpace gains from hardware efficiency (Moore’s Law). Moore’s Law was coined in 1965 when integrated circuits had a mere 64 transistors (6 doublings) and naively extrapolating it out predicted personal computers and smartphones (an iPhone 11 has 8.5 billion transistors). If we observe decades of exponential improvement in the algorithmic efficiency of AI, what might it lead to? We’re not sure. That these results make us ask this question is a modest update for us towards a future with powerful AI services and technology.

For all these reasons, we’re going to start tracking efficiency SOTAs publicly. We’ll start with vision and translation efficiency benchmarks (ImageNet[7] and WMT14), and we’ll consider adding more benchmarks over time. We believe there are efficiency SOTAs on these benchmarks we’re unaware of and encourage the research community to submit them here (we’ll give credit to original authors and collaborators).

Industry leaders, policymakers, economists, and potential researchers are all trying to better understand AI progress and decide how much attention they should invest and where to direct it. Measurement efforts can help ground such decisions. If you’re interested in this type of work, consider applying to work at OpenAI’s Foresight or Policy team!

Algorithmic efficiency SOTAs

Submit on GitHub

OpenAI

Four Novel Approaches to Manipulating Fabric using Model-Free and Model-Based Deep Learning in Simulation

Four Novel Approaches to Manipulating Fabric using Model-Free and Model-Based Deep Learning in Simulation


Humans manipulate 2D deformable structures such as fabric on a daily basis,
from putting on clothes to making beds. Can robots learn to perform similar
tasks? Successful approaches can advance applications such as dressing
assistance for senior care, folding of laundry, fabric upholstery, bed-making,
manufacturing, and other tasks. Fabric manipulation is challenging, however,
because of the difficulty in modeling system states and dynamics, meaning that
when a robot manipulates fabric, it is hard to predict the fabric’s resulting
state or visual appearance.

In this blog post, we review four recent papers from two research labs (Pieter
Abbeel
’s and Ken Goldberg’s) at Berkeley AI Research (BAIR) that
investigate the following hypothesis: is it possible to employ learning-based
approaches to the problem of fabric manipulation?

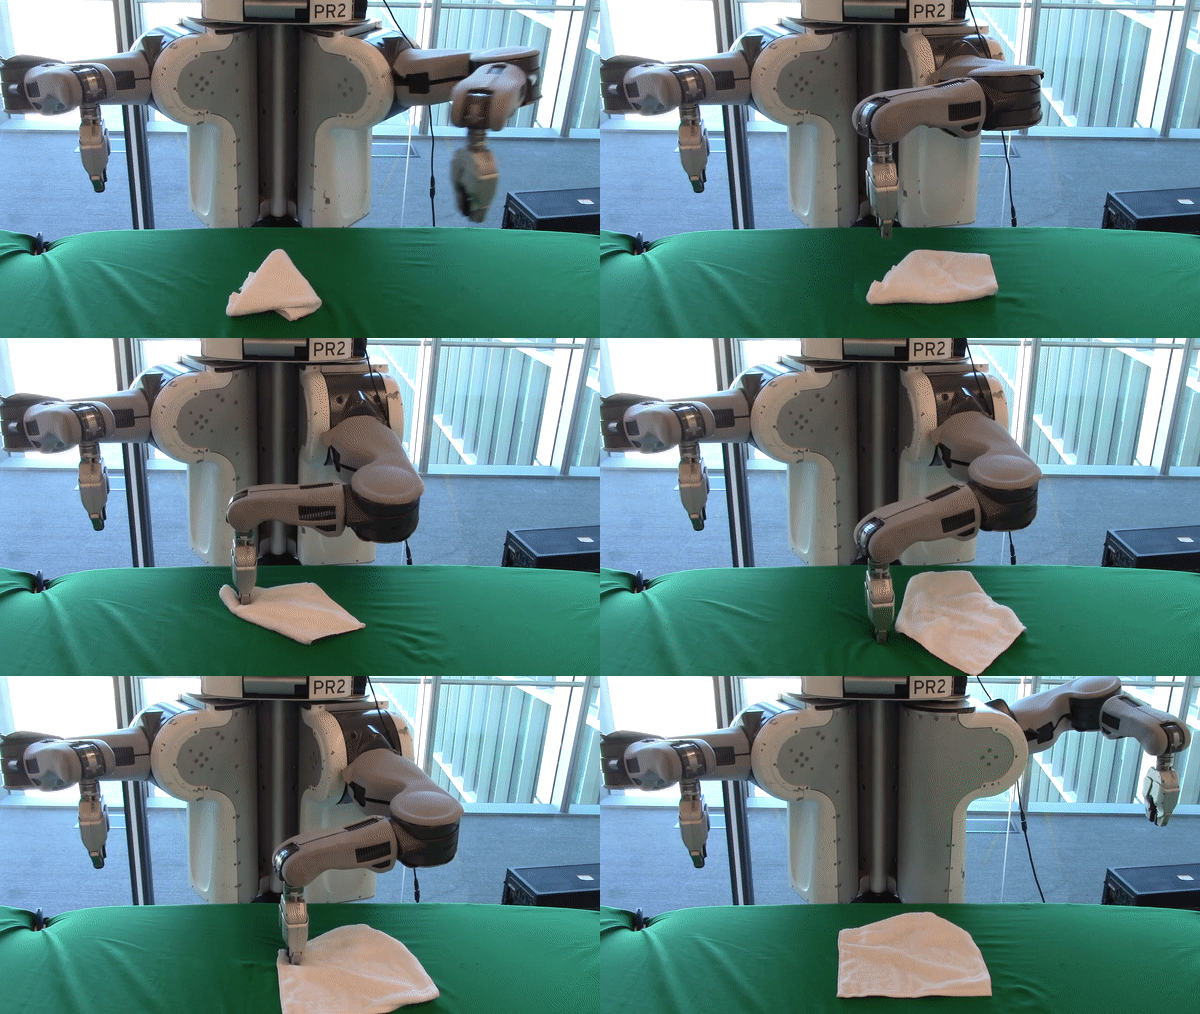
We demonstrate promising results in support of this hypothesis by using a
variety of learning-based methods with fabric simulators to train smoothing
(and even folding) policies in simulation. We then perform sim-to-real transfer
to deploy the policies on physical robots. Examples of the learned policies in
action are shown in the GIFs above.

We show that deep model-free methods trained from exploration or from
demonstrations work reasonably well for specific tasks like smoothing, but it
is unclear how well they generalize to related tasks such as folding. On the
other hand, we show that deep model-based methods have more potential for
generalization to a variety of tasks, provided that the learned models are
sufficiently accurate. In the rest of this post, we summarize the papers,
emphasizing the techniques and tradeoffs in each approach.

Updates & Improvements to PyTorch Tutorials

Updates & Improvements to PyTorch Tutorials

PyTorch.org provides researchers and developers with documentation, installation instructions, latest news, community projects, tutorials, and more. Today, we are introducing usability and content improvements including tutorials in additional categories, a new recipe format for quickly referencing common topics, sorting using tags, and an updated homepage.

Let’s take a look at them in detail.

TUTORIALS HOME PAGE UPDATE

The tutorials home page now provides clear actions that developers can take. For new PyTorch users, there is an easy-to-discover button to take them directly to “A 60 Minute Blitz”. Right next to it, there is a button to view all recipes which are designed to teach specific features quickly with examples.

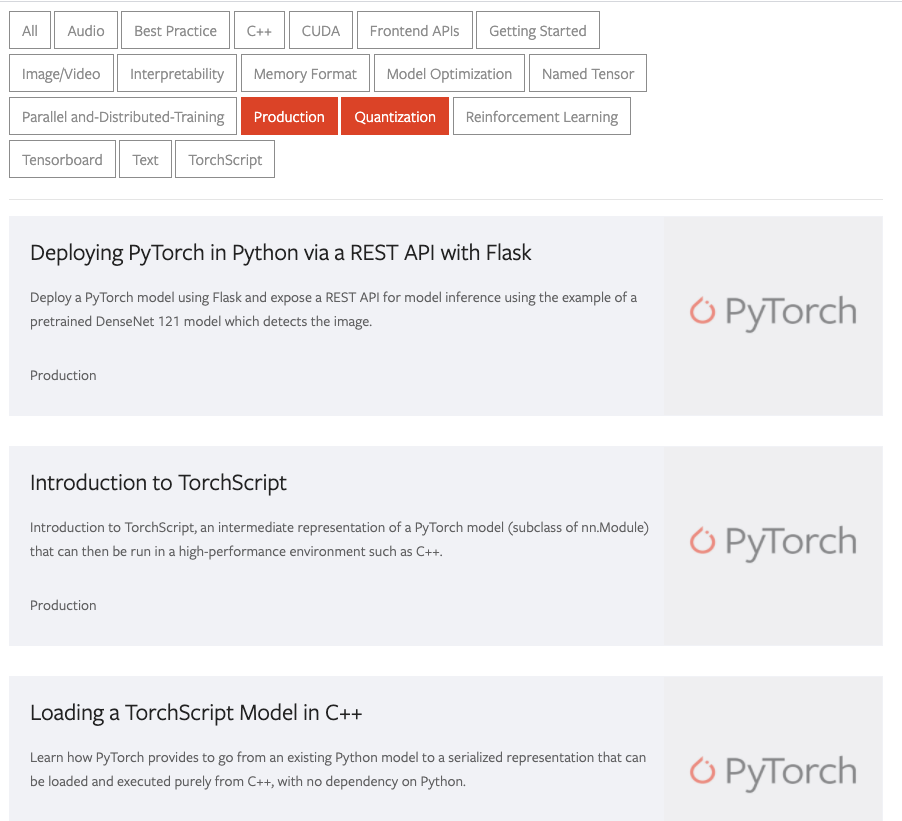
In addition to the existing left navigation bar, tutorials can now be quickly filtered by multi-select tags. Let’s say you want to view all tutorials related to “Production” and “Quantization”. You can select the “Production” and “Quantization” filters as shown in the image shown below:

The following additional resources can also be found at the bottom of the Tutorials homepage:

PYTORCH RECIPES

Recipes are new bite-sized, actionable examples designed to teach researchers and developers how to use specific PyTorch features. Some notable new recipes include:

View the full recipes here.

LEARNING PYTORCH

This section includes tutorials designed for users new to PyTorch. Based on community feedback, we have made updates to the current Deep Learning with PyTorch: A 60 Minute Blitz tutorial, one of our most popular tutorials for beginners. Upon completion, one can understand what PyTorch and neural networks are, and be able to build and train a simple image classification network. Updates include adding explanations to clarify output meanings and linking back to where users can read more in the docs, cleaning up confusing syntax errors, and reconstructing and explaining new concepts for easier readability.

DEPLOYING MODELS IN PRODUCTION

This section includes tutorials for developers looking to take their PyTorch models to production. The tutorials include:

FRONTEND APIS

PyTorch provides a number of frontend API features that can help developers to code, debug, and validate their models more efficiently. This section includes tutorials that teach what these features are and how to use them. Some tutorials to highlight:

MODEL OPTIMIZATION

Deep learning models often consume large amounts of memory, power, and compute due to their complexity. This section provides tutorials for model optimization:

PARALLEL AND DISTRIBUTED TRAINING

PyTorch provides features that can accelerate performance in research and production such as native support for asynchronous execution of collective operations and peer-to-peer communication that is accessible from Python and C++. This section includes tutorials on parallel and distributed training:

Making these improvements are just the first step of improving PyTorch.org for the community. Please submit your suggestions here.

Cheers,

Team PyTorch

Read More

Robots help some firms, even while workers across industries struggle

This is part 2 of a three-part series examining the effects of robots and automation on employment, based on new research from economist and Institute Professor Daron Acemoglu. 

Overall, adding robots to manufacturing reduces jobs — by more than three per robot, in fact. But a new study co-authored by an MIT professor reveals an important pattern: Firms that move quickly to use robots tend to add workers to their payroll, while industry job losses are more concentrated in firms that make this change more slowly.

The study, by MIT economist Daron Acemoglu, examines the introduction of robots to French manufacturing in recent decades, illuminating the business dynamics and labor implications in granular detail.

“When you look at use of robots at the firm level, it is really interesting because there is an additional dimension,” says Acemoglu. “We know firms are adopting robots in order to reduce their costs, so it is quite plausible that firms adopting robots early are going to expand at the expense of their competitors whose costs are not going down. And that’s exactly what we find.”

Indeed, as the study shows, a 20 percentage point increase in robot use in manufacturing from 2010 to 2015 led to a 3.2 percent decline in industry-wide employment. And yet, for firms adopting robots during that timespan, employee hours worked rose by 10.9 percent, and wages rose modestly as well.

A new paper detailing the study, “Competing with Robots: Firm-Level Evidence from France,” will appear in the May issue of the American Economic Association: Papers and Proceedings. The authors are Acemoglu, who is an Institute Professor at MIT; Clair Lelarge, a senior research economist at the Banque de France and the Center for Economic Policy Research; and Pascual Restrepo Phd ’16, an assistant professor of economics at Boston University.

A French robot census

To conduct the study, the scholars examined 55,390 French manufacturing firms, of which 598 purchased robots during the period from 2010 to 2015. The study uses data provided by France’s Ministry of Industry, client data from French robot suppliers, customs data about imported robots, and firm-level financial data concerning sales, employment, and wages, among other things.

The 598 firms that did purchase robots, while comprising just 1 percent of manufacturing firms, accounted for about 20 percent of manufacturing production during that five-year period.

“Our paper is unique in that we have an almost comprehensive [view] of robot adoption,” Acemoglu says.

The manufacturing industries most heavily adding robots to their production lines in France were pharmaceutical companies, chemicals and plastic manufacturers, food and beverage producers, metal and machinery manufacturers, and automakers.

The industries investing least in robots from 2010 to 2015 included paper and printing, textiles and apparel manufacturing, appliance manufacturers, furniture makers, and minerals companies.

The firms that did add robots to their manufacturing processes became more productive and profitable, and the use of automation lowered their labor share — the part of their income going to workers — between roughly 4 and 6 percentage points. However, because their investments in technology fueled more growth and more market share, they added more workers overall.

By contrast, the firms that did not add robots saw no change in the labor share, and for every 10 percentage point increase in robot adoption by their competitors, these firms saw their own employment drop 2.5 percent. Essentially, the firms not investing in technology were losing ground to their competitors.

This dynamic — job growth at robot-adopting firms, but job losses overall — fits with another finding Acemoglu and Restrepo made in a separate paper about the effects of robots on employment in the U.S. There, the economists found that each robot added to the work force essentially eliminated 3.3 jobs nationally.

“Looking at the result, you might think [at first] it’s the opposite of the U.S. result, where the robot adoption goes hand in hand with destruction of jobs, whereas in France, robot-adopting firms are expanding their employment,” Acemoglu says. “But that’s only because they’re expanding at the expense of their competitors. What we show is that when we add the indirect effect on those competitors, the overall effect is negative and comparable to what we find the in the U.S.”

Superstar firms and the labor share issue

The competitive dynamics the researchers found in France resemble those in another high-profile piece of economics research recently published by MIT professors. In a recent paper, MIT economists David Autor and John Van Reenen, along with three co-authors, published evidence indicating the decline in the labor share in the U.S. as a whole was driven by gains made by “superstar firms,” which find ways to lower their labor share and gain market power.

While those elite firms may hire more workers and even pay relatively well as they grow, labor share declines in their industries, overall.

“It’s very complementary,” Acemoglu observes about the work of Autor and Van Reenen. However, he notes, “A slight difference is that superstar firms [in the work of Autor and Van Reenen, in the U.S.] could come from many different sources. By having this individual firm-level technology data, we are able to show that a lot of this is about automation.”

So, while economists have offered many possible explanations for the decline of the labor share generally — including technology, tax policy, changes in labor market institutions, and more — Acemoglu suspects technology, and automation specifically, is the prime candidate, certainly in France.

“A big part of the [economic] literature now on technology, globalization, labor market institutions, is turning to the question of what explains the decline in the labor share,” Acemoglu says. “Many of those are reasonably interesting hypotheses, but in France it’s only the firms that adopt robots — and they are very large firms — that are reducing their labor share, and that’s what accounts for the entirety of the decline in the labor share in French manufacturing. This really emphasizes that automation, and in particular robots, is a critical part in understanding what’s going on.”

Read More

How many jobs do robots really replace?

This is part 1 of a three-part series examining the effects of robots and automation on employment, based on new research from economist and Institute Professor Daron Acemoglu.  

In many parts of the U.S., robots have been replacing workers over the last few decades. But to what extent, really? Some technologists have forecast that automation will lead to a future without work, while other observers have been more skeptical about such scenarios.

Now a study co-authored by an MIT professor puts firm numbers on the trend, finding a very real impact — although one that falls well short of a robot takeover. The study also finds that in the U.S., the impact of robots varies widely by industry and region, and may play a notable role in exacerbating income inequality.

“We find fairly major negative employment effects,” MIT economist Daron Acemoglu says, although he notes that the impact of the trend can be overstated.

From 1990 to 2007, the study shows, adding one additional robot per 1,000 workers reduced the national employment-to-population ratio by about 0.2 percent, with some areas of the U.S. affected far more than others.

This means each additional robot added in manufacturing replaced about 3.3 workers nationally, on average.

That increased use of robots in the workplace also lowered wages by roughly 0.4 percent during the same time period.

“We find negative wage effects, that workers are losing in terms of real wages in more affected areas, because robots are pretty good at competing against them,” Acemoglu says.

The paper, “Robots and Jobs: Evidence from U.S. Labor Markets,” appears in advance online form in the Journal of Political Economy. The authors are Acemoglu and Pascual Restrepo PhD ’16, an assistant professor of economics at Boston University.

Displaced in Detroit

To conduct the study, Acemoglu and Restrepo used data on 19 industries, compiled by the International Federation of Robotics (IFR), a Frankfurt-based industry group that keeps detailed statistics on robot deployments worldwide. The scholars combined that with U.S.-based data on population, employment, business, and wages, from the U.S. Census Bureau, the Bureau of Economic Analysis, and the Bureau of Labor Statistics, among other sources.

The researchers also compared robot deployment in the U.S. to that of other countries, finding it lags behind that of Europe. From 1993 to 2007, U.S. firms actually did introduce almost exactly one new robot per 1,000 workers; in Europe, firms introduced 1.6 new robots per 1,000 workers.

“Even though the U.S. is a technologically very advanced economy, in terms of industrial robots’ production and usage and innovation, it’s behind many other advanced economies,” Acemoglu says.

In the U.S., four manufacturing industries account for 70 percent of robots: automakers (38 percent of robots in use), electronics (15 percent), the plastics and chemical industry (10 percent), and metals manufacturers (7 percent).

Across the U.S., the study analyzed the impact of robots in 722 commuting zones in the continental U.S. — essentially metropolitan areas — and found considerable geographic variation in how intensively robots are utilized.

Given industry trends in robot deployment, the area of the country most affected is the seat of the automobile industry. Michigan has the highest concentration of robots in the workplace, with employment in Detroit, Lansing, and Saginaw affected more than anywhere else in the country.

“Different industries have different footprints in different places in the U.S.,” Acemoglu observes. “The place where the robot issue is most apparent is Detroit. Whatever happens to automobile manufacturing has a much greater impact on the Detroit area [than elsewhere].”

In commuting zones where robots were added to the workforce, each robot replaces about 6.6 jobs locally, the researchers found. However, in a subtle twist, adding robots in manufacturing benefits people in other industries and other areas of the country — by lowering the cost of goods, among other things. These national economic benefits are the reason the researchers calculated that adding one robot replaces 3.3 jobs for the country as a whole.

The inequality issue

In conducting the study, Acemoglu and Restrepo went to considerable lengths to see if the employment trends in robot-heavy areas might have been caused by other factors, such as trade policy, but they found no complicating empirical effects.

The study does suggest, however, that robots have a direct influence on income inequality. The manufacturing jobs they replace come from parts of the workforce without many other good employment options; as a result, there is a direct connection between automation in robot-using industries and sagging incomes among blue-collar workers.

“There are major distributional implications,” Acemoglu says. When robots are added to manufacturing plants, “The burden falls on the low-skill and especially middle-skill workers. That’s really an important part of our overall research [on robots], that automation actually is a much bigger part of the technological factors that have contributed to rising inequality over the last 30 years.”

So while claims about machines wiping out human work entirely may be overstated, the research by Acemoglu and Restrepo shows that the robot effect is a very real one in manufacturing, with significant social implications.

“It certainly won’t give any support to those who think robots are going to take all of our jobs,” Acemoglu says. “But it does imply that automation is a real force to be grappled with.”

Read More

Three from MIT elected to the National Academy of Sciences for 2020

On April 27, the National Academy of Sciences elected 120 new members and 26 international associates, including three professors from MIT — Abhijit Banerjee, Bonnie Berger, and Roger Summons — recognizing their “distinguished and continuing achievements in original research.” Current membership totals 2,403 active members and 501 international associates, including 190 Nobel Prize recipients.

The National Academy of Sciences is a private, nonprofit institution for scientific advancement established in 1863 by congressional charter and signed into law by President Abraham Lincoln. Together, with the National Academy of Engineering and the National Academy of Medicine, the 157-year-old society provides science, engineering, and health policy advice to the federal government and other organizations.

Abhijit Banerjee is the Ford Foundation International Professor of Economics, and in 2003 cofounded, with Esther Duflo and Sendhil Mullainathan, the Abdul Latif Jameel Poverty Action Lab (J-PAL). Banerjee’s groundbreaking research focuses on development economics and the alleviation of global poverty, work for which he shared the 2019 Nobel Prize in Economic Sciences.

He continues to serve as a director of J-PAL; he is also a past president of the Bureau for Research and Economic Analysis of Development, a research associate of the National Bureau of Economic Research, a Center for Economic and Policy Research research fellow, an international research fellow of the Kiel Institute, and a fellow of the American Academy of Arts and Sciences and the Econometric Society. He has been a Guggenheim fellow, an Alfred P. Sloan fellow, and a winner of the Infosys Prize.   

Banerjee’s scholarship, in collaboration with fellow NAS member and MIT Professor Esther Duflo, emphasizes the importance of field work in antipoverty initiatives, in order to recreate the precision of randomized controlled trials (RCTs) and laboratory-style data within the complexity of ever-evolving social realities. The resulting RCT evidence reveals which poverty interventions really work, enabling governments, non-governmental organizations, donors, and the private sector to plan effective programs and policies for poverty alleviation. When Banerjee began his career, development economics was considered marginal in economic studies, a view that Banerjee’s work and high-profile achievements have helped to correct.

Bonnie Berger is the Simons Professor of Mathematics and holds a joint appointment in the Department of Electrical Engineering and Computer Science. She is the head of the Computation and Biology group at MIT’s Computer Science and Artificial Intelligence Laboratory (CSAIL). She is also a faculty member of the Harvard-MIT Program in Health Sciences and Technology and an associate member of the Broad Institute of MIT and Harvard .

After beginning her career working in algorithms at MIT, Berger was one of the pioneer researchers in the area of computational molecular biology and, together with the many students she has mentored, has been instrumental in defining the field. Her work addresses biological and biomedical questions by using computation in support of or in place of laboratory procedures, with a goal being to get more accurate answers at a greatly reduced cost. Combining genomic and health-related data from millions of patients will empower unprecedented insights into human health and disease risk. Berger transforms and creates techniques from algorithmic thinking to provide novel computational methods and software to enable biomedical data sharing and analysis at scale.

Berger is an elected fellow of the American Academy of Arts and Sciences, Association for Computing Machinery, International Society for Computational Biology (ISCB), American Institute of Medical and Biological Engineering, and American Mathematical Society. Recently she was recognized by ISCB with their Accomplishments by a Senior Scientist Award. She received the NIH Margaret Pittman Director’s Award, the SIAM Sonya Kovalevsky Lecture Prize, and an honorary doctorate from EPFL. Earlier in her career, she received an NSF Career Award, the Biophysical Society’s Dayhoff Award, and recognition as MIT Technology Review magazine’s inaugural TR100 top young innovators. She serves as vice president of ISCB, head of the steering committee for Research in Computational Molecular Biology, and member-at-large of the Section on Mathematics at American Association for the Advancement of Science (AAAS), as well as on multiple advisory committees and editorial boards.

Roger Summons is the Schlumberger Professor of Geobiology in the Department of Earth, Atmospheric and Planetary Sciences (EAPS) at MIT.  

Working at the intersection of biogeochemistry, geobiology, and astrobiology, Summons’ work examines the origins and co-evolution of Earth’s early life and the environment, beginning with the first geological and geochemical records and microbially dominated ecosystems. As an investigator in the Simons Collaboration on the Origins of Life, he’s particularly focused on lipid chemistry of microbes important to understating Earth through deep time, organic and isotopic indicators of climate change, and biomarkers in sediments and petroleum. 

Summons applies findings from this research to understanding life on Earth and the search for it elsewhere in the universe, recently on Mars. As such, he has served on three committees of the National Research Council: Committee on Origin and Evolution of Life, the Committee on Limits of Life, and the Committee on Mars Astrobiology. As an emeritus member of the NASA Astrobiology Institute (NAI) Executive Council and the head of the MIT team of NAI called the Foundations of Complex Life: Evolution, Preservation, and Detection on Earth and Beyond, Summons helped integrate this research with international science communities. Here, his group investigated factors that led to the evolution of complex life by examining processes and conditions that preserve biological signatures. More recently, Summons has contributed to Mars rover missions Curiosity and Perseverance, providing expertise on the preservation of organic matter from different environments on Earth and the red planet.

Read More