NVIDIA and Arm to Create World-Class AI Research Center in Cambridge

NVIDIA and Arm to Create World-Class AI Research Center in Cambridge

Artificial intelligence is the most powerful technology force of our time. 

It is the automation of automation, where software writes software. While AI began in the data center, it is moving quickly to the edge — to stores, warehouses, hospitals, streets, and airports, where smart sensors connected to AI computers can speed checkouts, direct forklifts, orchestrate traffic, and save power. In time, there will be trillions of these small autonomous computers powered by AI, connected by massively powerful cloud data centers in every corner of the world.

But in many ways, the field is just getting started. That’s why we are excited to be creating a world-class AI laboratory in Cambridge, at the Arm headquarters: a Hadron collider or Hubble telescope, if you like, for artificial intelligence.  

NVIDIA, together with Arm, is uniquely positioned to launch this effort. NVIDIA is the leader in AI computing, while Arm is present across a vast ecosystem of edge devices, with more than 180 billion units shipped. With this newly announced combination, we are creating the leading computing company for the age of AI. 

Arm is an incredible company and it employs some of the greatest engineering minds in the world. But we believe we can make Arm even more incredible and take it to even higher levels. We want to propel it — and the U.K. — to global AI leadership.

We will create an open center of excellence in the area once home to giants like Isaac Newton and Alan Turing, for whom key NVIDIA technologies are named. Here, leading scientists, engineers and researchers from the U.K. and around the world will come develop their ideas, collaborate and conduct their ground-breaking work in areas like healthcare, life sciences, self-driving cars and other fields. We want the U.K. to attract the best minds and talent from around the world. 

The center in Cambridge will include: 

  • An Arm/NVIDIA-based supercomputer. Expected to be one of the most powerful AI supercomputers in the world, this system will combine state-of-the art Arm CPUs, NVIDIA’s most advanced GPU technology, and NVIDIA Mellanox DPUs, along with high-performance computing and AI software from NVIDIA and our many partners. For reference, the world’s fastest supercomputer, Fugaku in Japan, is Arm-based, and NVIDIA’s own supercomputer Selene is the seventh most powerful system in the world.  
  • Research Fellowships and Partnerships. In this center, NVIDIA will expand research partnerships within the U.K., with academia and industry to conduct research covering leading-edge work in healthcare, autonomous vehicles, robotics, data science and more. NVIDIA already has successful research partnerships with King’s College and Oxford. 
  • AI Training. NVIDIA’s education wing, the Deep Learning Institute, has trained more than 250,000 students on both fundamental and applied AI. NVIDIA will create an institute in Cambridge, and make our curriculum available throughout the U.K. This will provide both young people and mid-career workers with new AI skills, creating job opportunities and preparing the next generation of U.K. developers for AI leadership. 
  • Startup Accelerator. Much of the leading-edge work in AI is done by startups. NVIDIA Inception, a startup accelerator program, has more than 6,000 members — with more than 400 based in the U.K. NVIDIA will further its investment in this area by providing U.K. startups with access to the Arm supercomputer, connections to researchers from NVIDIA and partners, technical training and marketing promotion to help them grow. 
  • Industry Collaboration. The NVIDIA AI research facility will be an open hub for industry collaboration, providing a uniquely powerful center of excellence in Britain. NVIDIA’s industry partnerships include GSK, Oxford Nanopore and other leaders in their fields. From helping to fight COVID-19 to finding new energy sources, NVIDIA is already working with industry across the U.K. today — but we can and will do more. 

We are ambitious. We can’t wait to build on the foundations created by the talented minds of NVIDIA and Arm to make Cambridge the next great AI center for the world. 

The post NVIDIA and Arm to Create World-Class AI Research Center in Cambridge appeared first on The Official NVIDIA Blog.

Read More

How Kabbage improved the PPP lending experience with Amazon Textract

This is a guest post by Anthony Sabelli, Head of Data Science at Kabbage, a data and technology company providing small business cash flow solutions.

Kabbage is a data and technology company providing small business cash flow solutions. One way in which we serve our customers is by providing them access to flexible lines of credit through automation. Small businesses connect their real-time business data to Kabbage to receive a fully-automated funding decision in minutes, and this efficiency has led us to provide over 500,000 small businesses access to more than $16 billion of working capital, including the Paycheck Protection Program (PPP).

At the onset of COVID-19, when the nation was shutting down and small businesses were forced to close their doors, we had to overcome multiple technical challenges while navigating new and ever-changing underwriting criteria for what became the largest federal relief effort in the Small Business Administration’s (SBA) history. Prior to the PPP, Kabbage had never issued an SBA loan before. But in a matter of 2 weeks, the team stood up a fully automated system for any eligible small business—including new customers, regardless of size or stature—to access government funds.

Kabbage has always based its underwriting on the real-time business data and revenue performance of customers, not payroll and tax data, which were the primary criteria for the PPP. Without an established API to the IRS to help automate verification and underwriting, we needed to fundamentally adapt our systems to help small businesses access funding as quickly as possible. Additionally, we were a team of just a few hundred joining the ranks of thousands of seasoned SBA lenders with hundreds of thousands of employees and trillions of dollars in assets at their disposal.

In this post, we share our experience of how Amazon Textract helped support 80% of Kabbage’s PPP applicants to receive a fully automated lending experience and reduced approval times from multiple days to a median speed of 4 hours. By the end of the program, Kabbage became the second largest PPP lender in the nation by application volume, surpassing the major US banks—including Chase, the largest bank in America—serving over 297,000 small businesses, and preserving an estimated 945,000 jobs across America.

Implementing Amazon Textract

As one of the few PPP lenders that accepted applications from new customers, Kabbage saw an increased demand as droves of small businesses unable to apply with their long-standing bank turned to other lenders.

Businesses were required to upload documents from tax filings to proof of business documentation and forms of ID, and initially, all loans were underwritten manually. A human had to review, verify, and input values from various documents to substantiate the prescribed payroll calculation and subsequently submit the application to the SBA on behalf of the customer. However, in a matter of days, Kabbage had tens of thousands of small businesses submitting hundreds to thousands of documents that quickly climbed to millions. The task demanded automation.

We needed to break it down into parts. Our system already excelled at automating the verification processes commonly referred to as Know Your Business (KYB) and Know Your Customers (KYC), which allowed us to let net-new businesses in the door, totaling 97% of Kabbage’s PPP customers. Additionally, we needed to standardize the loan calculation process so we could automate document ingestion, verification, and review to extract only the appropriate values required to underwrite the loan.

To do so, we codified a loan calculation for different business types, including sole proprietors and independent contractors (which totaled 67% of our PPP customer base), around specific values found on various IRS forms. We bootstrapped an initial classifier for key IRS forms within 48 hours. The final hurdle was to accurately extract the values to issue loans compliant to the program. Amazon Textract was instrumental in getting over this final hurdle. We went from POC to full implementation within a week, and to full production within two weeks.

Integrating Amazon Textract into our pipelines was incredibly easy. Specifically, we used StartDocumentAnalysis and GetDocumentAnalysis, which allows us to asynchronously interact with Amazon Textract. We also found that using forms for FeatureTypes was well suited to processing tax documents. In the end, Amazon Textract was accurate, and it scaled to process a substantial backlog. After we finished integrating Amazon Textract, we were able to clear our backlog, and it remained a key step in our PPP flow through the end of the program.

Big impact on small businesses

For perspective, Kabbage customers accessed nearly $3 billion in working capital loans in 2019, driven by almost 60,000 new customers. In just 4 months, we delivered more than double the amount of funding ($7 billion) to roughly five times the number of new customers (297,000). With an average loan size of $23,000 and a median loan size of $12,700, over 90% of all PPP customers have 10 or fewer employees, representing businesses often most vulnerable to crises yet overlooked when seeking financial aid. Kabbage’s platform allowed it to serve the far-reaching and remote areas of the country, delivering loans in all 50 US states and territories, with one third of loans issued to businesses in zip codes with an average household income of less than $50,000.

We’re proud of what our team and technology accomplished, outperforming the nation’s largest banks with a fraction of the resources. For every 790 employees at a major US bank, Kabbage has one employee. Yet, we surpassed their volume of loans, serving nearly 300,000 of the smallest businesses in America for over $7 billion.

The path forward

At Kabbage, we always strive to find new data sources to enhance our cash flow platform to increase access to financial services to small businesses. Amazon Textract allowed us to add a new arrow to our quiver; we had never extracted values from tax filings prior to the PPP. It opens the opportunity for us to make our underwriting models more rich. This adds another viewpoint into the financial health and performance of small businesses when helping our customers access funding, and provides more insights into their cash flow to build a stronger business.

Conclusion

COVID-19 further revealed the financial system in America underserves Main Street business, even though they represent 99% of all companies, half of all jobs, and half of the non-farm GDP. Technology can fix this. It requires creative solutions such as what we built and delivered for the PPP to fundamentally shift how customers expect to access financial services in the future.

Amazon Textract was an important function that allowed us to successfully become the second-largest PPP lender in the nation and fund so many small businesses when they needed it the most. We found the entire process of integrating the APIs into our workflow simple and straightforward, which allowed us to focus more time on ensuring more small businesses—the backbone of our economy—received critical funding when they needed it the most.


About the Author

Anthony Sabelli is the Head of Data Science for Kabbage, a data and technology company providing small businesses cash flow solutions. Anthony holds a Ph.D. from Cornell University and an undergraduate degree from Brown University, both in applied mathematics. At Kabbage, Anthony leads the global data science team, analyzing the more than two million live data connections from its small business customers to improve business performance and underwriting models.

Read More

Perfect Pairing: NVIDIA’s David Luebke on the Intersection of AI and Graphics

Perfect Pairing: NVIDIA’s David Luebke on the Intersection of AI and Graphics

NVIDIA Research comprises more than 200 scientists around the world driving innovation across a range of industries. One of its central figures is David Luebke, who founded the team in 2006 and is now the company’s vice president of graphics research.

Luebke spoke with AI Podcast host Noah Kravitz about what he’s working on. He’s especially focused on the interaction between AI and graphics. Rather than viewing the two as conflicting endeavors, Luebke argues that AI and graphics go together “like peanut butter and jelly.”

NVIDIA Research proved that with StyleGAN2, the second iteration of the generative adversarial network StyleGAN. Trained on high-resolution images, StyleGAN2 takes numerical input and produces realistic portraits.

Creating images comparable to those generated in films — which could take up to weeks to create just a single frame — the first version of StyleGAN only takes 24 milliseconds to produce an image.

Luebke envisions the future of GANs as an even larger collaboration between AI and graphics. He predicts that GANs such as those used in StyleGAN will learn to produce the key elements of graphics: shapes, materials, illumination and even animation.

Key Points From This Episode:

  • AI is especially useful in graphics by replacing or augmenting components of the traditional computer graphics pipeline, from content creation to mesh generation to realistic character animation.
  • Luebke researches a range of topics, one of which is virtual and augmented reality. It was, in fact, what inspired him to pursue graphics research — learning about VR led him to switch majors from chemical engineering.
  • Displays are a major stumbling block in virtual and augmented reality, he says. He emphasizes that VR requires high frame rates, low latency and very high pixel density.

Tweetables:

“Artificial intelligence, deep neural networks — that is the future of computer graphics” — David Luebke [2:34]

“[AI], like a renaissance artist, puzzled out the rules of perspective and rotation” — David Luebke [16:08]

You Might Also Like

NVIDIA Research’s Aaron Lefohn on What’s Next at Intersection of AI and Computer Graphics

Real-time graphics technology, namely, GPUs, sparked the modern AI boom. Now modern AI, driven by GPUs, is remaking graphics. This episode’s guest is Aaron Lefohn, senior director of real-time rendering research at NVIDIA. Aaron’s international team of scientists played a key role in founding the field of AI computer graphics.

GauGAN Rocket Man: Conceptual Artist Uses AI Tools for Sci-Fi Modeling

Ever wondered what it takes to produce the complex imagery in films like Star Wars or Transformers? Here to explain the magic is Colie Wertz, a conceptual artist and modeler who works on film, television and video games. Wertz discusses his specialty of hard modeling, in which he produces digital models of objects with hard surfaces like vehicles, robots and computers.

Cycle of DOOM Now Complete: Researchers Use AI to Generate New Levels for Seminal Video Game

DOOM, of course, is foundational to 3D gaming. 3D gaming, of course, is foundational to GPUs. GPUs, of course, are foundational to deep learning, which is, now, thanks to a team of Italian researchers, two of whom we’re bringing to you with this podcast, being used to make new levels for … DOOM.

Tune in to the AI Podcast

Get the AI Podcast through iTunes, Google Podcasts, Google Play, Castbox, DoggCatcher, Overcast, PlayerFM, Pocket Casts, Podbay, PodBean, PodCruncher, PodKicker, Soundcloud, Spotify, Stitcher and TuneIn. If your favorite isn’t listed here, drop us a note.

Tune in to the Apple Podcast Tune in to the Google Podcast Tune in to the Spotify Podcast

Make the AI Podcast Better

Have a few minutes to spare? Fill out this listener survey. Your answers will help us make a better podcast.

The post Perfect Pairing: NVIDIA’s David Luebke on the Intersection of AI and Graphics appeared first on The Official NVIDIA Blog.

Read More

Right-sizing resources and avoiding unnecessary costs in Amazon SageMaker

Right-sizing resources and avoiding unnecessary costs in Amazon SageMaker

Amazon SageMaker is a fully managed service that allows you to build, train, deploy, and monitor machine learning (ML) models. Its modular design allows you to pick and choose the features that suit your use cases at different stages of the ML lifecycle. Amazon SageMaker offers capabilities that abstract the heavy lifting of infrastructure management and provides the agility and scalability you desire for large-scale ML activities with different features and a pay-as-you-use pricing model.

In this post, we outline the pricing model for Amazon SageMaker and offer some best practices on how you can optimize your cost of using Amazon SageMaker resources to effectively and efficiently build, train, and deploy your ML models. In addition, the post offers programmatic approaches for automatically stopping or detecting idle resources that are incurring costs, allowing you to avoid unnecessary charges.

Amazon SageMaker pricing

Machine Learning is an iterative process with different computational needs for prototyping the code and exploring the dataset, processing, training, and hosting the model for real-time and offline predictions. In a traditional paradigm, estimating the right amount of computational resources to support different workloads is difficult, and often leads to over-provisioning resources. The modular design of Amazon SageMaker offers flexibility to optimize the scalability, performance, and costs for your ML workloads depending on each stage of the ML lifecycle. For more information about how Amazon SageMaker works, see the following resources:

  1. What Is Amazon SageMaker?
  2. Amazon SageMaker Studio
  3. Get Started with Amazon SageMaker

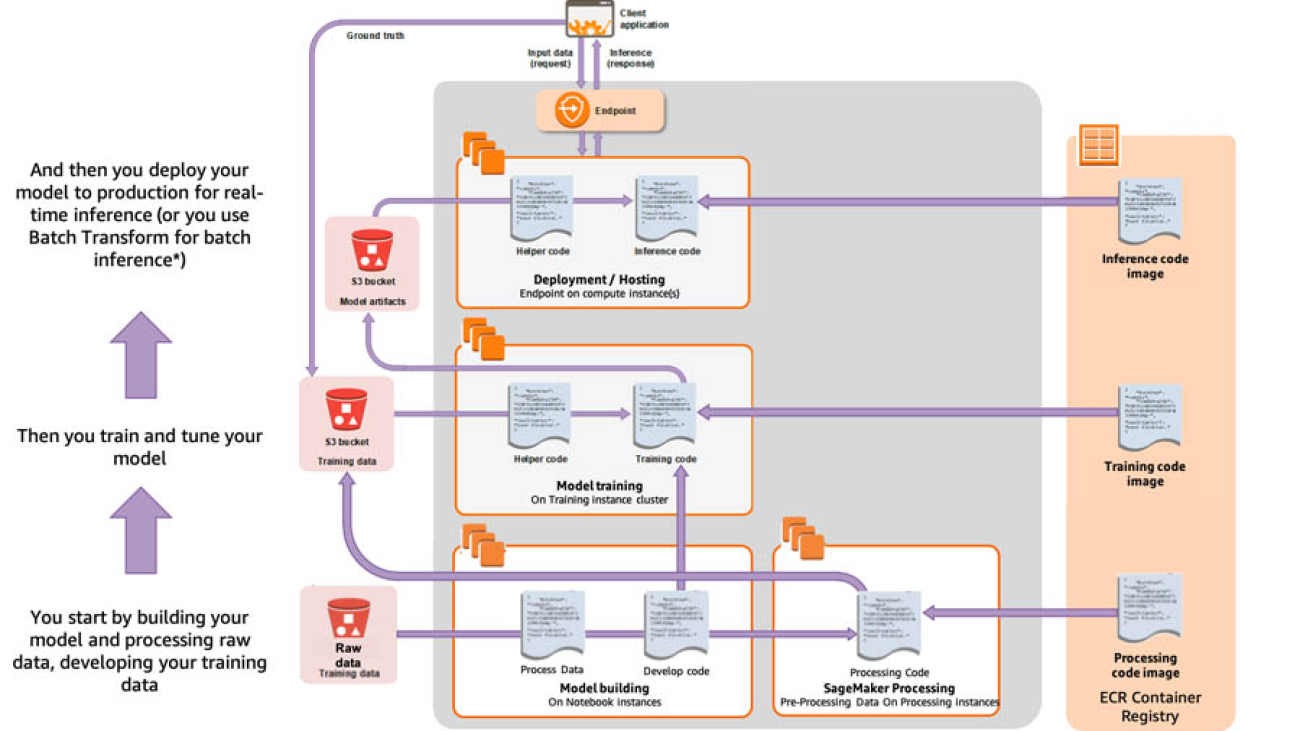
The following diagram is a simplified illustration of the modular design for each stage of the ML lifecycle. Each environment, called build, train (and tune), and deploy, use separate compute resources with different pricing.

For more information about the costs involved in your ML journey on Amazon SageMaker, see Lowering total cost of ownership for machine learning and increasing productivity with Amazon SageMaker.

With Amazon SageMaker, you pay only for what you use. Pricing within Amazon SageMaker is broken down by the ML stage: building, processing, training, and model deployment (or hosting), and further explained in this section.

Build environment

Amazon SageMaker offers two environments for building your ML models: SageMaker Studio Notebooks and on-demand notebook instances. Amazon SageMaker Studio is a fully integrated development environment for ML, using a collaborative, flexible, and managed Jupyter notebook experience. You can now access Amazon SageMaker Studio, the first fully integrated development environment (IDE), for free, and you only pay for the AWS services that you use within Studio. For more information, see Amazon SageMaker Studio Tour.

Prices for compute instances are the same for both Studio and on-demand instances, as outlined in Amazon SageMaker Pricing. With Studio, your notebooks and associated artifacts such as data files and scripts are persisted on Amazon Elastic File System (Amazon EFS). For more information about storage charges, see Amazon EFS Pricing.

An Amazon SageMaker on-demand notebook instance is a fully managed compute instance running the Jupyter Notebook app. Amazon SageMaker manages creating the instance and related resources. Notebooks contain everything needed to run or recreate an ML workflow. You can use Jupyter notebooks in your notebook instance to prepare and process data, write code to train models, deploy models to Amazon SageMaker hosting, and test or validate your models.

Processing

Amazon SageMaker Processing lets you easily run your preprocessing, postprocessing, and model evaluation workloads on a fully managed infrastructure. Amazon SageMaker manages the instances on your behalf, and launches the instances for the job and terminates the instances when the job is done. For more information, see Amazon SageMaker Processing – Fully Managed Data Processing and Model Evaluation.

Training and tuning

Depending on the size of your training dataset and how quickly you need the results, you can use resources ranging from a single general-purpose instance to a distributed cluster of GPU instances. Amazon SageMaker manages these resources on your behalf, and provisions, launches, and then stops and terminates the compute resources automatically for the training jobs. With Amazon SageMaker training and tuning, you only pay for the time the instances were consumed for training. For more information, see Train and tune a deep learning model at scale.

Amazon SageMaker automatic model tuning, also known as hyperparameter tuning, finds the best version of a model by running many training jobs on your dataset using the algorithm and ranges of hyperparameters that you specify on a cluster of instances you define. Similar to training, you only pay for the resources consumed during the tuning time.

Deployment and hosting

You can perform model deployment for inference in two different ways:

  • ML hosting for real-time inference – After you train your model, you can deploy it to get predictions in real time using a persistent endpoint with Amazon SageMaker hosting services
  • Batch transform – You can use Amazon SageMaker batch transform to get predictions on an entire dataset offline

The Amazon SageMaker pricing model

The following table summarizing the pricing model for Amazon SageMaker.

ML Compute Instance Storage Data Processing In/Out
Build (On-Demand Notebook Instances) Per instance-hour consumed while the notebook instance is running. Cost of GB-month of provisioned storage. No cost.
Build (Stuio Notebookes) Per instance-hour consumed while the instance is running. See Amaon Elastic File System (EFS) pricing. No cost.
Processing Per instance-hour consumed for each instance while the processing job is running. Cost of GB-month of provisioned storage. No cost.
Training and Tuning

On-Demand Instances: Per instance-hour consumed for each instance, from the time an instance is available for use until it is terminated or stopped. Each partial instance-hour consumed is billed per second.


Spot Training: Save up to 90% costs compared to on-demand instances by using managed spot training.

GB-month of provisioned storage. No cost.
Batch Transform Per instance-hour consumed for each instance while the batch transform job is running. No cost. No cost
Deployment (Hosting) Per instance-hour consumed for each instance while the endpoint is running. GB-month of provisioned storage. GB Data Processed IN and GB Data Processed OUT of the endpoint instance.

You can also get started with Amazon SageMaker with the free tier. For more information about pricing, see Amazon SageMaker Pricing.

Right-sizing compute resources for Amazon SageMaker notebooks, processing jobs, training, and deployment

With the pricing broken down based on time and resources you use in each stage of an ML lifecycle, you can optimize the cost of Amazon SageMaker and only pay for what you really need. In this section, we discuss general guidelines to help you choose the right resources for your Amazon SageMaker ML lifecycle.

Amazon SageMaker currently offers ML compute instances on the following instance families:

  • T – General-purpose burstable performance instances (when you don’t need consistently high levels of CPU, but benefit significantly from having full access to very fast CPUs when you need them)
  • M – General-purpose instances
  • C – Compute-optimized instances (ideal for compute bound applications)
  • R – Memory-optimized instances (designed to deliver fast performance for workloads that process large datasets in memory)
  • P, G and Inf – Accelerated compute instances (using hardware accelerators, or co-processors)
  • EIA – Inference acceleration instances (used for Amazon Elastic Inference)

Instance type consideration for a computational workload running on an Amazon SageMaker ML compute instance is no different than running on an Amazon Elastic Compute Cloud (Amazon EC2) instance. For more information about instance specifications, such as number of virtual CPU and amount of memory, see Amazon SageMaker Pricing.

Build environment

The Amazon SageMaker notebook instance environment is suitable for interactive data exploration, script writing, and prototyping of feature engineering and modeling. We recommend using notebooks with instances that are smaller in compute for interactive building and leaving the heavy lifting to ephemeral training, tuning, and processing jobs with larger instances, as explained in the following sections. This way, you don’t keep a large instance (or a GPU) constantly running with your notebook. This can help you minimize your build costs by selecting the right instance.

For the building stage, the size of an Amazon SageMaker on-demand notebook instance depends on the amount of data you need to load in-memory for meaningful exploratory data analyses (EDA) and the amount of computation required. We recommend starting small with general-purpose instances (such as T or M families) and scale up as needed.

The burstable T family of instances is ideal for notebook activity because computation only comes when you run a cell but you want full power from CPU. For example, ml.t2.medium is sufficient for most of basic data processing, feature engineering, and EDA that deal with small datasets that can be held within 4 GB memory. You can select an instance with larger memory capacity, such as ml.m5.12xlarge (192 GB memory), if you need to load significantly more data into the memory for feature engineering. If your feature engineering involves heavy computational work (such as image processing), you can use one of the compute-optimized C family instances, such as ml.c5.xlarge.

The benefit of Studio notebooks over on-demand notebook instances is that with Studio, the underlying compute resources are fully elastic and you can change the instance on the fly, allowing you to scale the compute up and down as your compute demand changes, for example from ml.t3.medium to ml.g4dn.xlarge as your build compute demand increases, without interrupting your work or managing infrastructure. Moving from one instance to another is seamless, and you can continue working while the instance launches. With on-demand notebook instances, you need to stop the instance, update the setting, and restart with the new instance type.

To keep your build costs down, we recommend stopping your on-demand notebook instances or shutting down your Studio instances when you don’t need them. In addition, you can use AWS Identity and Access Management (IAM) condition keys as an effective way to restrict certain instance types, such as GPU instances, for specific users, thereby controlling costs. We go into more detail in the section Recommendations for avoiding unnecessary costs.

Processing environment

After you complete data exploration and prototyping with a subset of your data and are ready to apply the preprocessing and transformation on the entire data, you can launch an Amazon SageMaker Processing job with your processing script that you authored during the EDA phase without scaling up the relatively small notebook instance you have been using. Amazon SageMaker Processing dispatches all things needed for processing the entire dataset, such as code, container, and data, to a compute infrastructure separate from the Amazon SageMaker notebook instance. Amazon SageMaker Processing takes care of the resource provisioning, data and artifact transfer, and shutdown of the infrastructure once the job finishes.

The benefit of using Amazon SageMaker Processing is that you only pay for the processing instances while the job is running. Therefore, you can take advantage of powerful instances without worrying too much about the cost. For example, as a general recommendation, you can use an ml.m5.4xlarge for medium jobs (MBs of GB of data), ml.c5.18xlarge for workloads requiring heavy computational capacity, or ml.r5.8xlarge when you want to load multiple GBs of data in memory for processing, and only pay for the time of the processing job. Sometimes, you may consider using a larger instance to get the job done quicker, and end up paying less in total cost of the job.

Alternatively, for distributed processing, you can use a cluster of smaller instances by increasing the instance count. For this purpose, you could shard input objects by Amazon Simple Storage Service (Amazon S3) key by setting s3_data_distribution_type='ShardedByS3Key' inside a ProcessingInput so that each instance receives about the same number of more manageable input objects, and instead you can use smaller instances in the cluster, leading to potential cost savings. Furthermore, you could perform the processing job asynchronously with .run(…, wait = False), as if you submit the job and get your notebook cell back immediately for other activities, leading to a more efficient use of your build compute instance time.

Training and tuning environment

The same compute paradigm and benefits for Amazon SageMaker Processing apply to Amazon SageMaker Training and Tuning. When you use fully managed Amazon SageMaker Training, it dispatches all things needed for a training job, such as code, container, and data, to a compute infrastructure separate from the Amazon SageMaker notebook instance. Therefore, your training jobs aren’t limited by the compute resource of the notebook instance. The Amazon SageMaker Training Python SDK also supports asynchronous training when you call .fit(…, wait = False). You get your notebook cell back immediately for other activities, such as calling .fit() again for another training job with a different ML compute instance for profiling purposes or a variation of the hyperparameter settings for experimentation purposes. Because ML training can often be a compute-intensive and time-consuming part of the ML lifecycle, with training jobs happening asynchronously in a remote compute infrastructure, you can safely shut down the notebook instance for cost-optimizing purposes if starting a training job is the last task of your day. We discuss how to automatically shut down unused, idle on-demand notebook instances in the section Recommendations for avoiding unnecessary costs.

Cost-optimization factors that you need to consider when selecting instances for training include the following:

  • Instance family – What type of instance is suitable for the training? You need to optimize for overall cost of training, and sometimes selecting a larger instance can lead to much faster training and thus less total cost; can the algorithm even utilize a GPU instance?
  • Instance size – What is the minimum compute and memory capacity your algorithm requires to run the training? Can you use distributed training?
  • Instance count – If you can use distributed training, what instance type (CPU or GPU) can you use in the cluster, and how many?

As for the choice of instance type, you could base your decision on what algorithms or frameworks you use for the workload. If you use the Amazon SageMaker built-in algorithms, which give you a head start without any sophisticated programming, see Instance types for built-in algorithms for detailed guidelines. For example, XGBoost currently only trains using CPUs. It is a memory-bound (as opposed to compute-bound) algorithm. So, a general-purpose compute instance (for example, M5) is a better choice than a compute-optimized instance (for example, C4).

Furthermore, we recommend having enough total memory in selected instances to hold the training data. Although it supports the use of disk space to handle data that doesn’t fit into main memory (the out-of-core feature available with the libsvm input mode), writing cache files onto disk slows the algorithm processing time. For the object detection algorithm, we support the following GPU instances for training:

  • ml.p2.xlarge
  • ml.p2.8xlarge
  • ml.p2.16xlarge
  • ml.p3.2xlarge
  • ml.p3.8xlarge
  • ml.p3.16xlarge

We recommend using GPU instances with more memory for training with large batch sizes. You can also run the algorithm on multi-GPU and multi-machine settings for distributed training.

If you’re bringing your own algorithms with script mode or with custom containers, you need to first clarify whether the framework or algorithm supports CPU, GPU, or both to decide the instance type to run the workload. For example, scikit-learn doesn’t support GPU, meaning that training with accelerated compute instances doesn’t result in any material gain in runtime but leads to overpaying for the instance. To determine which instance type and number of instances, if training in distributed fashion, for your workload, it’s highly recommended to profile your jobs to find the sweet spot between number of instance and runtime, which translates to cost. For more information, see Amazon Web Services achieves fasted training times for BERT and Mask R-CNN. You should also find the balance between instance type, number of instances, and runtime. For more information, see Train ALBERT for natural language processing with TensorFlow on Amazon SageMaker.

When it comes to GPU-powered P and G families of instances, you need to consider the differences. For example, P3 GPU compute instances are designed to handle large distributed training jobs for fastest time to train, whereas G4 instances are suitable for cost-effective, small-scale training jobs.

Another factor to consider in training is that you can select from either On-Demand Instances or Spot Instances. On-demand ML instances for training let you pay for ML compute capacity based on the time the instance is consumed, at on-demand rates. However, for jobs that can be interrupted or don’t need to start and stop at specific times, you can choose managed Spot Instances (Managed Spot Training). Amazon SageMaker can reduce the cost of training models by up to 90% over On-Demand Instances, and manages the Spot interruptions on your behalf.

Deployment/hosting environment

In many cases, up to 90% of the infrastructure spend for developing and running an ML application is on inference, making the need for high-performance, cost-effective ML inference infrastructure critical. This is mainly because the build and training jobs aren’t frequent and you only pay for the duration of build and training, but an endpoint instance is running all the time (while the instance is in service). Therefore, selecting the right way to host and the right type of instance can have a large impact on the total cost of ML projects.

For model deployment, it’s important to work backwards from your use case. What is the frequency of the prediction? Do you expect live traffic to your application and real-time response to your clients? Do you have many models trained for different subsets of data for the same use case? Does the prediction traffic fluctuate? Is latency of inference a concern?

There are hosting options from Amazon SageMaker for each of these situations. If your inference data comes in batches, Amazon SageMaker batch transform is a cost-effective way to obtain predictions with fully managed infrastructure provisioning and tear-down. If you have trained multiple models for one single use case, a multi-modal endpoint is a great way to save cost on hosting ML models that are trained on a per-user or segment basis. For more information, see Save on inference costs by using Amazon SageMaker multi-model endpoints.

After you decide how to host your models, load testing is the best practice to determine the appropriate instance type and fleet size, with or without autoscaling for your live endpoint to avoid over-provisioning and paying extra for capacity you don’t need. Algorithms that train most efficiently on GPUs might not benefit from GPUs for efficient inference. It’s important to load test to determine the most cost-effective solution. The following flowchart summarizes the decision process.

Amazon SageMaker offers different options for instance families that you can use for inference, from general-purpose instances to compute-optimized and GPU-powered instances. Each family is optimized for a different application, and not all instance types are suitable for inference jobs. For example, Amazon Inf1 instances offer high throughput and low latency and have the lowest cost per inference in the cloud. G4 instances for inference G4 have the lowest cost per inference for GPU instances and offer greater performance, lower latency, and reduced cost per inference for GPU instances. And P3 instances are optimized for training, and are designed to handle large distributed training jobs for fastest time to train, and thus not fully utilized for inference.

Another way to lower inference cost is to use Elastic Inference for cost savings of up to 75% on inference jobs. Picking an instance type and size for inference may not be easy, given the many factors involved. For example, for larger models, the inference latency of CPUs may not meet the needs of online applications, while the cost of a full-fledged GPU may not be justified. In addition, resources like RAM and CPU may be more important to the overall performance of your application than raw inference speed. With Elastic Inference, you attach just the right amount of GPU-powered inference acceleration to any Amazon compute instance. This is also available for Amazon SageMaker notebook instances and endpoints, bringing acceleration to built-in algorithms and to deep learning environments. This lets you select the best price/performance ratio for your application. For example, an ml.c5.large instance configured with eia1.medium acceleration costs you about 75% less than an ml.p2.xlarge, but with only 10–15% slower performance. For more information, see Amazon Elastic Inference – GPU-Powered Deep Learning Inference Acceleration.

In addition, you can use Auto Scaling for Amazon SageMaker to add and remove capacity or accelerated instances to your endpoints automatically, whenever needed. With this feature, instead of having to closely monitor inference volume and change the endpoint configuration in response, your endpoint automatically adjusts the number of instances up or down in response to actual workloads, determined by using Amazon CloudWatch metrics and target values defined in the policy. For more information, see AWS Auto Scaling.

Recommendations for avoiding unnecessary costs

Certain Amazon SageMaker resources (such as processing, training, tuning, and batch transform instances) are ephemeral, and Amazon SageMaker automatically launches the instance and terminates them when the job is done. However, other resources (such as build compute resources or hosting endpoints) aren’t ephemeral, and the user has control over when these resources should be stopped or terminated. Therefore, knowing how to identify idle resources and stopping them can lead to better cost-optimization. This section outlines some useful methods for automating these processes.

Build environment: Automatically stopping idle on-demand notebook instances

One way to avoid the cost of idle notebook instances is to automatically stop idle instances using lifecycle configurations. With lifecycle configuration in Amazon SageMaker, you can customize your notebook environment by installing packages or sample notebooks on your notebook instance, configuring networking and security for it, or otherwise use a shell script to customize it. Such flexibility allows you to have more control over how your notebook environment is set up and run.

AWS maintains a public repository of notebook lifecycle configuration scripts that address common use cases for customizing notebook instances, including a sample bash script for stopping idle notebooks.

You can configure your notebook instance using a lifecycle configuration to automatically stop itself if it’s idle for a certain period of time (a parameter that you set). The idle state for a Jupyter notebook is defined in the following GitHub issue. To create a new lifecycle configuration for this purpose, follow these steps:

  1. On the Amazon SageMaker console, choose Lifecycle configurations.
  2. Choose Create a new lifecycle configuration (if you are creating a new one).
  3. For Name, enter a name using alphanumeric characters and -, but no spaces. The name can have a maximum of 63 characters. For example, Stop-Idle-Instance.
  4. To create a script that runs when you create the notebook and every time you start it, choose Start notebook.
  5. In the Start notebook editor, enter the script.
  6. Choose Create configuration.

The bash script to use for this purpose can be found on AWS Samples repository for lifecycle configuration samples. This script is basically running a cron job at a specific period of idle time, as defined with parameter IDLE_TIME in the script. You can change this time to your preference and change the script as needed on the Lifecycle configuration page.

For this script to work, the notebook should meet these two criteria:

  • The notebook instance has internet connectivity to fetch the example config Python script (autostop.py) from the public repository
  • The notebook instance execution role permissions to SageMaker:StopNotebookInstance to stop the notebook and SageMaker:DescribeNotebookInstance to describe the notebook

If you create notebook instances in a VPC that doesn’t allow internet connectivity, you need to add the Python script inline in the bash script. The script is available on the GitHub repo. Enter it in your bash script as follows, and use this for lifecycle configuration instead:

#!/bin/bash
set -e
# PARAMETERS
IDLE_TIME=3600

echo "Creating the autostop.py"
cat << EOF > autostop.py
##
## [PASTE PYTHON SCRIPT FROM GIT REPO HERE]
##
EOF

echo "Starting the SageMaker autostop script in cron"
(crontab -l 2>/dev/null; echo "*/5 * * * * /usr/bin/python $PWD/autostop.py --time $IDLE_TIME --ignore-connections") | crontab -

The following screenshot shows how to choose the lifecycle configuration on the Amazon SageMaker console.

Alternatively, you can store the script on Amazon S3 and connect to the script through a VPC endpoint. For more information, see New – VPC Endpoint for Amazon S3.

Now that you have created the lifecycle configuration, you can assign it to your on-demand notebook instance when creating a new one or when updating existing notebooks. To create a notebook with your lifecycle configuration (for this post, Stop-Idle-Instance), you need to assign the script to the notebook under the Additional Configuration section. All other steps are the same as outlined in Create a On-Demand Notebook Instance. To attach the lifecycle configuration to an existing notebook, you first need to stop the on-demand notebook instance, and choose Update settings to make changes to the instance. You attach the lifecycle configuration in the Additional configuration section.

Build environment: Scheduling start and stop of on-demand notebook instances

Another approach is to schedule your notebooks to start and stop at specific times. For example, if you want to start your notebooks (such as notebooks of specific groups or all notebooks in your account) at 7:00 AM and stop all of them at 9:00 PM during weekdays (Monday through Friday), you can accomplish this by using Amazon CloudWatch Events and AWS Lambda functions. For more information about configuring your Lambda functions, see Configuring functions in the AWS Lambda console. To build the schedule for this use case, you can follow the steps in the following sections.

Starting notebooks with a Lambda function

To start your notebooks with a Lambda function, complete the following steps:

  1. On the Lambda console, create a Lambda function for starting on-demand notebook instances with specific keywords in their name. For this post, our development team’s on-demand notebook instances have names starting with dev-.
  2. Use Python as the runtime for the function, and name the function start-dev-notebooks.

Your Lambda function should have the SageMakerFullAccess policy attached to its execution IAM role.

  1. Enter the following script into the Function code editing area:
# Code to start InService Notebooks that contain specific keywords in their name
# Change "dev-" in NameContains to your specific use case

import boto3
client = boto3.client('sagemaker')
def lambda_handler(event, context):
    try:
        response_nb_list = client.list_notebook_instances(
            NameContains='dev-',     # Change this to your specific use case
            StatusEquals= 'Stopped'
                )
        for nb in response_nb_list['NotebookInstances']:
            response_nb_stop = client.start_notebook_instance(
                    NotebookInstanceName = nb['NotebookInstanceName'])
        return {"Status": "Success"} 
    except:
        return {"Status": "Failure"}
  1. Under Basic Settings, change Timeout to 15 minutes (max).

This step makes sure the function has the maximum allowable timeout range during stopping and starting multiple notebooks.

  1. Save your function.

Stopping notebooks with a Lambda function

To stop your notebooks with a Lambda function, follow the same steps, use the following script, and name the function stop-dev-notebooks:

# Code to stop InService Notebooks that contain specific keywords in their name
# Change "dev-" in NameContains to your specific use case

import boto3
client = boto3.client('sagemaker')
def lambda_handler(event, context):
    try:
        response_nb_list = client.list_notebook_instances(
            NameContains='dev-',     # Change this to your specific use case
            StatusEquals= 'InService'
                )
        for nb in response_nb_list['NotebookInstances']:
            response_nb_stop = client.stop_notebook_instance(
                    NotebookInstanceName = nb['NotebookInstanceName'])  
        return {"Status": "Success"}        
    except:
        return {"Status": "Failure"}

Creating a CloudWatch event

Now that you have created the functions, you need to create an event to trigger these functions on a specific schedule.

We use cron expression format for the schedule. For more information about creating your custom cron expression, see Schedule Expressions for Rules. All scheduled events use UTC time zone, and the minimum precision for schedules is 1 minute.

For example, the cron expression for 7:00 AM, Monday through Friday throughout the year, is 0 7 ? * MON-FRI *, and for 9:00 PM on the same days is 0 21 ? * MON-FRI *.

To create the event for stopping your instances on a specific schedule, complete the following steps:

  1. On the CloudWatch console, under Events, choose Rules.
  2. Choose Create rule.
  3. Under Event Source, select Schedule, and then select Cron expression.
  4. Enter your cron expression (for example, 21 ? * MON-FRI * for 9:00 PM Monday through Friday).
  5. Under Targets, choose Lambda function.
  6. Choose your function from the list (for this post, stop-dev-notebooks).
  7. Choose Configure details

  1. Add a name for your event, such as Stop-Notebooks-Event, and a description.
  2. Leave Enabled
  3. Choose Create.

You can follow the same steps to create scheduled event to start your notebooks on a schedule, such as 7:00 AM on weekdays, so when your staff start their day, the notebooks are ready and in service.

Hosting environment: Automatically detecting idle Amazon SageMaker endpoints

You can deploy your ML models as endpoints to test the model for real-time inference. Sometimes these endpoints are accidentally left in service, leading to ongoing charges on the account. You can automatically detect these endpoints and take corrective actions (such as deleting them) by using CloudWatch Events and Lambda functions. For example, you can detect if endpoints have been idle for the past number of hours (with no invocations over a certain period, such as 24 hours). The function script we provide in this section detects idle endpoints and publishes a message to an Amazon Simple Notification Service (Amazon SNS) topic with the list of idle endpoints. You can subscribe the account admins to this topic, and they receive emails with the list of idle endpoints when detected. To create this scheduled event, follow these steps:

  1. Create an SNS topic and subscribe your email or phone number to it.
  2. Create a Lambda function with the following script.
    1. Your Lambda function should have the following policies attached to its IAM execution role: CloudWatchReadOnlyAccess, AmazonSNSFullAccess, and AmazonSageMakerReadOnly.
import boto3
from datetime import datetime
from datetime import timedelta

def lambda_handler(event, context):
    
    idle_threshold_hr = 24               # Change this to your threshold in hours
    
    cw = boto3.client('cloudwatch')
    sm = boto3.client('sagemaker')
    sns = boto3.client('sns')
    
    try:
        inservice_endpoints = sm.list_endpoints(
            SortBy='CreationTime',
            SortOrder='Ascending',
            MaxResults=100,
            # NameContains='string',     # for example 'dev-'
            StatusEquals='InService'
        )
        
        idle_endpoints = []
        for ep in inservice_endpoints['Endpoints']:
            
            ep_describe = sm.describe_endpoint(
                    EndpointName=ep['EndpointName']
                )
    
            metric_response = cw.get_metric_statistics(
                Namespace='AWS/SageMaker',
                MetricName='Invocations',
                Dimensions=[
                    {
                        'Name': 'EndpointName',
                        'Value': ep['EndpointName']
                        },
                        {
                         'Name': 'VariantName',
                        'Value': ep_describe['ProductionVariants'][0]['VariantName']                  
                        }
                ],
                StartTime=datetime.utcnow()-timedelta(hours=idle_threshold_hr),
                EndTime=datetime.utcnow(),
                Period=int(idle_threshold_hr*60*60), 
                Statistics=['Sum'],
                Unit='None'
                )
    
            if len(metric_response['Datapoints'])==0:     
                idle_endpoints.append(ep['EndpointName'])
        
        if len(idle_endpoints) > 0:
            response_sns = sns.publish(
                TopicArn='YOUR SNS TOPIC ARN HERE',
                Message="The following endpoints have been idle for over {} hrs. Log on to Amazon SageMaker console to take actions.nn{}".format(idle_threshold_hr, 'n'.join(idle_endpoints)),
                Subject='Automated Notification: Idle Endpoints Detected',
                MessageStructure='string'
            )
    
        return {'Status': 'Success'}
    
    except:
        return {'Status': 'Fail'}

You can also revise this code to filter the endpoints based on resource tags. For more information, see AWS Python SDK Boto3 documentation.

Investigating endpoints

This script sends an email (or text message, depending on how the SNS topic is configured) with the list of detected idle endpoints. You can then sign in to the Amazon SageMaker console and investigate those endpoints, and delete them if you find them to be unused stray endpoints. To do so, complete the following steps:

  1. On the Amazon SageMaker console, under Inference, choose Endpoints.

You can see the list of all endpoints on your account in that Region.

  1. Select the endpoint that you want to investigate, and under Monitor, choose View invocation metrics.
  2. Under All metrics, select Invocations

You can see the invocation activities on the endpoint. If you notice no invocation event (or activity) for the duration of your interest, it means the endpoint isn’t in use and you can delete it.

  1. When you’re confident you want to delete the endpoint, go back to the list of endpoints, select the endpoint you want to delete, and under the Actions menu, choose

Conclusion

This post walked you through how Amazon SageMaker pricing works, best practices for right-sizing Amazon SageMaker compute resources for different stages of an ML project, and best practices for avoiding unnecessary costs of unused resources by either automatically stopping idle on-demand notebook instances or automatically detecting idle Amazon SageMaker endpoints so you can take corrective actions.

By understanding how Amazon SageMaker works and the pricing model for Amazon SageMaker resources, you can take steps in optimizing your total cost of ML projects even further.


About the authors

Nick Minaie is an Artificial Intelligence and Machine Learning (AI/ML) Specialist Solution Architect, helping customers on their journey to well-architected machine learning solutions at scale. In his spare time, Nick enjoys family time, abstract painting, and exploring nature.


Michael Hsieh is a Senior AI/ML Specialist Solutions Architect. He works with customers to advance their ML journey with a combination of AWS ML offerings and his ML domain knowledge. As a Seattle transplant, he loves exploring the great mother nature the city has to offer such as the hiking trails, scenic kayaking in the SLU, and the sunset at the Shilshole Bay.

Read More

Vision of AI: Startup Helps Diabetic Retinopathy Patients Retain Their Sight

Vision of AI: Startup Helps Diabetic Retinopathy Patients Retain Their Sight

Every year, 60,000 people go blind from diabetic retinopathy, a condition caused by damage to the blood vessels in the eye and a risk factor of high blood sugar levels.

Digital Diagnostics, a software-defined AI medical imaging company formerly known as IDx, is working to help those people retain their vision, using NVIDIA technology to do so.

The startup was founded a decade ago by Michael Abramoff, a retinal surgeon with a Ph.D. in computer science. While training as a surgeon, Abramoff often saw patients with diabetic retinopathy, or DR, that had progressed too far to be treated effectively, leading to permanent vision loss.

With the mission of increasing access to and quality of DR diagnosis, as well as decreasing its cost, Abramoff and his team have created an AI-based solution.

The company’s product, IDx-DR, takes images of the back of the eye, analyzes them and provides a diagnosis within minutes — referring the patient to a specialist for treatment if a more than mild case is detected.

The system is optimized on NVIDIA GPUs and its deep learning pipeline was built using the NVIDIA cuDNN library for high-performance GPU-accelerated operations. Training occurs using Amazon EC2 P3 instances featuring NVIDIA V100 Tensor Core GPUs and is based on images of DR cases confirmed by retinal specialists.

IDx-DR enables diagnostic tests to be completed in easily accessible settings like drugstores or primary care providers’ offices, rather than only at ophthalmology clinics, said John Bertrand, CEO at Digital Diagnostics.

“Moving care to locations the patient is already visiting improves access and avoids extra visits that overwhelm specialty physician schedules,” he said. “Patients avoid an extra copay and don’t have to take time off work for a second appointment.”

Autonomous, Not Just Assistive

“There are lots of good AI products specifically created to assist physicians and increase the detection rate of finding an abnormality,” said Bertrand. “But to allow physicians to practice to the top of their license, and reduce the costs of these low complexity tests, you need to use autonomous AI,” he said.

IDx-DR is the first FDA-cleared autonomous AI system — meaning that while the FDA has cleared many AI-based applications, IDx-DR was the first that doesn’t require physician oversight.

Clinical trials using IDx-DR consisted of machine operators who didn’t have prior experience taking retinal photographs, simulating the way the product would be used in the real world, according to Bertrand.

“Anyone with a high school diploma can perform the exam,” he said.

The platform has been deployed in more than 20 sites across the U.S., including Blessing Health System, in Illinois, where family medicine doctor Tim Beth said, “Digital Diagnostics has done well in developing an algorithm that can detect the possibility of early disease. We would be missing patients if we didn’t use IDx-DR.”

In addition to DR, Digital Diagnostics has created prototypes for products that diagnose glaucoma and age-related macular degeneration. The company is also looking to provide solutions for healthcare issues beyond eye-related conditions, including those related to the skin, nose and throat.

Stay up to date with the latest healthcare news from NVIDIA.

Digital Diagnostics is a Premier member of NVIDIA Inception, a program that supports AI startups with go-to-market support, expertise and technology.

The post Vision of AI: Startup Helps Diabetic Retinopathy Patients Retain Their Sight appeared first on The Official NVIDIA Blog.

Read More

Monitoring sleep positions for a healthy rest

Monitoring sleep positions for a healthy rest

MIT researchers have developed a wireless, private way to monitor a person’s sleep postures — whether snoozing on their back, stomach, or sides — using reflected radio signals from a small device mounted on a bedroom wall.

The device, called BodyCompass, is the first home-ready, radio-frequency-based system to provide accurate sleep data without cameras or sensors attached to the body, according to Shichao Yue, who will introduce the system in a presentation at the UbiComp 2020 conference on Sept. 15. The PhD student has used wireless sensing to study sleep stages and insomnia for several years.

“We thought sleep posture could be another impactful application of our system” for medical monitoring, says Yue, who worked on the project under the supervision of Professor Dina Katabi in the MIT Computer Science and Artificial Intelligence Laboratory. Studies show that stomach sleeping increases the risk of sudden death in people with epilepsy, he notes, and sleep posture could also be used to measure the progression of Parkinson’s disease as the condition robs a person of the ability to turn over in bed.

In the future, people might also use BodyCompass to keep track of their own sleep habits or to monitor infant sleeping, Yue says: “It can be either a medical device or a consumer product, depending on needs.”

Other authors on the conference paper, published in the Proceedings of the ACM on Interactive, Mobile, Wearable and Ubiquitous Technologies, include graduate students Yuzhe Yang and Hao Wang, and Katabi Lab affiliate Hariharan Rahul. Katabi is the Andrew and Erna Viterbi Professor of Electrical Engineering and Computer Science at MIT.

Restful reflections

BodyCompass works by analyzing the reflection of radio signals as they bounce off objects in a room, including the human body. Similar to a Wi-Fi router attached to the bedroom wall, the device sends and collects these signals as they return through multiple paths. The researchers then map the paths of these signals, working backward from the reflections to determine the body’s posture.

For this to work, however, the scientists needed a way to figure out which of the signals were bouncing off the sleeper’s body, and not bouncing off the mattress or a nightstand or an overhead fan. Yue and his colleagues realized that their past work in deciphering breathing patterns from radio signals could solve the problem.

Signals that bounce off a person’s chest and belly are uniquely modulated by breathing, they concluded. Once that breathing signal was identified as a way to “tag” reflections coming from the body, the researchers could analyze those reflections compared to the position of the device to determine how the person was lying in bed. (If a person was lying on her back, for instance, strong radio waves bouncing off her chest would be directed at the ceiling and then to the device on the wall.) “Identifying breathing as coding helped us to separate signals from the body from environmental reflections, allowing us to track where informative reflections are,” Yue says.

Reflections from the body are then analyzed by a customized neural network to infer how the body is angled in sleep. Because the neural network defines sleep postures according to angles, the device can distinguish between a sleeper lying on the right side from one who has merely tilted slightly to the right. This kind of fine-grained analysis would be especially important for epilepsy patients for whom sleeping in a prone position is correlated with sudden unexpected death, Yue says.

BodyCompass has some advantages over other ways of monitoring sleep posture, such as installing cameras in a person’s bedroom or attaching sensors directly to the person or their bed. Sensors can be uncomfortable to sleep with, and cameras reduce a person’s privacy, Yue notes. “Since we will only record essential information for detecting sleep posture, such as a person’s breathing signal during sleep,” he says, “it is nearly impossible for someone to infer other activities of the user from this data.”

An accurate compass

The research team tested BodyCompass’ accuracy over 200 hours of sleep data from 26 healthy people sleeping in their own bedrooms. At the start of the study, the subjects wore two accelerometers (sensors that detect movement) taped to their chest and stomach, to train the device’s neural network with “ground truth” data on their sleeping postures.

BodyCompass was most accurate — predicting the correct body posture 94 percent of the time — when the device was trained on a week’s worth of data. One night’s worth of training data yielded accurate results 87 percent of the time. BodyCompass could achieve 84 percent accuracy with just 16 minutes’ worth of data collected, when sleepers were asked to hold a few usual sleeping postures in front of the wireless sensor.

Along with epilepsy and Parkinson’s disease, BodyCompass could prove useful in treating patients vulnerable to bedsores and sleep apnea, since both conditions can be alleviated by changes in sleeping posture. Yue has his own interest as well: He suffers from migraines that seem to be affected by how he sleeps. “I sleep on my right side to avoid headache the next day,” he says, “but I’m not sure if there really is any correlation between sleep posture and migraines. Maybe this can help me find out if there is any relationship.”

For now, BodyCompass is a monitoring tool, but it may be paired someday with an alert that can prod sleepers to change their posture. “Researchers are working on mattresses that can slowly turn a patient to avoid dangerous sleep positions,” Yue says. “Future work may combine our sleep posture detector with such mattresses to move an epilepsy patient to a safer position if needed.”

Read More

Accelerating mmWave wireless research: How collaborations help us connect the unconnected

Accelerating mmWave wireless research: How collaborations help us connect the unconnected

Facebook Connectivity’s mission is to enable better, broader global connectivity to bring more people online to a faster internet. We collaborate with the industry, including telecom operators, community leaders, technology developers, and researchers in order to find solutions that are scalable and sustainable.

COVID-19 has shed light on the ever-increasing need for high-speed connectivity in the home. Since March, we have seen incredible increases in group calls, both in terms of volume and group sizes. People rely on a stable connection for remote learning and education, video conferencing, remote work, collaboration, and to simply connect with friends and family. Beyond the pandemic, having a reliable and fast connection plays an important role in making sure everyone in the world has access to online resources, tools, and experiences.

To learn more about Facebook Connectivity, we chatted with Julius Kusuma, Research Scientist at Facebook Connectivity. Julius came to Facebook about two years ago after spending some time working on subsurface and subsea connectivity systems. He’s worked in a number of areas in connectivity, including acoustic telemetry, electro-magnetics, and wireless — from megameter-wave and kilometer-wave to millimeter-wave systems.

In this Q&A, we ask Julius about his background, the role of millimeter-wave technology in connectivity, the importance of academic collaborations, and more.

Q: What brought you to Facebook Connectivity?

Julius Kusuma: When I first read about Facebook Connectivity, I was surprised to hear that half of the world’s population is still not connected to the internet. And for those who are, connectivity is often poor. Access to the internet has never been more important than it is today for education, work, and building global community. This speaks to me personally, as I rely on the internet to connect to my friends and family members around the world, especially now in light of the recent coronavirus pandemic.

Growing up, I was fortunate to have been able to learn about education opportunities thanks to the voiceband modem that my parents bought for me in middle school. Having access to basic email, a web browser, and newsgroups opened up the world to me. I went down countless rabbit holes learning about so many topics, and I even had to ask my parents for more data! Fortunately, having become friends with the local ISP that provided the service, they were kind enough to give me extra megabytes of data every once in a while to keep me going.

Today’s internet is much richer and more powerful than what I had access to at that time. We’d like to enable that for people everywhere.

At Facebook, I work in a small team that provides research-driven innovation to support Connectivity’s mission. My personal research spans several areas, including rural connectivity and wireless technologies. Connectivity challenges are complex and multi-dimensional, so I work with academic and industry partners with expertise in wireless communication, radio propagation modeling, electronics, algorithms, econometrics, and many others.

Q: What is millimeter-wave (mmWave) wireless technology and why is there so much interest in it within the field of connectivity?

JK: MmWave refers to radio waves in the 30–300 GHz frequency range, which corresponds to wavelengths in the 0.01–1 range mm, hence the name. This frequency band is higher than conventional bands used for wireless communication. MmWave allows for higher bandwidth, but its range is limited due to the physics of signal propagation. Therefore, we have to develop technologies to maintain good links and manage the network.

Due to its high frequency, it is possible to build very smart devices that can self-organize and self-optimize, using new technologies such as smart antennas, smart data management, and smart routing algorithms. It’s amazing to think that the mobile phone and Wi-Fi can work the way they do today. They have benefited from significant technology development over decades. With mmWave, we can provide another order of magnitude in performance gains, and to do so, we need to continue developing the right technologies to unleash the potential of mmWave, including tools for network planning and management.

We think mmWave plays an important role in connectivity because it allows for us to deploy a high-speed wireless link quickly and inexpensively, by using mmWave to build a self-organizing, self-optimizing network. Therefore, it can solve the “last mile problem” — the last connection to your home or premise.

Q: What is Facebook doing in mmWave technology development?

JK: One major project we are working on is Terragraph. It is a gigabit wireless technology that operates on 60 GHz unlicensed frequency band and delivers fiber-like speeds over the air in areas where trenching new fiber cables may be difficult or cost-prohibitive.

In many parts of the world, fiber access to consumers is cost-prohibitive and slow to deploy due to many factors, including permitting, trenching, and lack of access. Terragraph can be a better alternative to provide fiber-like speeds at a significantly lower cost. It’s also much faster to deploy and can be brought to market in a matter of weeks. To help evaluate Terragraph as a solution for high-speed fixed broadband connectivity and public Wi-Fi, YTL Communications conducted a large-scale trial in George Town, Malaysia, using the technology to connect businesses and offices that had only copper/DSL connections formerly.

A section of the Terragraph network deployed in George Town, Penang, Malaysia

As an emerging technology, there are many opportunities for exploration and research and development in mmWave. In our work, we engage closely with the research community through several channels.

First, along with Deutsche Telekom, we created and led the V-band mmWave Channel Sounder program in the Telecom Infra Project (TIP). Second, we are supporting research efforts such as the National Science Foundation’s Platforms for Advanced Wireless Research (PAWR). Third, we have direct research collaborations with a number of universities.

Q: What is the Telecom Infra Project?

JK: Founded by Deutsche Telekom, Intel, Facebook, Nokia, and SK Telecom in 2016, TIP is a global community of companies and organizations that are driving infrastructure solutions to advance global connectivity. Lack of flexibility in the current telecom infrastructure solutions makes it challenging for operators to efficiently build and upgrade networks in a scalable and sustainable way. Therefore, to succeed in Facebook’s mission, we need to help develop a strong ecosystem of researchers, engineering companies, product developers, telecom operators, and service providers. We see TIP as the vehicle to accelerate the telecom industry. Naturally, technology is at the heart of this endeavor.

As a research scientist, I am excited by the open and collaborative nature of TIP. This is exemplified in the recently completed mmWave Channel Sounder program. We wanted to empower the research community to do experimentation and exploration, so we invited applicants to submit proposals describing the experiments that could be done to characterize the mmWave radio channel. Awardees were then given mmWave channel sounder kits. Academic groups also received financial grants to assist in offsetting costs associated with performing the channel measurements.

This program supports the overall goals of the mmWave Networks Project Group to help facilitate the deployment of high-speed applications, such as Fixed Wireless Access, Smart City Connectivity, and Small Cell Backhaul with a focus on 60 GHz spectrum and 802.11ad/802.11ay technologies for outdoor transmission at street-level.

We recently published the findings as a report. Contributors to the report demonstrated mmWave performance in a wide range of use-cases and scenarios including indoor office spaces, urban canyons, suburban areas, and agricultural settings. The report also contains links to the data sets where available, hosted by the National Institute of Standards and Technology.

Q: Why are research collaborations important for Facebook Connectivity’s mission?

JK: Connectivity’s challenges are complex, vast, and diverse. We need the brightest minds to help us not only develop solutions, but also to better understand the problems, identify the opportunities, and build specialized solutions. This means that we need continuing investment in research and development to push the envelope further and further.

Therefore, we seek to complement and extend offerings from existing providers, community leaders, technology developers, and researchers. Open source and open innovations are key elements that empower collaborations. Speaking more personally, I work with a number of university and industry research groups, and a good example is the aforementioned Platform for Advanced Wireless Research, funded by the National Science Foundation (NSF).

PAWR is a research consortium that allows industry and academic collaborators to use research platforms to conduct experiments, build prototypes, and show demonstrations in an open, accessible way. This will accelerate the pathways from research to impact, so that fundamental research can quickly get to the field, benefit from testing, and be validated. This allows us to do experiments in realistic settings, which is very valuable and important. Access to such platforms allow us not only to prove the technology, but also to develop end-to-end workflows from planning to deployment to maintenance — to make sure it performs well, can provide reliable connectivity, and is sustainable.

Facebook Connectivity is a member of this consortium and we provide technologies, equipment, and expertise.

Q: How can the research community get involved?

JK: Development of solutions within TIP takes place in project groups, focusing on three strategic networks areas that collectively make up an end-to-end network: Access, Transport, and Core and Services. By dividing a network into these areas, TIP members can best identify areas in need of innovation and work together to build the right products. These project groups run research efforts and research projects, including grants programs.

Researchers are encouraged to join project groups in their areas of expertise, and get in touch with project group leads for more information. We will also be updating the Facebook Research and TIP websites for collaboration opportunities.

We are excited about the work done in the mmWave Channel Sounder program. Those interested in learning more can have a look at the report. We also have a number of publications showcasing our work in connectivity made available on our website. To learn about Facebook’s broader efforts in Connectivity, visit connectivity.fb.com.

To learn more about PAWR, check out their website.

Collaborative research is important to us, and from time to time we host events. For example, last year we hosted a Rural Connectivity Research Workshop on Facebook’s campus. Another avenue for academic researchers to engage with industry is through the TIP Summit. Finally, startups and early-stage technology developers should look at our new Facebook Accelerator program.

The post Accelerating mmWave wireless research: How collaborations help us connect the unconnected appeared first on Facebook Research.

Read More

Automated monitoring of your machine learning models with Amazon SageMaker Model Monitor and sending predictions to human review workflows using Amazon A2I

Automated monitoring of your machine learning models with Amazon SageMaker Model Monitor and sending predictions to human review workflows using Amazon A2I

When machine learning (ML) is deployed in production, monitoring the model is important for maintaining the quality of predictions. Although the statistical properties of the training data are known in advance, real-life data can gradually deviate over time and impact the prediction results of your model, a phenomenon known as data drift. Detecting these conditions in production can be challenging and time-consuming, and requires a system that captures incoming real-time data, performs statistical analyses, defines rules to detect drift, and sends alerts for rule violations. Furthermore, the process must be repeated for every new iteration of the model.

Amazon SageMaker Model Monitor enables you to continuously monitor ML models in production. You can set alerts to detect deviations in the model quality and take corrective actions, such as retraining models, auditing upstream systems, or fixing data quality issues. You can use insights from Model Monitor to proactively determine model prediction variance due to data drift and then use Amazon Augmented AI (Amazon A2I), a fully managed feature in Amazon SageMaker, to send ML inferences to human workflows for review. You can use Amazon A2I for multiple purposes, such as:

  • Reviewing results below a threshold
  • Human oversight and audit use cases
  • Augmenting AI and ML results as required

In this post, we show how to set up an ML workflow on Amazon SageMaker to train an XGBoost algorithm for breast cancer predictions. We deploy the model on a real-time inference endpoint, launch a model monitoring schedule, evaluate monitoring results, and trigger a human review loop for below-threshold predictions. We then show how the human loop workers review and update the predictions.

We walk you through the following steps using this accompanying Jupyter notebook:

  1. Preprocess your input dataset.
  2. Train an XGBoost model and deploy to a real-time endpoint.
  3. Generate baselines and start Model Monitor.
  4. Review the model monitor reports and derive insights.
  5. Set up a human review loop for low-confidence detection using Amazon A2I.

Prerequisites

Before getting started, you need to create your human workforce and set up your Amazon SageMaker Studio notebook.

Creating your human workforce

For this post, you create a private work team and add only one user (you) to it. For instructions, see Create an Amazon Cognito Workforce Using the Labeling Workforces Page.

Enter your email in the email addresses box for workers. To invite your colleagues to participate in reviewing tasks, include their email addresses in this box.

After you create your private team, you receive an email from no-reply@verificationemail.com that contains your workforce username, password, and a link that you can use to log in to the worker portal. Enter the username and password you received in the email to log in. You must then create a new, non-default password. This is your private worker’s interface.

When you create an Amazon A2I human review task using your private team (explained in the Starting a human loop section), your task should appear in the Jobs section. See the following screenshot.

After you create your private workforce, you can view it on the Labeling workforces page, on the Private tab.

Setting up your Amazon SageMaker Studio notebook

To set up your notebook, complete the following steps:

  1. Onboard to Amazon SageMaker Studio with the quick start procedure.
  2. When you create an AWS Identity and Access Management (IAM) role to the notebook instance, be sure to specify access to Amazon Simple Storage Service (Amazon S3). You can choose Any S3 Bucket or specify the S3 bucket you want to enable access to. You can use the AWS-managed policies AmazonSageMakerFullAccess and AmazonAugmentedAIFullAccess to grant general access to these two services.

  1. When user is created and is active, choose Open Studio.

  1. On the Studio landing page, from the File drop-down menu, choose New.
  2. Choose Terminal.

  1. In the terminal, enter the following code:
git clone https://github.com/aws-samples/amazon-a2i-sample-jupyter-notebooks

  1. Open the notebook by choosing Amazon-A2I-with-Amazon-SageMaker-Model-Monitor.ipynb in the amazon-a2i-sample-jupyter-notebooks folder.

Preprocessing your input dataset

You can follow the steps in this post using the accompanying Jupyter notebook. Make sure you provide an S3 bucket and a prefix of your choice. We then import the Python data science libraries and the Amazon SageMaker Python SDK that we need to run through our use case.

Loading the dataset

For this post, we use a dataset for breast cancer predictions from the UCI Machine Learning Repository. Please refer to the accompanying Jupyter notebook for the code to load and split this dataset. Based on the input features, we first train a model to detect a benign (label=0) or malignant (label=1) condition.

The following screenshot shows some of the rows in the training dataset.

Training and deploying an Amazon SageMaker XGBoost model

XGBoost (eXtreme Gradient Boosting) is a popular and efficient open-source implementation of the gradient boosted trees algorithm. For our use case, we use the binary:logistic objective. The model applies logistic regression for binary classification (in this example, whether a condition is benign or malignant). The output is a probability that represents the log likelihood of the Bernoulli distribution.

With Amazon SageMaker, you can use XGBoost as a built-in algorithm or framework. For this use case, we use the built-in algorithm. To specify the Amazon Elastic Container Registry (Amazon ECR) container location for Amazon SageMaker implementation of XGBoost, enter the following code:

from sagemaker.amazon.amazon_estimator import get_image_uri
container = get_image_uri(boto3.Session().region_name, 'xgboost', '1.0-1')

Creating the XGBoost estimator

We use the XGBoost container to construct an estimator using the Amazon SageMaker Estimator API and initiate a training job (the full walkthrough is available in the accompanying Jupyter notebook):

sess = sagemaker.Session()

xgb = sagemaker.estimator.Estimator(container,
                                    role, 
                                    train_instance_count=1, 
                                    train_instance_type='ml.m5.2xlarge',
                                    output_path='s3://{}/{}/output'.format(bucket, prefix),
                                    sagemaker_session=sess)

Specifying hyperparameters and starting training

We can now specify the hyperparameters for our training. You set hyperparameters to facilitate the estimation of model parameters from data. See the following code:

xgb.set_hyperparameters(max_depth=5,
                        eta=0.2,
                        gamma=4,
                        min_child_weight=6,
                        subsample=0.8,
                        silent=0,
                        objective='binary:logistic',
                        num_round=100)

xgb.fit({'train': s3_input_train, 'validation': s3_input_validation})

For more information, see XGBoost Parameters.

Deploying the XGBoost model

We deploy a model that’s hosted behind a real-time inference endpoint. As a prerequisite, we set up a data_capture_config for the Model Monitor after the endpoint is deployed, which enables Amazon SageMaker to collect the inference requests and responses for use in Model Monitor. For more information, see the accompanying notebook.

The deploy function returns a Predictor object that you can use for inference:

xgb_predictor = xgb.deploy(initial_instance_count=1,
                           instance_type='ml.m5.2xlarge',
                           endpoint_name=endpoint_name,
                           data_capture_config=data_capture_config)

Invoking the deployed model using the endpoint

You can now send data to this endpoint to get inferences in real time. The request and response payload, along with some additional metadata, is saved in the Amazon S3 location that you specified in DataCaptureConfig. You can follow the steps in the walkthrough notebook.

The following JSON code is an example of an inference request and response captured:

Starting Amazon SageMaker Model Monitor

Amazon SageMaker Model Monitor continuously monitors the quality of ML models in production. To start using Model Monitor, we create a baseline, inspect the baseline job results, and create a monitoring schedule.

Creating a baseline

The baseline calculations of statistics and constraints are needed as a standard against which data drift and other data quality issues can be detected. The training dataset is usually a good baseline dataset. The training dataset schema and the inference dataset schema should match (the number and order of the features). From the training dataset, you can ask Amazon SageMaker to suggest a set of baseline constraints and generate descriptive statistics to explore the data. To create the baseline, you can follow the detailed steps in the walkthrough notebook. See the following code:

# Start the baseline job
from sagemaker.model_monitor import DefaultModelMonitor
from sagemaker.model_monitor.dataset_format import DatasetFormat

my_default_monitor = DefaultModelMonitor(
    role=role,
    instance_count=1,
    instance_type='ml.m5.4xlarge',
    volume_size_in_gb=100,
    max_runtime_in_seconds=3600,
)

my_default_monitor.suggest_baseline(
    baseline_dataset=baseline_data_uri+'/train.csv',
    dataset_format=DatasetFormat.csv(header=False), # changed this to header=False since train.csv does not have header. 
    output_s3_uri=baseline_results_uri,
    wait=True
)

Inspecting baseline job results

When the baseline job is complete, we can inspect the results. Two files are generated:

  • statistics.json – This file is expected to have columnar statistics for each feature in the dataset that is analyzed. For the schema of this file, see Schema for Statistics.
  • constraints.json – This file is expected to have the constraints on the features observed. For the schema of this file, see Schema for Constraints.

Model Monitor computes per column/feature statistics. In the following screenshot, c0 and c1 in the name column refer to columns in the training dataset without the header row.

The constraints file is used to express the constraints that a dataset must satisfy. See the following screenshot.

Next we review the monitoring configuration in the constraints.json file:

  • datatype_check_threshold – During the baseline step, the generated constraints suggest the inferred data type for each column. You can tune the monitoring_config.datatype_check_threshold parameter to adjust the threshold for when it’s flagged as a violation.
  • domain_content_threshold – If there are more unknown values for a String field in the current dataset than in the baseline dataset, you can use this threshold to dictate if it needs to be flagged as a violation.
  • comparison_threshold – This value is used to calculate model drift.

For more information about constraints, see Schema for Constraints.

Create a monitoring schedule

With a monitoring schedule, Amazon SageMaker can start processing jobs at a specified frequency to analyze the data collected during a given period. Amazon SageMaker compares the dataset for the current analysis with the baseline statistics and constraints provided and generates a violations report. To create an hourly monitoring schedule, enter the following code:

from sagemaker.model_monitor import CronExpressionGenerator
from time import gmtime, strftime

mon_schedule_name = 'xgb-breast-cancer-' + strftime("%Y-%m-%d-%H-%M-%S", gmtime())
my_default_monitor.create_monitoring_schedule(
    monitor_schedule_name=mon_schedule_name,
    endpoint_input=xgb_predictor.endpoint,
    output_s3_uri=s3_report_path,
    statistics=my_default_monitor.baseline_statistics(),
    constraints=my_default_monitor.suggested_constraints(),
    schedule_cron_expression=CronExpressionGenerator.hourly(),
    enable_cloudwatch_metrics=True,

)

We then invoke the endpoint continuously to generate traffic for the model monitor to pick up. Because we set up an hourly schedule, we need to wait at least an hour for traffic to be detected.

Reviewing model monitoring

The violations file is generated as the output of a MonitoringExecution, which lists the results of evaluating the constraints (specified in the constraints.json file) against the current dataset that was analyzed. For more information about violation checks, see Schema for Violations. For our use case, the model monitor detects a data type mismatch violation in one of the requests sent to the endpoint. See the following screenshot.

For more details, see the walkthrough notebook.

Evaluating the results

To determine the next steps for our experiment, we should consider the following two perspectives:

  • Model Monitor violations: We only saw the datatype_check violation from the Model Monitor; we didn’t see a model drift violation. In our use case, Model Monitor uses the robust comparison method based on the two-sample K-S test to quantify the distance between the empirical distribution of our test dataset and the cumulative distribution of the baseline dataset. This distance didn’t exceed the value set for the comparison_threshold. The prediction results are aligned with the results in the training dataset.
  • Probability distribution of prediction results: We used a test dataset of 114 requests. Out of this, we see that the model predicts 60% of the requests to be malignant (over 90% probability output in the prediction results), 30% benign (less than 10% probability output in the prediction results), and the remaining 10% of the requests are indeterminate. The following chart summarizes these findings.

As a next step, you need to send the prediction results that are distributed with output probabilities of over 10% and less than 90% (because the model can’t predict with sufficient confidence) to a domain expert who can look at the model results and identify if the tumor is benign or malignant. You use Amazon A2I to set up a human review workflow and define conditions for activating the review loop.

Starting the human review workflow

To configure your human review workflow, you complete the following high-level steps:

  1. Create the human task UI.
  2. Create the workflow definition.
  3. Set the trigger conditions to activate the human loop.
  4. Start your human loop.
  5. Check that the human loop tasks are complete.

Creating the human task UI

The following example code shows how to create a human task UI resource, giving a UI template in liquid HTML. This template is rendered to the human workers whenever a human loop is required. You can follow through the complete steps using the accompanying Jupyter notebook. After the template is defined, set up the UI task function and run it.

def create_task_ui():
    '''
    Creates a Human Task UI resource.

    Returns:
    struct: HumanTaskUiArn
    '''
    response = sagemaker_client.create_human_task_ui(
        HumanTaskUiName=taskUIName,
        UiTemplate={'Content': template})
    return response
# Create task UI
humanTaskUiResponse = create_task_ui()
humanTaskUiArn = humanTaskUiResponse['HumanTaskUiArn']
print(humanTaskUiArn)

Creating the workflow definition

We create the flow definition to specify the following:

  • The workforce that your tasks are sent to.
  • The instructions that your workforce receives. This is specified using a worker task template.
  • Where your output data is stored.

See the following code:

create_workflow_definition_response = sagemaker_client.create_flow_definition(
        FlowDefinitionName= flowDefinitionName,
        RoleArn= role,
        HumanLoopConfig= {
            "WorkteamArn": WORKTEAM_ARN,
            "HumanTaskUiArn": humanTaskUiArn,
            "TaskCount": 1,
            "TaskDescription": "Review the model predictions and determine if you agree or disagree. Assign a label of 1 to indicate malignant result or 0 to indicate a benign result based on your review of the inference request",
            "TaskTitle": "Using Model Monitor and A2I Demo"
        },
        OutputConfig={
            "S3OutputPath" : OUTPUT_PATH
        }
    )
flowDefinitionArn = create_workflow_definition_response['FlowDefinitionArn'] # let's save this ARN for future use

Setting trigger conditions for human loop activation

We need to send the prediction results that are distributed with output probabilities of over 10% and under 90% (because the model can’t predict with sufficient confidence in this range). We use this as our activation condition, as shown in the following code:

# assign our original test dataset 
model_data_categorical = test_data[list(test_data.columns)[1:]]  

LOWER_THRESHOLD = 0.1
UPPER_THRESHOLD = 0.9
small_payload_df = model_data_categorical.head(len(predictions))
small_payload_df['prediction_prob'] = predictions
small_payload_df_res = small_payload_df.loc[
    (small_payload_df['prediction_prob'] > LOWER_THRESHOLD) &
    (small_payload_df['prediction_prob'] < UPPER_THRESHOLD)
]
print(small_payload_df_res.shape)
small_payload_df_res.head(10)

Starting a human loop

A human loop starts your human review workflow and sends data review tasks to human workers. See the following code:

# Activate human loops
import json
humanLoopName = str(uuid.uuid4())

start_loop_response = a2i.start_human_loop(
            HumanLoopName=humanLoopName,
            FlowDefinitionArn=flowDefinitionArn,
            HumanLoopInput={
                "InputContent": json.dumps(ip_content)
            }
        )

The workers in this use case are domain experts that can validate the request features and determine if the result is malignant or benign. The task requires reviewing the model predictions, agreeing or disagreeing, and updating the prediction as 1 for malignant and 0 for benign. The following screenshot shows a sample of tasks received.

The following screenshot shows updated predictions.

For more information about task UI design for tabular datasets, see Using Amazon SageMaker with Amazon Augmented AI for human review of Tabular data and ML predictions.

Checking the status of task completion and human loop

To check the status of the task and the human loop, enter the following code:

completed_human_loops = []
resp = a2i.describe_human_loop(HumanLoopName=humanLoopName)
print(f'HumanLoop Name: {humanLoopName}')
print(f'HumanLoop Status: {resp["HumanLoopStatus"]}')
print(f'HumanLoop Output Destination: {resp["HumanLoopOutput"]}')
print('n')
    
if resp["HumanLoopStatus"] == "Completed":
    completed_human_loops.append(resp)

When the human loop tasks are complete, we inspect the results of the review and the corrections made to prediction results.

You can use the human-labeled output to augment the training dataset for retraining. This keeps the distribution variance within the threshold and prevents data drift, thereby improving model accuracy. For more information about using Amazon A2I outputs for model retraining, see Object detection and model retraining with Amazon SageMaker and Amazon Augmented AI.

Cleaning up

To avoid incurring unnecessary charges, delete the resources used in this walkthrough when not in use, including the following:

Conclusion

This post demonstrated how you can use Amazon SageMaker Model Monitor and Amazon A2I to set up a monitoring schedule for your Amazon SageMaker model endpoints; specify baselines that include constraint thresholds; observe inference traffic; derive insights such as model drift, completeness, and data type violations; and send the low-confidence predictions to a human workflow with labelers to review and update the results. For video presentations, sample Jupyter notebooks, and more information about use cases like document processing, content moderation, sentiment analysis, object detection, text translation, and more, see Amazon A2I Resources.


References

[1] Dua, D. and Graff, C. (2019). UCI Machine Learning Repository [http://archive.ics.uci.edu/ml]. Irvine, CA: University of California, School of Information and Computer Science.


About the Authors


Prem Ranga is an Enterprise Solutions Architect at AWS based out of Houston, Texas. He is part of the Machine Learning Technical Field Community and loves working with customers on their ML and AI journey. Prem is passionate about robotics, is an Autonomous Vehicles researcher, and also built the Alexa-controlled Beer Pours in Houston and other locations.


Jasper Huang is a Technical Writer Intern at AWS and a student at the University of Pennsylvania pursuing a BS and MS in computer science. His interests include cloud computing, machine learning, and how these technologies can be leveraged to solve interesting and complex problems. Outside of work, you can find Jasper playing tennis, hiking, or reading about emerging trends.


Talia Chopra is a Technical Writer in AWS specializing in machine learning and artificial intelligence. She works with multiple teams in AWS to create technical documentation and tutorials for customers using Amazon SageMaker, MxNet, and AutoGluon. In her free time, she enjoys meditating, studying machine learning, and taking walks in nature.


Read More

RENGA Inc. automates code reviews with Amazon CodeGuru

RENGA Inc. automates code reviews with Amazon CodeGuru

This guest post was authored by Kazuma Ohara, Director of RENGA Inc., and edited by Yumiko Kanasugi, Solutions Architect at AWS Japan.

RENGA Inc. operates Mansion Note, one of Japan’s most popular condominium review and rating websites, which gets over a million unique visitors per month. Mansion Note provides a service where people can check reviews and rankings of condominiums and apartments all over Japan. People of all positions, such as current residents, former residents, neighbors, experts, real estate agents, and property owners, clarify their positions first and then post and share their candid opinions and reviews about the condominiums. This “wisdom of crowds” is expected to help potential buyers and tenants better imagine their new home before moving in, and can help eliminate regrets such as, “This is different from what I expected,” or, “I should have chosen a different condo.”

The company has a total of six engineers, including myself. Code reviews have been an essential process in our development, because RENGA takes code quality very seriously. The company, however, used to face a challenge in which code review tasks increased in proportion to the quantity of development, which led to an increased burden on reviewers. Also, no matter how many times we reviewed code, some bugs remained unnoticed, so we needed a mechanism to conduct code reviews more exhaustively.

We saw the announcement of Amazon CodeGuru at re:Invent 2019. The moment we learned that CodeGuru is a machine learning (ML)-based code review service, we knew it was exactly the tool we were looking for. At the time of the announcement, we were making significant improvements to our source code, so we thought that CodeGuru Reviewer might help us with that. We decided to adopt the tool, and it pointed out issues that neither our members nor other static analytics tools had ever detected. In this post, I talk about why RENGA decided to adopt CodeGuru, as well as its adoption process.

Maintaining code quality

RENGA was founded in 2012; 2020 marks its 8th anniversary. Although our product is getting mature, we still invest a lot of resources in development so we can extend features quickly. We not only accelerate the development cycle, but also give the same level of priority to maintaining code quality. When extending features, poor quality code adds complexity to the system and can become a technical debt. On the other hand, as long as consistent code quality is maintained, scaling the system doesn’t prevent developers from extending features, because the code itself is simple. Keeping the balance between agility and quality is important, especially for startups that continuously release new features.

RENGA has a two-step code review process. When a developer commits a fix to our remote repository on GitHub and makes a pull request, two senior members review it first. Then I do the final check and merge it into the primary branch (unless I find an issue). We also check the minimum coding rules using Checkstyle during the build phase.

In the past, we had a challenge with the cost and quality of code reviews. As the amount of code increased at RENGA, the burden on reviewers also increased. We spend about 5% of our development time on code reviews, and reviewers spend an additional 1 hour a day on average for code reviews. Code reviews can, however, be a bottleneck when we want to quickly release new features and promptly deliver those values to our users. Also, the more code we need to review, the less accurate it is to identify issues, and some issues may even be overlooked. One solution is to increase reviewers, but that isn’t easy because code reviews require not only extensive business and technical knowledge, but also an understanding of the top modules. So we needed an automated tool that could offload the reviewers’ workload.

Adopting CodeGuru Reviewer

CodeGuru Reviewer is an automated tool that you can seamlessly integrate into your development pipeline, so we found it very easy to adopt the tool. We had high expectations that the tool may not only solve cost issues, but also help us gain insights from a different perspective than humans because the tool is based on ML. The tool was still in the preview stage, but upon being offered a free tier, we decided to try it out.

The following architecture illustrates RENGA’s development pipeline.

Setting up CodeGuru Reviewer is very easy. All you need to do is select a repository on GitHub and associate it with the tool. AWS recommends that you create a new GitHub user for CodeGuru Reviewer before associating a GitHub repository with the tool. CodeGuru Reviewer is enabled after the association is complete.

The following screenshot shows the Associate repository page on the CodeGuru console.

CodeGuru Reviewer is triggered by a pull request. The tool provides recommendations by adding comments to the pull request, usually within 15 minutes after the request is made.

The following text is a recommendation that CodeGuru Reviewer generated:

It is more efficient to directly use Stream::min or Stream::max than Stream::sorted and Stream::findFirst. The former is O(n) in terms of time while the latter is not. Also the former is O(1) and the latter is O(n) in terms of memory.

The part of the code the recommendation pointed out was actually not a bottleneck, but it did help us improve performance. Learning this method has helped our developers code better with more confidence.

The following text is another example of a recommendation from CodeGuru Reviewer:

Consider closing the resource returned by the following method call: newInputStream. Currently, there are execution paths that do not contain closure statements, e.g., when exception is thrown by SampleData.read. Either a) close the object returned by newInputStream() in a try-finally block or b) close the resource by declaring the object returned by newInputStream() in a try-with-resources block.

Although there was no actual resource leakage, we modified the part that was pointed out to clarify that no leakage will occur, which improved the code readability.

After adopting CodeGuru Reviewer, we feel that the product generates fewer recommendations compared to other existing static analytics tools, but it provides highly accurate recommendations with less false-positive advice. Too many recommendations require extra time for triage, so accurate recommendations are a big bonus for busy developers.

Summary

Although the code review process is important, it shouldn’t increase the workload for reviewers and become a bottleneck in development. By adopting CodeGuru Reviewer, we successfully automated code reviews and reduced reviewers’ workloads. Furthermore, learning the best practices of coding—which we weren’t aware of—has helped us develop with more confidence. Going forward, we plan on measuring metrics such as cyclomatic complexity so we can provide higher-quality services to our customers promptly. We also expect that CodeGuru Reviewer will further expand its recommendation items.


About the Authors

Kazuma Ohara is the Director of RENGA Inc., an internet services company headquartered in Japan.


Yumiko Kanasugi is a Solutions Architect with Amazon Web Services Japan, supporting digital native business customers to utilize AWS.

Read More