We present a framework for gesture customization requiring minimal examples from users, all without degrading the performance of existing gesture sets. To achieve this, we first deployed a large-scale study (N=500+) to collect data and train an accelerometer-gyroscope recognition model with a cross-user accuracy of 95.7% and a false-positive rate of 0.6 per hour when tested on everyday non-gesture data. Next, we design a few-shot learning framework which derives a lightweight model from our pre-trained model, enabling knowledge transfer without performance degradation. We validate our approach…Apple Machine Learning Research
Learning Compressed Embeddings for On-Device Inference
In deep learning, embeddings are widely used to represent categorical entities such as words, apps, and movies. An embedding layer maps each entity to a unique vector, causing the layer’s memory requirement to be proportional to the number of entities. In the recommendation domain, a given category can have hundreds of thousands of entities, and its embedding layer can take gigabytes of memory. The scale of these networks makes them difficult to deploy in resource constrained environments, such as smartphones. In this paper, we propose a novel approach for reducing the size of an embedding…Apple Machine Learning Research
Towards Complete Icon Labeling in Mobile Applications
Accurately recognizing icon types in mobile applications is integral to many tasks, including accessibility improvement, UI design search, and conversational agents. Existing research focuses on recognizing the most frequent icon types, but these technologies fail when encountering an unrecognized low-frequency icon. In this paper, we work towards complete coverage of icons in the wild. After annotating a large-scale icon dataset (327,879 icons) from iPhone apps, we found a highly uneven distribution: 98 common icon types covered 92.8% of icons, while 7.2% of icons were covered by more than…Apple Machine Learning Research
Understanding Screen Relationships from Screenshots of Smartphone Applications
All graphical user interfaces are comprised of one or more screens that may be shown to the user depending on their interactions. Identifying different screens of an app and understanding the type of changes that happen on the screens is a challenging task that can be applied in many areas including automatic app crawling, playback of app automation macros and large scale app dataset analysis. For example, an automated app crawler needs to understand if the screen it is currently viewing is the same as any previous screen that it has encountered, so it can focus its efforts on portions of the…Apple Machine Learning Research
Neural Fisher Kernel: Low-rank Approximation and Knowledge Distillation
In this paper, we study the representation of neural networks from the view of kernels. We first define the Neural Fisher Kernel (NFK), which is the Fisher Kernel applied to neural networks. We show that NFK can be computed for both supervised and unsupervised learning models, which can serve as a unified tool for representation extraction. Furthermore, we show that practical NFKs exhibit low-rank structures. We then propose an efficient algorithm that computes a low rank approximation of NFK, which scales to large datasets and networks. We show that the low-rank approximation of NFKs derived…Apple Machine Learning Research
Edouard Belval: From AWS intern to research engineer
How he parlayed an internship to land an expanded role at Amazon while pursuing his master’s degree.Read More
Polestar’s Dennis Nobelius on the Sustainable Performance Brand’s Plans
Four words: smart, sustainable, Super Bowl. Polestar’s commercial during the big game made it clear no-compromise electric vehicles are now mainstream.
Polestar Chief Operating Officer Dennis Nobelius sees driving enjoyment and autonomous-driving capabilities complementing one another in sustainable vehicles that keep driving — and the driver — front and center.
NVIDIA’s Katie Washabaugh spoke with Nobelius for the latest episode of the AI Podcast about the role the performance brand will play as vehicles become greener and more autonomous.
Nobelius touched on the sustainable automaker’s plans to unveil its third vehicle, the Polestar 3, the tech inside it, and what the company’s racing heritage brings to the intersection of smarts and sustainability.
You Might Also Like
NVIDIA’s Liila Torabi Talks the New Era of Robotics Through Isaac Sim
Robots aren’t limited to the assembly line. Liila Torabi, senior product manager for Isaac Sim, a robotics and AI simulation platform powered by NVIDIA Omniverse, talks about where the field’s headed.
GANTheftAuto: Harrison Kinsley on AI-Generated Gaming Environments
Humans playing games against machines is nothing new, but now computers can develop their own games for people to play. Programming enthusiast and social media influencer Harrison Kinsley created GANTheftAuto, an AI-based neural network that generates a playable chunk of the classic video game Grand Theft Auto V.
The Driving Force: How Ford Uses AI to Create Diverse Driving Data
The neural networks powering autonomous vehicles require petabytes of driving data to learn how to operate. Nikita Jaipuria and Rohan Bhasin from Ford Motor Company explain how they use generative adversarial networks (GANs) to fill in the gaps of real-world data used in AV training.
Subscribe to the AI Podcast: Now available on Amazon Music
You can now listen to the AI Podcast through Amazon Music.
You can also get the AI Podcast through iTunes, Google Podcasts, Google Play, Castbox, DoggCatcher, Overcast, PlayerFM, Pocket Casts, Podbay, PodBean, PodCruncher, PodKicker, Soundcloud, Spotify, Stitcher and TuneIn.
Make the AI Podcast Better: Have a few minutes to spare? Fill out our listener survey.
The post Polestar’s Dennis Nobelius on the Sustainable Performance Brand’s Plans appeared first on NVIDIA Blog.
How LinkedIn Personalized Performance for Millions of Members using Tensorflow.js
A guest post by LinkedIn
Mark Pascual, Sr. Staff Engineer
Nitin Pasumarthy, Staff Engineer
Introduction
The Performance team at LinkedIn optimizes latency to load web and mobile pages. Faster sites improve customer engagement and eventually revenue to LinkedIn. This concept is well documented by many other companies too who have had similar experiences but how do you define the optimal trade off between page load times and engagement?
The relationship between speed and engagement is non-linear. Fast loading sites, after a point, may not increase engagement by further reducing their load times. At LinkedIn we have used this relationship between engagement and speed to selectively customize the features on LinkedIn Lite – a lighter, faster version of LinkedIn, specifically built for mobile web browsers.

To do this, we trained a deep neural network to identify if a request to LinkedIn would result in a fast page load in real time. Based on the performance quality result predicted by this model we change the resolution of all images on a given user’s news feed before the resulting webpage was sent to the client. This led to an increase in the magnitude of billions for extra Feed Viral Actions (+0.23%) taken, millions more Engaged Feed Users (+0.16%) and Sponsored Revenue increased significantly for us too (+0.76%).
 |
| Image Quality Comparison: Image on the left uses 4x more memory than the one on the right which is less than ideal to send to users on slow network connections or when the device may be low on resources. Prior to using an ML model, we only showed the low resolution image which was not great for users that had capacity for higher quality images on newer devices. |
We described in great detail why many of our performance optimization experiments failed back in 2017 and how we used those learnings to build a Performance Quality Model (PQM) in our Personalizing Performance: Adapting Application in real time to member environments blog.
PQM’s bold goal is to predict various performance metrics (e.g. page load time) of any web / mobile page using both device and network characteristics of end users to empower (web) developers to build impactful application features that are otherwise tricky to implement (like the one we described above).
We are happy to announce that we are open sourcing our first performance quality model that is trained on millions of RUM data samples from around the world free to use for your own website performance optimizations! Learn more and get started here.
In the rest of this blog, we will go over how our team of full stack developers deployed this PQM in production that works at Linkedin scale! We wish to prove that deploying TensorFlow.js ML models today is both easy and beneficial for those working on the Node.js stack.
TensorFlow.js: Model Deployment in Node.js
At the time of our production deployment, LinkedIn’s TensorFlow model deployment machinery was still being developed. Furthermore, using TensorFlow Serving was not yet a feasible option for us. So even though we had a model ready for use, we needed to figure out a way to deploy it.
As LinkedIn is primarily a Java/JVM stack for serving external traffic, it might seem like TensorFlow Java would be ideal, but it was still experimental and didn’t have the API stability guarantees that we require.
We looked at our options and realized that we already use Node.js (behind the JVM) as part of our frontend web serving stack in order to perform server side optimizations when serving HTML pages. The architecture for this is unique in that we use the JVM to manage an external pool of Node.js processes to perform “work,” e.g., the previously mentioned server side optimizations. The “work” can really be anything that Node.js can perform. In our use case, this enables us to use TensorFlow.js in an architecture that was already proven.
We repurposed our frontend stack to use Node.js to deploy our custom model and ended up with great results. In terms of performance, our mixed stack of Java and Node.js easily met our SLAs. The 50th and 90th percentile production latencies as measured (a) from a client (within the datacenter), (b) from on host instrumentation, and (c) in terms of only Node.js performing inference using TensorFlow.js are shown in the table below.
|
50th Percentile |
90th Percentile |
|
|
From client (within datacenter) |
10 ms |
12 ms |
|
On host |
8 ms |
10 ms |
|
Inference in Node.js |
2 ms |
3 ms |
The resulting architecture is shown above in Figure 1 below.
 |
The API request that requires a prediction is received by the JVM server and is routed to our Rest.li infrastructure which in turn routes the request to our performance prediction resource. To handle the request, the PaaS resource performs some feature generation based on the inputs and then makes an RPC call out to the Node.js process for the prediction.
The N Node.js processes are long-lived. They are started upon JVM startup and have already loaded the desired model using tf.node.loadSavedModel(). When a process receives a request for a prediction, it simply takes the input features, calls tf_model.predict(), and returns the result. Here is a simplified version of the Node.js code:
const tf = require(‘@tensorflow/tfjs-node’);

async function main() {
  // load the model when the process starts so it’s always ready
  const model = await tf.node.loadSavedModel(‘model_dir’);

  function predict(rawInput) {
    return tf.tidy(() => {
      // prepare the inputs as tensor arrays
      const x = {}
      for (const feature of Object.keys(predictionInput)) {
        x[feature] = tf.tensor([input[feature]], [1, 1]);
      }

      const output = model.predict(x, {});
      const probs = Array.from(output.probabilities.dataSync());
      const classes = Array.from(output.all_class_ids.dataSync());
      const result = Object.fromEntries(classes.map((classId, i) => [classId, probs[i]]));
      return result; // {0: 0.8, 1: 0.15, 2: 0.05} probability of each performance quality
    });
  }

  // Register our ‘predict’ RPC handler (pseudo-code)
  // process is an abstraction of the Node.js side of the communication channel
  // with the JVM
  process.registerHandler(‘predict’, input => {
    const result = predict(input);
    return Promise.resolve(result);
  });
}

main();
The API request that requires a prediction is received by the JVM server and is routed to our Rest.li infrastructure which in turn routes the request to our performance prediction resource. To handle the request, the PaaS resource performs some feature generation based on the inputs and then makes an RPC call out to the Node.js process for the prediction.
The N Node.js processes are long-lived. They are started upon JVM startup and have already loaded the desired model using tf.node.loadSavedModel(). When a process receives a request for a prediction, it simply takes the input features, calls tf_model.predict(), and returns the result. Here is a simplified version of the Node.js code:
 |
Express could replace Rest.li’s role and the feature generation pieces would need to be ported to Node.js, but everything else remains the same. As you can see, the architecture is cleaner and requires less mental hoops to manage both Java and Node.js in the same stack.
An Unexpected Win
In the architecture we described above, the external processes do not have to be Node.js. The library that we use to manage the external process is pretty straightforward to implement in most technologies. In fact, we could have chosen Python for the external processes as it’s popular for this ML use case. So what are the reasons we stuck with Node.js? Well, there’s two: (1) we already had a Node.js implementation for the external process infrastructure and would have had to develop a new one for Python, and (2) it turns out that Node.js is also slightly faster at making the predictions due to the pre/post processing benefitting from the JIT compiler of JavaScript.
In order to prove this to ourselves, we took samples (~100k) from our real world prediction inputs and ran them against both Node.js and Python. The test bed was not exactly our production stack (we didn’t include the JVM side), but it was close enough for our purposes. The results are shown below:
|
Stack |
50th percentile |
Delta (from Python) |
|
Python |
1.872 ms |
0% |
|
Node.js |
1.713 ms |
-8.47% |
The results show that Node.js is almost 10% faster at performing inference for our specific model. Of course, performance may vary based on model architectures and the amount of pre and post processing being performed in Node. These results were from our model running on a typical production machine. Results may also vary due to model complexity, machine differences, and so on.
Checkout our README in the open source repo to find out how we tested the model in Python and Node.js.
Looking to the future
Our current unique architecture does have some areas for improvement. Probably the biggest opportunity is to address the uniqueness of this multi stack architecture itself. The mix of both Java and Node.js technologies adds additional cognitive overhead and complexity during design, development, debugging, operations, maintenance – however as previously stated you could move the whole stack to Node to simplify matters, so this is a solvable problem.
Another potential area for improvement comes from currently using a single threaded architecture on the Node.js side. Because of this, only a single prediction currently occurs at a time so latency sometimes includes some amount of queueing time. This can potentially be worked around by using Node worker threads for parallel execution that may be considered in future versions of this implementation. In our particular case, however, prediction is very fast even as it stands, so we do not feel the need to explore this right now.
Summary
The availability of TensorFlow.js gave us an easy option to deploy our model to serve production use cases when other options were not quite suitable or available to us. While our unique requirements resulted in using non-standard architecture (the mixture of the JVM and Node.js), TensorFlow.js can be used to an even greater effect in a homogeneous Node.js serving stack resulting in a very clean and performant architecture. With our open source performance quality model, a full stack JS engineer can personalize performance and improve their user engagement and we look forward to seeing how others use our open sourced model to do just that on their own websites.
Acknowledgements
This success would not be possible without the tremendous work by Prasanna Vijayanathan and Niranjan Sharma. A huge thank you to Ritesh Maheshwari and Rahul Kumar for their support and encouragement. Special thanks to Ping Yu (Google) and Jason Mayes (Google) for their continued support and feedback.
Personalize cross-channel customer experiences with Amazon SageMaker, Amazon Personalize, and Twilio Segment
Today, customers interact with brands over an increasingly large digital and offline footprint, generating a wealth of interaction data known as behavioral data. As a result, marketers and customer experience teams must work with multiple overlapping tools to engage and target those customers across touchpoints. This increases complexity, creates multiple views of each customer, and makes it more challenging to provide an individual experience with relevant content, messaging, and product suggestions to each customer. In response, marketing teams use customer data platforms (CDPs) and cross-channel campaign management tools (CCCMs) to simplify the process of consolidating multiple views of their customers. These technologies provide non-technical users with an accelerated path to enable cross-channel targeting, engagement, and personalization, while reducing marketing teams’ dependency on technical teams and specialist skills to engage with customers.
Despite this, marketers find themselves with blind spots in customer activity when these technologies aren’t integrated with systems from other parts of the business. This is particularly true with non-digital channels, for example, in-store transactions or customer feedback from customer support. Marketing teams and their customer experience counterparts also struggle to integrate predictive capabilities developed by data scientists into their cross-channel campaigns or customer touchpoints. As a result, customers receive messaging and recommendations that aren’t relevant or are inconsistent with their expectations.
This post outlines how cross-functional teams can work together to address these challenges using an omnichannel personalization use case. We use a fictional retail scenario to illustrate how those teams interlock to provide a personalized experience at various points along the customer journey. We use Twilio Segment in our scenario, a customer data platform built on AWS. There are more than 12 CDPs in the market to choose from, many of which are also AWS partners, but we use Segment in this post because they provide a self-serve free tier that allows you to explore and experiment. We explain how to combine the output from Segment with in-store sales data, product metadata, and inventory information. Building on this, we explain how to integrate Segment with Amazon Personalize to power real-time recommendations. We also describe how we create scores for churn and repeat-purchase propensity using Amazon SageMaker. Lastly, we explore how to target new and existing customers in three ways:
- With banners on third-party websites, also known as display advertising, using a propensity-to-buy score to attract similar customers.
- On web and mobile channels presented with personalized recommendations powered by Amazon Personalize, which uses machine learning (ML) algorithms to create content recommendations.
- With personalized messaging using Amazon Pinpoint, an outbound and inbound marketing communications service. These messages target disengaged customers and those showing a high propensity to churn.
Solution overview
Imagine you are a product owner leading the charge on cross-channel customer experience for a retail company. The company has a diverse set of online and offline channels, but sees digital channels as its primary opportunity for growth. They want to grow the size and value of their customer base with the following methods:
- Attract new, highly qualified customers who are more likely to convert
- Increase the average order value of all their customers
- Re-attract disengaged customers to return and hopefully make repeat purchases
To ensure those customers receive a consistent experience across channels, you as a product owner need to work with teams such as digital marketing, front-end development, mobile development, campaign delivery, and creative agencies. To ensure customers receive relevant recommendations, you also need to work with data engineering and data science teams. Each of these teams are responsible for interacting with or developing features within the architecture illustrated in the following diagram.
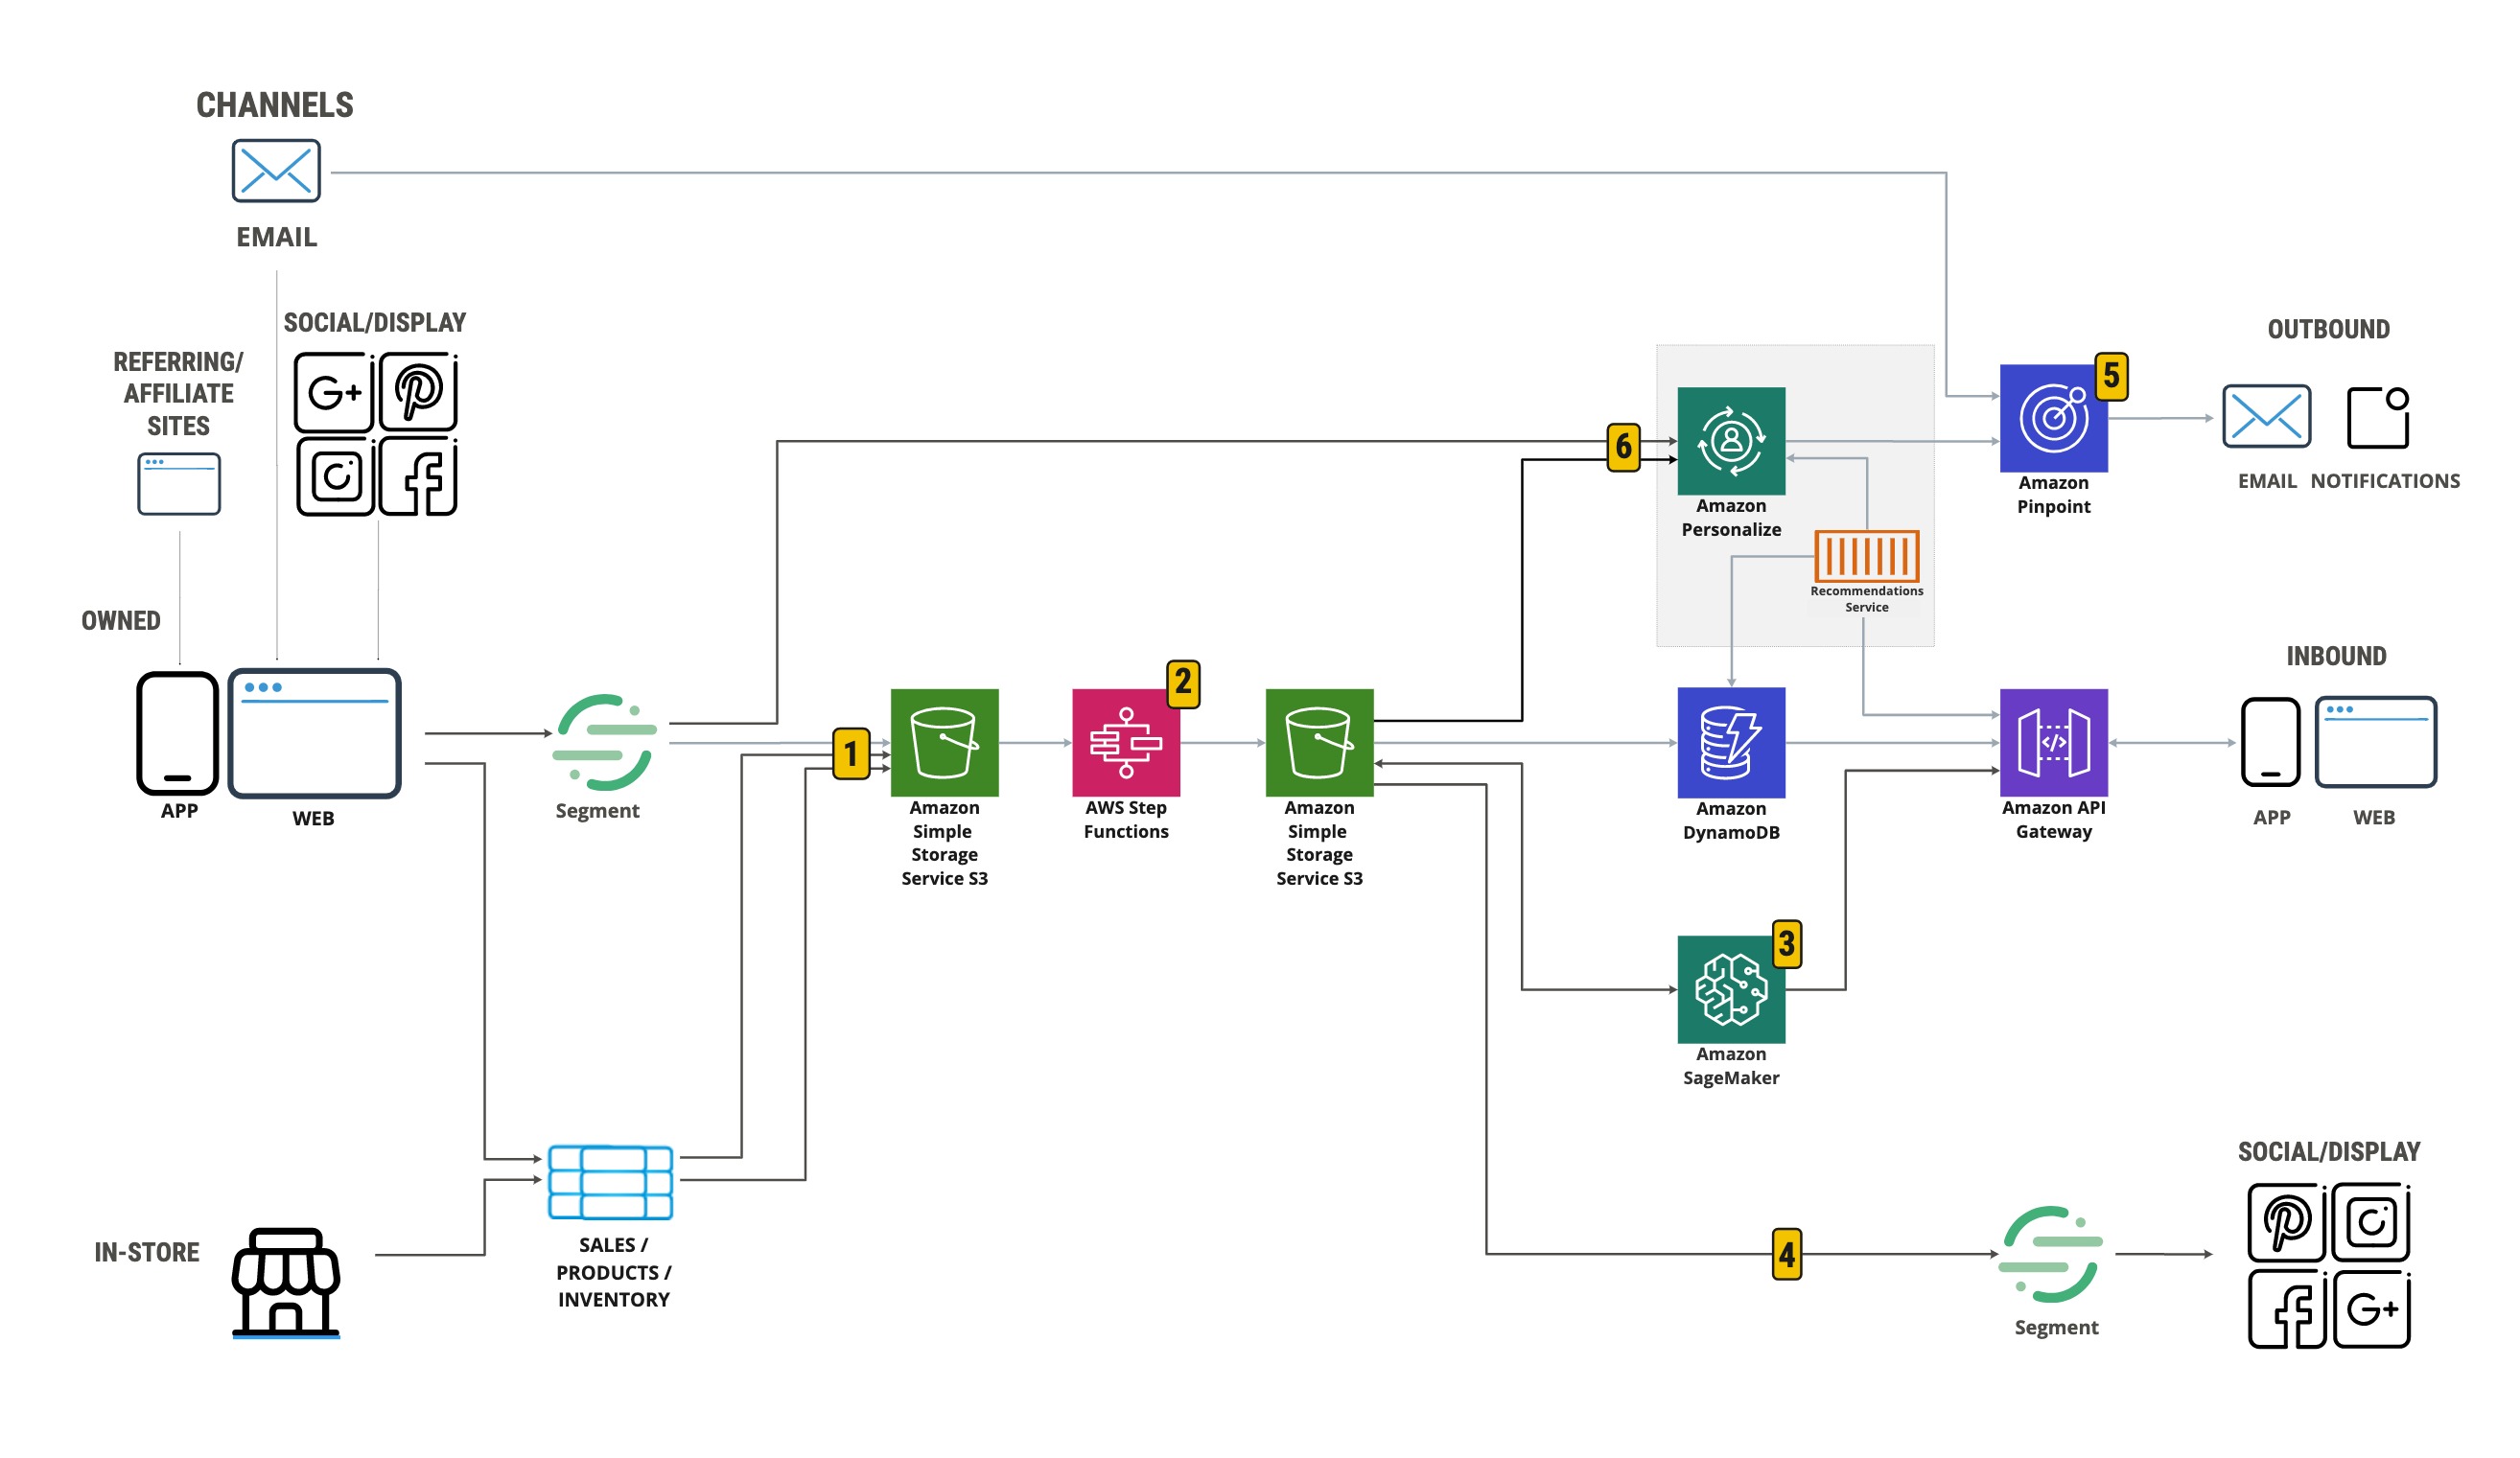
The solution workflow contains the following high-level steps:
- Collect data from multiple sources to store in Amazon Simple Storage Service (Amazon S3).
- Use AWS Step Functions to orchestrate data onboarding and feature engineering.
- Build segments and predictions using SageMaker.
- Use propensity scores for display targeting.
- Send personalized messaging using Amazon Pinpoint.
- Integrate real-time personalized suggestions using Amazon Personalize.
In the following sections, we walk through each step, explain the activities of each team at a high level, provide references to related resources, and share hands-on labs that provide more detailed guidance.
Collect data from multiple sources
Digital marketing, front-end, and mobile development teams can configure Segment to capture and integrate web and mobile analytics, digital media performance, and online sales sources using Segment Connections. Segment Personas allows digital marketing teams to resolve the identity of users by stitching together interactions across these sources into a single user profile with one persistent identifier. These profiles, along with calculated metrics called Computed Traits and raw events, can be exported to Amazon S3. The following screenshot shows how identity rules are set up in Segment Personas.

In parallel, engineering teams can use AWS Data Migration Service (AWS DMS) to replicate in-store sales, product metadata, and inventory data sources from databases such as Microsoft SQL or Oracle and store the output in Amazon S3.
Data onboarding and feature engineering
After data is collected and stored in the landing zone on Amazon S3, data engineers can use components from the serverless data lake framework (SDLF) to accelerate data onboarding and build out the foundational structure of a data lake. With SDLF, engineers can automate the preparation of user-item data used to train Amazon Personalize or create a single view of customer behavior by joining online and offline behavioral data and sales data, using attributes such as customer ID or email address as a common identifier.
Step Functions is the key orchestrator driving these transformation jobs within SDLF. You can use Step Functions to build and orchestrate both scheduled and event-driven data workflows. The engineering team can orchestrate the tasks of other AWS services within a data pipeline. The outputs from this process are stored in a trusted zone on Amazon S3 to use for ML development. For more information on implementing the serverless data lake framework, see AWS serverless data analytics pipeline reference architecture.
Build segments and predictions
The process of building segments and predictions can be broken down into three steps: access the environment, build propensity models, and create output files.
Access the environment
After the engineering team has prepared and transformed the ML development data, the data science team can build propensity models using SageMaker. First, they build, train, and test an initial set of ML models. This allows them to see early results, decide which direction to go next, and reproduce experiments.
The data science team needs an active Amazon SageMaker Studio instance, an integrated development environment (IDE) for rapid ML experimentation. It unifies all the key features of SageMaker and offers an environment to manage the end-to-end ML pipelines. It removes complexity and reduces the time it takes to build ML models and deploy them into production. Developers can use SageMaker Studio notebooks, which are one-click Jupyter notebooks that you can quickly spin up to enable the entire ML workflow from data preparation to model deployment. For more information on SageMaker for ML, see Amazon SageMaker for Data Science.
Build the propensity models
To estimate churn and repeat-purchase propensity, the customer experience and data science teams should agree on the known driving factors for either outcome.
The data science team validates these known factors while also discovering unknown factors through the modeling process. An example of a factor driving churn can be the number of returns in the last 3 months. An example of a factor driving repurchases can be the number of items saved on the website or mobile app.
For our use case, we assume that the digital marketing team wants to create a target audience using lookalike modeling to find customers most likely to repurchase in the next month. We also assume that the campaign team wants to send an email offer to customers who will likely end their subscription in the next 3 months to encourage them to renew their subscription.
The data science team can start by analyzing the data (features) and summarizing the main characteristics of the dataset to understand the key data behaviors. They can then shuffle and split the data into training and test and upload these datasets into the trusted zone. You can use an algorithm such as the XGBoost classifier to train the model and automatically provide the feature selection, which is the best set of candidates to determine the propensity scores (or predicted values).
You can then tune the model by optimizing the algorithm metrics (such as hyperparameters) based on the ranges provided within the XGBoost framework. Test data is used to evaluate the model’s performance and estimate how well it generalizes to new data. For more information on evaluation metrics, see Tune an XGBoost Model.
Lastly, the propensity scores are calculated for each customer and stored in the trusted S3 zone to be accessed, reviewed, and validated by the marketing and campaign teams. This process also provides a prioritized evaluation of feature importance, which helps to explain how the scores were produced.
Create the output files
After the data science team has completed the model training and tuning, they work with the engineering team to deploy the best model to production. We can use SageMaker batch transform to run predictions as new data is collected and generate scores for each customer. The engineering team can orchestrate and automate the ML workflow using Amazon SageMaker Pipelines, a purpose-built continuous integration and continuous delivery (CI/CD) service for ML, which offers an environment to manage the end-to-end ML workflow. It saves time and reduces errors typically caused by manual orchestration.
The output of the ML workflow is imported by Amazon Pinpoint for sending personalized messaging and exported to Segment to use when targeting on display channels. The following illustration provides a visual overview of the ML workflow.

The following screenshot shows an example output file.

Use propensity scores for display targeting
The engineering and digital marketing teams can create the reverse data flow back to Segment to increase reach. This uses a combination of AWS Lambda and Amazon S3. Every time a new output file is generated by the ML workflow and saved in the trusted S3 bucket, a Lambda function is invoked that triggers an export to Segment. Digital marketing can then use regularly updated propensity scores as customer attributes to build and export audiences to Segment destinations (see the following screenshot). For more information on the file structure of the Segment export, see Amazon S3 from Lambda.

When the data is available in Segment, digital marketing can see the propensity scores developed in SageMaker as attributes when they create customer segments. They can generate lookalike audiences to target them with digital advertising. To create a feedback loop, digital marketing must ensure that impressions, clicks, and campaigns are being ingested back into Segment to optimize performance.
Send personalized outbound messaging
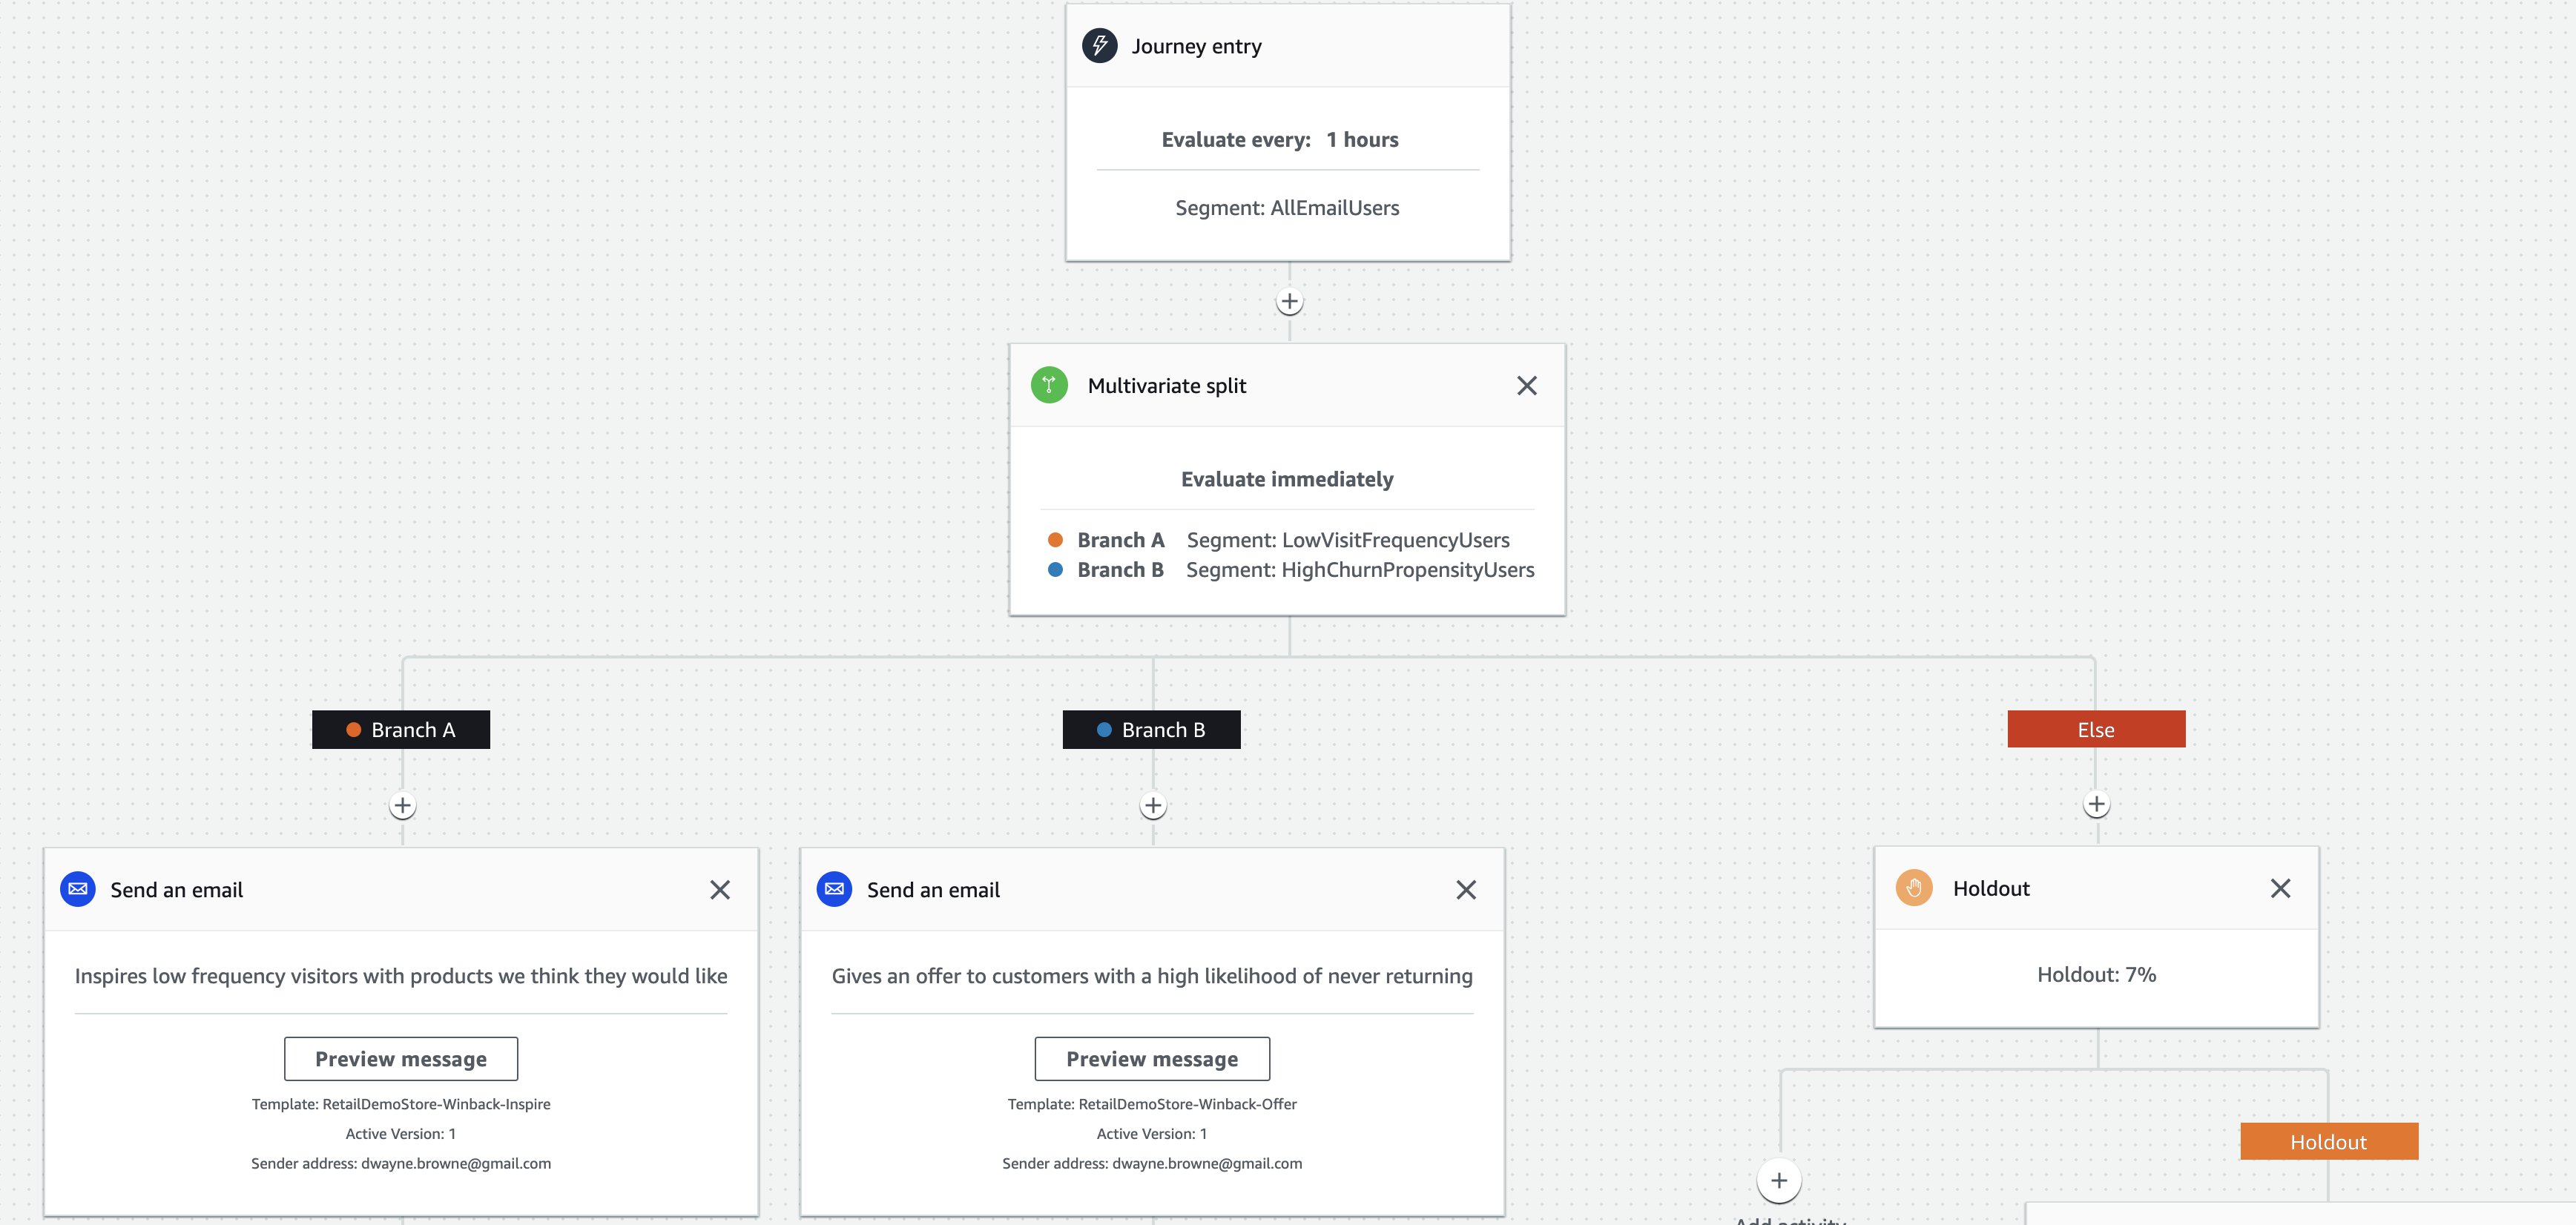
The campaign delivery team can implement and deploy AI-driven win-back campaigns to re-engage customers at risk of churn. These campaigns use the list of customer contacts generated in SageMaker as segments while integrating with Amazon Personalize to present personalized product recommendations. See the following diagram.

The digital marketing team can experiment using Amazon Pinpoint journeys to split win-back segments into subgroups and reserve a percentage of users as a control group that isn’t exposed to the campaign. This allows them to measure the campaign’s impact and creates a feedback loop.
Integrate real-time recommendations
To personalize inbound channels, the digital marketing and engineering teams work together to integrate and configure Amazon Personalize to provide product recommendations at different points in the customer’s journey. For example, they can deploy a similar item recommender on product detail pages to suggest complementary items (see the following diagram). Additionally, they can deploy a content-based filtering recommender in the checkout journey to remind customers of products they would typically buy before completing their order.

First, the engineering team needs to create RESTful microservices that respond to web, mobile, and other channel application requests with product recommendations. These microservices call Amazon Personalize to get recommendations, resolve product IDs into more meaningful information like name and price, check inventory stock levels, and determine which Amazon Personalize campaign endpoint to query based on the user’s current page or screen.
The front-end and mobile development teams need to add tracking events for specific customer actions to their applications. They can then use Segment to send those events directly to Amazon Personalize in real time. These tracking events are the same as the user-item data we extracted earlier. They allow Amazon Personalize solutions to refine recommendations based on live customer interactions. It’s essential to capture impressions, product views, cart additions, and purchases because these events create a feedback loop for the recommenders. Lambda is an intermediary, collecting user events from Segment and sending them to Amazon Personalize. Lambda also facilitates the reverse data exchange, relaying updated recommendations for the user back to Segment. For more information on configuring real-time recommendations with Segment and Amazon Personalize, see the Segment Real-time data and Amazon Personalize Workshop.
Conclusion
This post described how to deliver an omnichannel customer experience using a combination of Segment customer data platform and AWS services such as Amazon SageMaker, Amazon Personalize, and Amazon Pinpoint. We explored the role cross-functional teams play at each stage in the customer journey and in the data value chain. The architecture and approach discussed are focused on a retail environment, but you can apply it to other verticals such as financial services or media and entertainment. If you’re interested in trying out some of what we discussed, check out the Retail Demo Store, where you can find hands-on workshops that include Segment and other AWS partners.
Additional references
For additional information, see the following resources:
- Omnichannel personalization with Segment
- Omnichannel personalization with Amazon Personalize
- Build, tune, and deploy an end-to-end churn prediction model using Amazon SageMaker Pipelines
- Automate feature engineering pipelines with Amazon SageMaker
- Monitor model quality
About Segment
Segment is an AWS Advanced Technology Partner and holder of the following AWS Independent Software Vendor (ISV) competencies: Data & Analytics, Digital Customer Experience, Retail, and Machine Learning. Brands such as Atlassian and Digital Ocean use real-time analytics solutions powered by Segment.
About the Authors
 Dwayne Browne is a Principal Analytics Platform Specialist at AWS based in London. He is part of the Data-Driven Everything (D2E) customer program, where he helps customers become more data-driven and customer experience focused. He has a background in digital analytics, personalization, and marketing automation. In his spare time, Dwayne enjoys indoor climbing and exploring nature.
 Hara Gavriliadi is a Senior Data Analytics Strategist at AWS Professional Services based in London. She helps customers transform their business using data, analytics, and machine learning. She specializes in customer analytics and data strategy. Hara loves countryside walks and enjoys discovering local bookstores and yoga studios in her free time.
 Kenny Rajan is a Senior Partner Solution Architect. Kenny helps customers get the most from AWS and its partners by demonstrating how AWS partners and AWS services work better together. He’s interested in machine learning, data, ERP implementation, and voice-based solutions on the cloud. Outside of work, Kenny enjoys reading books and helping with charity activities.
Latest ‘I AM AI’ Video Features Four-Legged Robots, Smart Cell Analysis, Tumor-Tracking Tech and More
“I am a visionary,” says an AI, kicking off the latest installment of NVIDIA’s I AM AI video series.
Launched in 2017, I AM AI has become the iconic opening for GTC keynote addresses by NVIDIA founder and CEO Jensen Huang. Each video, with its AI-created narration and soundtrack, documents the newest advances in artificial intelligence and their impact on the world.
The latest, which debuted at GTC last week, showcases how NVIDIA technologies enable AI to take on complex tasks in the world’s most challenging environments, from farms and traffic intersections to museums and research labs.
Here’s a sampling of the groundbreaking AI innovations featured in the video.
Accuray Radiotherapy System Treats Lung Tumors
Lung tumors can move as much as two inches with every breath — making it difficult to protect healthy lung tissue while targeting the tumor for treatment.
Bay Area-based radiation therapy company Accuray offers Radixact, an AI-powered system that uses motion-tracking capabilities to follow a tumor’s movement and deliver treatment with sub-millimeter accuracy.
The system’s respiratory motion synchronization feature, which works in real time, matches treatment to the natural rhythm of patients’ breathing cycles, allowing them to breathe as normal during the process.
Radixact, which can take precise imagery of the tumor from any angle, is powered by NVIDIA RTX GPUs.
ANYmal Robots Learn to Walk on Their Own
The Robotic Systems Lab, at ETH Zurich, in collaboration with Swiss-Mile, is embracing the future of robotic mobility.
The Swiss research lab fitted the four-legged robot ANYmal with wheels so that it can learn to stand, walk and drive — all on its own and in a matter of minutes.
Built on the NVIDIA Jetson edge AI platform and trained with Isaac Gym, the robot’s combination of legs and wheels enables it to carry tools and overcome obstacles like steps or stairs. Its AI-powered cameras and processing of laser scanning data allow it to perceive and create maps of its environment — indoors or outdoors.
The robot can help with delivery services, search-and-rescue missions, industrial inspection and more.
Sanctuary AI Robots Give a Helping Hand
Canadian startup Sanctuary AI aims “to create the world’s first human-like intelligence in general-purpose robots to help people work more safely, efficiently and sustainably.”
Built using NVIDIA Isaac Sim, Sanctuary AI’s general-purpose robots are highly dexterous — that is, great with their hands. They use their human-like fingers for a myriad of complex, precision tasks like opening Ziploc bags, handling pills or using almost any hand tool designed for a person.
The robots’ built-in cognitive architecture enables them to observe, assess and act on any task humans might need help with. Sanctuary AI aims to one day see its technology help with construction on the moon.
Sanctuary AI is a member of NVIDIA Inception, a program designed to nurture cutting-edge startups. Every member receives a custom set of ongoing benefits, such as NVIDIA Deep Learning Institute credits, opportunities to connect with investors, awareness support and technology assistance.
Scopio Accelerates Blood Cell Analysis
Another NVIDIA Inception member, Scopio, uses NVIDIA RTX GPUs to perform real-time, super-resolution analysis of blood, searching for hidden threats in every cell.
The company is transforming cell morphology with its microscopy scanning devices and Full-Field Peripheral Blood Smear application, which for the first time gives hematology labs and clinicians access to full-field scans of blood, with all cells imaged at 100x resolution.
The application runs Scopio’s machine learning algorithms to detect, classify and quantify blood cells — and help flag abnormalities, which are automatically documented in a digital report. This enhances workflow efficiency for labs and clinicians by more than 60 percent.
To learn more about the latest AI innovations, watch NVIDIA founder and CEO Jensen Huang’s GTC keynote address in replay:
The post Latest ‘I AM AI’ Video Features Four-Legged Robots, Smart Cell Analysis, Tumor-Tracking Tech and More appeared first on NVIDIA Blog.