Welcome to Research Focus, a new series of blog posts that highlights notable publications, events, code/datasets, new hires and other milestones from across the research community at Microsoft.
Microsoft is a proud platinum sponsor of the 36th annual conference on Neural Information Processing Systems, running from November 28 to December 9. More than 150 of our researchers are involved in presentations, poster sessions, accepted papers, and workshops at this prestigious conference.
We are thrilled to have had more than 100 papers accepted at NeurIPS 2022. Our full roster includes cutting edge research ranging from differential privacy and reinforcement learning to extreme compression, motion capture and large language models.
This hybrid conference includes an in-person component at the New Orleans Convention Center during the first week, and a virtual component the second week. Check out our list of sessions and plan your schedule.
If you will be attending in person, we hope you will stop by our booth (#202) to chat with our experts, see demos of our latest research and find out about career opportunities with Microsoft.
Spotlight: On-Demand EVENT
Microsoft Research Summit 2022
On-Demand Watch now to learn about some of the most pressing questions facing our research community and listen in on conversations with 120+ researchers around how to ensure new technologies have the broadest possible benefit for humanity.
Air pollution kills over 7 million people globally every year. In U.S. cities, pollution sources are more likely to affect communities of color – but the most impacted communities rarely have the data they need to understand and address this invisible hazard.
Through Project Eclipse, a team from Microsoft Research has worked with the Chicago Department of Public Health and JCDecaux – an advertising agency and the world’s largest provider of outdoor street furniture – to deploy low-cost air quality sensors across the city’s bus shelters. In a new paper published this week in the American Journal of Public Health, the team showed how the citywide network of sensors enabled them to capture and visualize differences in exposures over time and space. The work was led by Precious Esie, a PhD student in epidemiology at Columbia’s Mailman School of Public Health, during her summer internship at Microsoft Research.
Over the month of July 2021, the research team found, pollution disproportionately affected Hispanic and Latinx residents on the West side of the city. But 4th of July spikes disproportionately affected the South side—including places where asthma rates are highest. In late July, wildfire smoke increased exposures across the city as a whole. This work shows how next-generation environmental sensing can help public health agencies target interventions when and where they are most needed.
Microsoft Research contributes to industry supply chain standards
Kiran Karunakaran, Principal Product Manager, Azure Security Engineering
Supply Chain Integrity, Transparency and Trust (SCITT) is an industry-standards initiative for managing the compliance of goods and services across end-to-end supply chains, allowing organizations to build, deploy and consume interoperable and automated solutions to manage end-to-end supply chain compliance. SCITT was initiated as a response to United States Executive Order on Improving the Nation’s Cybersecurity (EO14028), and was formally adopted into the Internet Engineering Task Force (IETF) in March 2022. Over the last eight months, SCITT has been one of the fastest growing initiatives within IETF and became a formal working group in October 2022.
Microsoft Research is actively contributing to IETF SCITT Architecture and SCITT Receipt Format Internet Drafts and will be providing and collaborating on several SCITT-related open-source software offerings. This includes the donation of a SCITT Emulator that allows SCITT implementers to experiment with SCITT APIs and message formats. Microsoft is also open sourcing our SCITT implementation prototype that runs on Confidential Consortium Framework (microsoft.com), providing visibility into one of the many possible implementations of SCITT.
A SCITT IETF Working Group session was held at IETF115 on Nov 10th. To learn more about the community efforts, blogs, and implementations around SCITT, please visit SCITT.io.
The research introduced A-MAC, a receiver-initiated link layer for low-power wireless networks that supported several services under a unified architecture, and more efficiently and scalably than prior approaches.
Co-authors on the paper include Prabal Dutta (University of Michigan), Stephen Dawson-Haggerty (University of California, Berkeley), Yin Chen (Johns Hopkins University), and Andreas Terzis (Johns Hopkins University).
The Test of Time award is given by ACM SenSys in recognition of papers that are at least 10 years old and have had long lasting impact on networked embedded sensing system science and engineering.
When legendary computer scientist Jim Gray accepted the Turing Award in 1999, he laid out a dozen long-range information technology research goals. One of those goals called for the creation of trouble-free server systems or, in Gray’s words, to “build a system used by millions of people each day and yet administered and managed by a single part-time person.”
Gray envisioned a self-organizing “server in the sky” that would store massive amounts of data, and refresh or download data as needed. Today, with the emergence and rapid advancement of artificial intelligence (AI), machine learning (ML) and cloud computing, and Microsoft’s development of Cloud Intelligence/AIOps, we are closer than we have ever been to realizing that vision—and moving beyond it.
Over the past fifteen years, the most significant paradigm shift in the computing industry has been the migration to cloud computing, which has created unprecedented digital transformation opportunities and benefits for business, society, and human life.
The implication is profound: cloud computing platforms have become part of the world’s basic infrastructure. As a result, the non-functional properties of cloud computing platforms, including availability, reliability, performance, efficiency, security, and sustainability, have become immensely important. Yet the distributed nature, massive scale, and high complexity of cloud computing platforms—ranging from storage to networking, computing and beyond—present huge challenges to building and operating such systems.
Cloud Intelligence/AIOps (“AIOps” for brevity) aims to innovate AI/ML technologies to help design, build, and operate complex cloud platforms and services at scale—effectively and efficiently.
AIOps has three pillars, each with its own goal:
AI for Systems to make intelligence a built-in capability to achieve high quality, high efficiency, self-control, and self-adaptation with less human intervention.
AI for Customers to leverage AI/ML to create unparalleled user experiences and achieve exceptional user satisfaction using cloud services.
AI for DevOps to infuse AI/ML into the entire software development lifecycle to achieve high productivity.
Where did the research on AIOps begin?
Gartner, a leading industry analyst firm, first coined the term AIOps (Artificial Intelligence for IT Operations) in 2017. According to Gartner, AIOps is the application of machine learning and data science to IT operation problems. While Gartner’s AIOps concept focuses only on DevOps, Microsoft’s Cloud Intelligence/AIOps research has a much broader scope, including AI for Systems and AI for Customers.
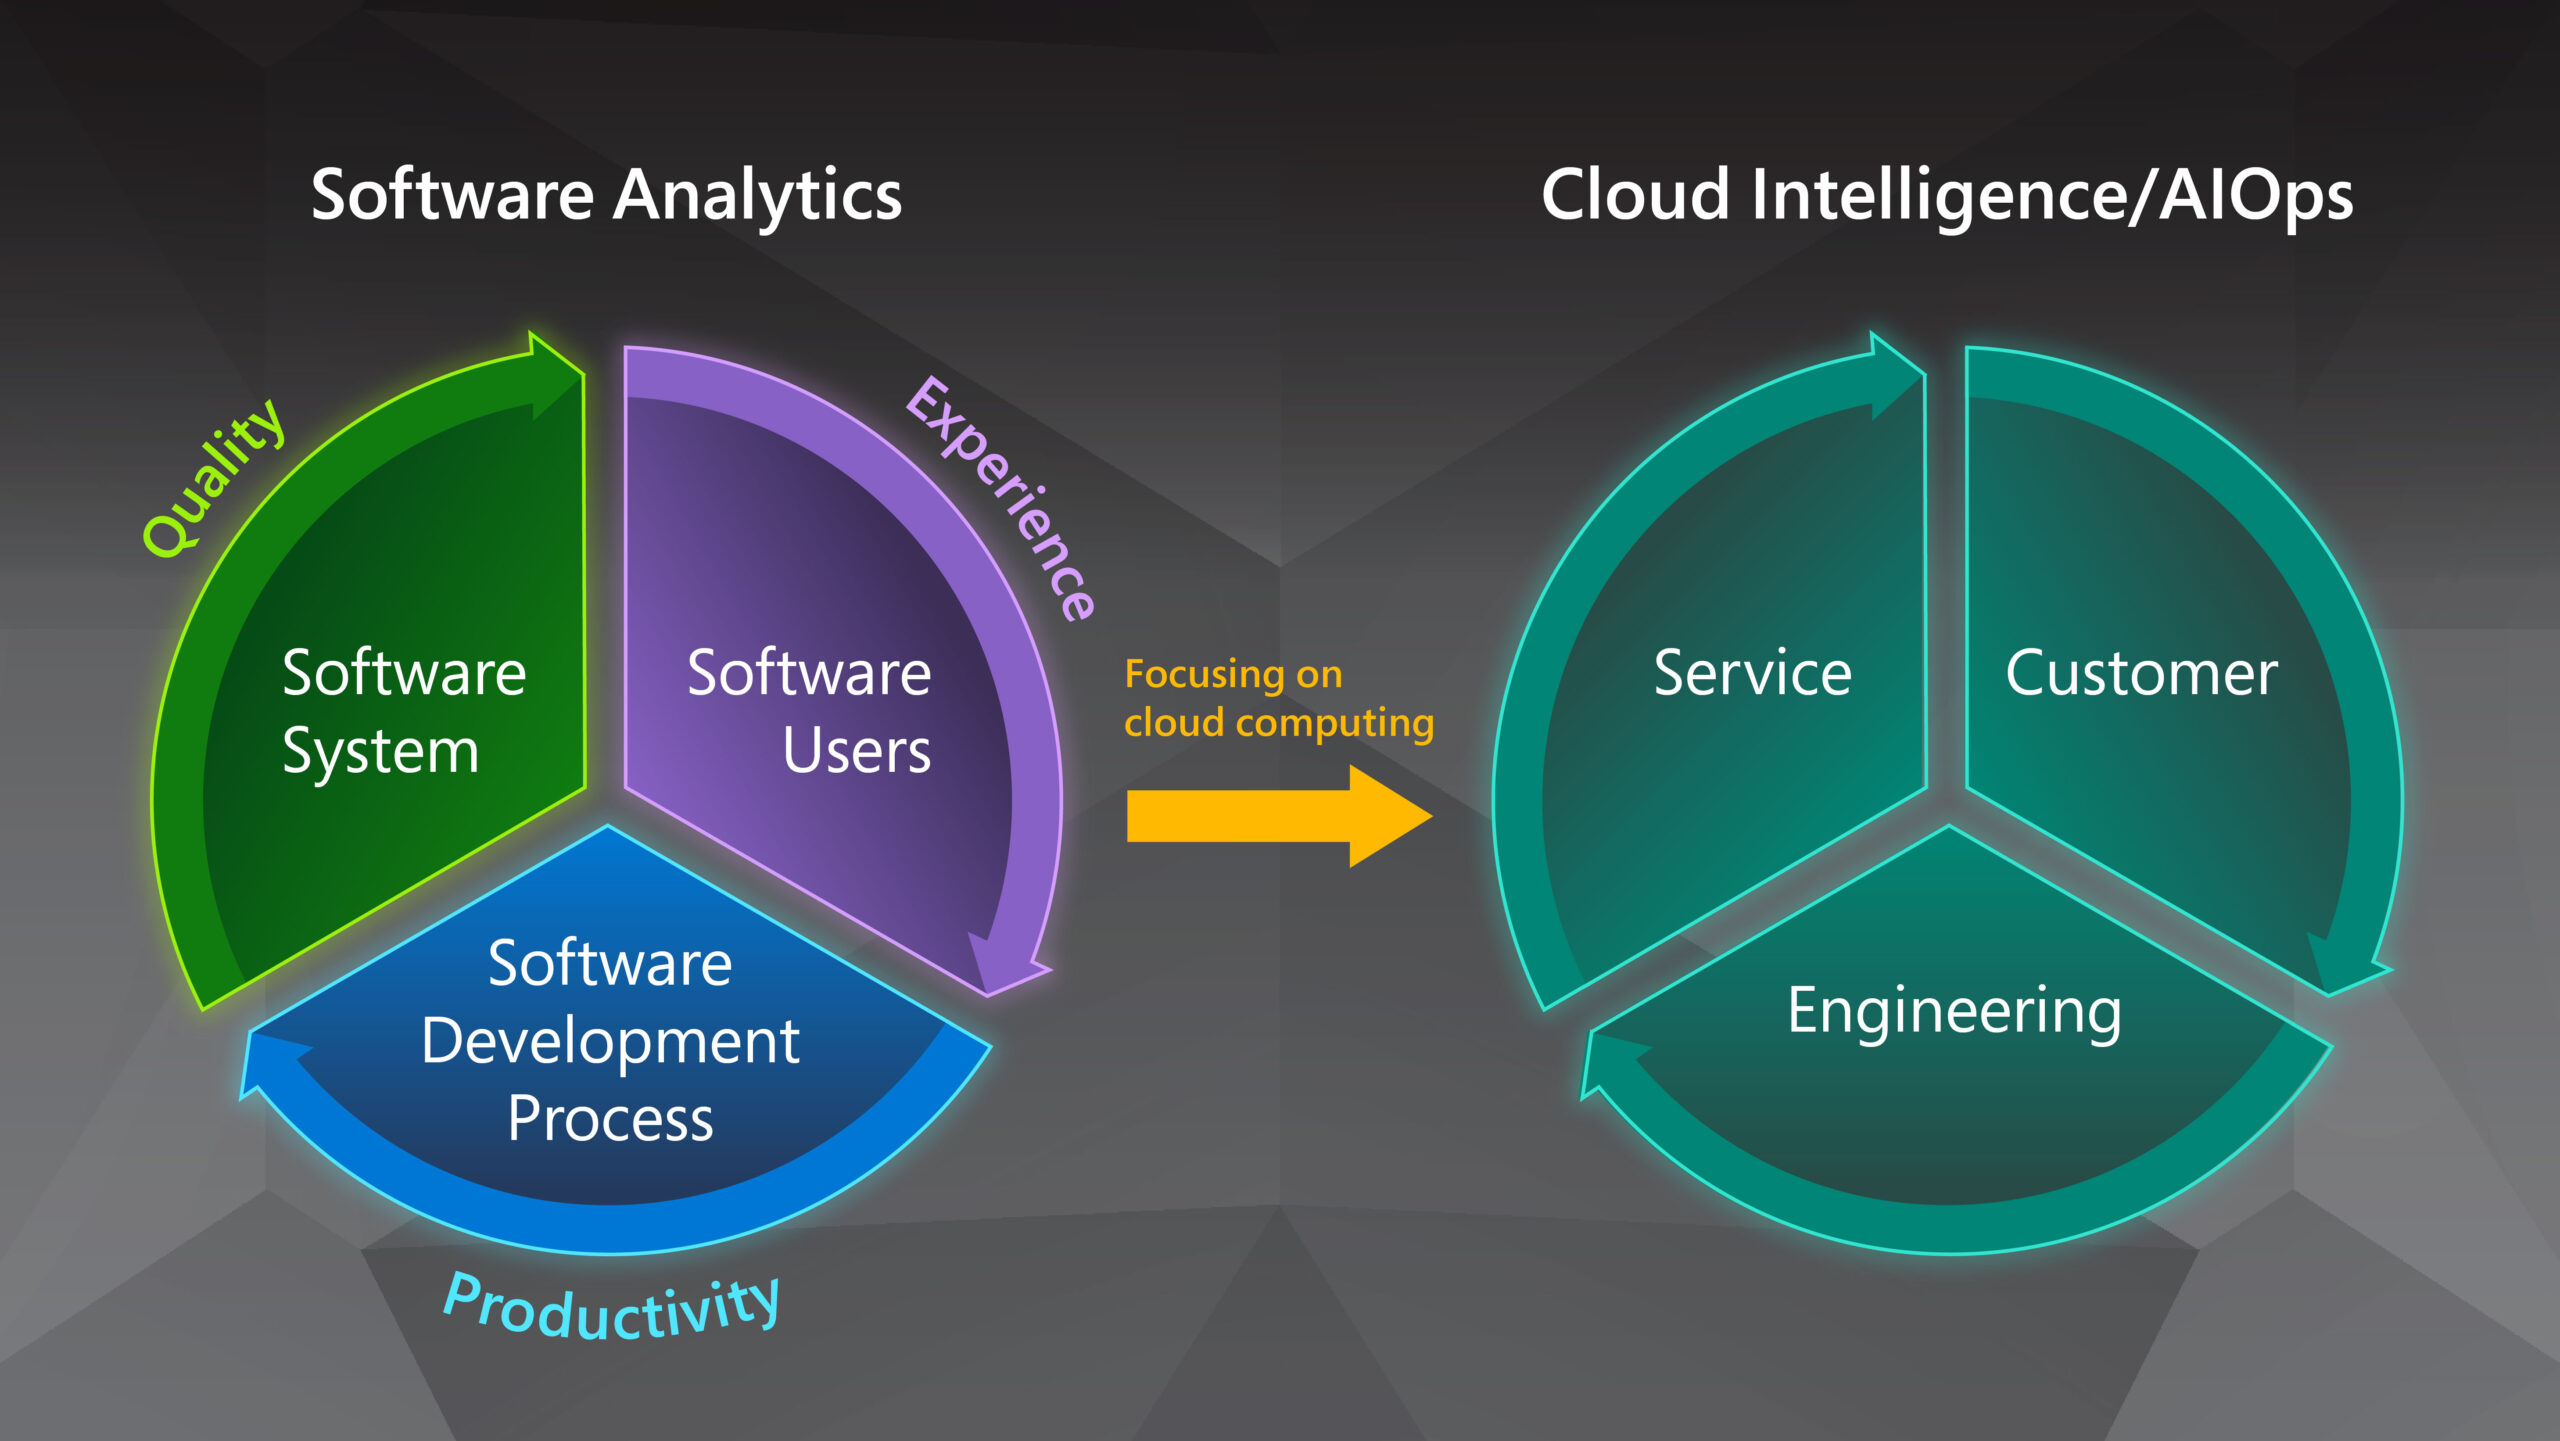
The broader scope of Microsoft’s Cloud Intelligence/AIOps stems from the Software Analytics research we proposed in 2009, which seeks to enable software practitioners to explore and analyze data to obtain insightful and actionable information for data-driven tasks related to software and services. We started to focus our Software Analytics research on cloud computing in 2014 and named this new topic Cloud Intelligence (Figure 1). In retrospect, Software Analytics is about the digital transformation of the software industry itself, such as empowering practitioners to use data-driven approaches and technologies to develop software, operate software systems, and engage with customers.
Figure 1: From Software Analytics to Cloud Intelligence/AIOps
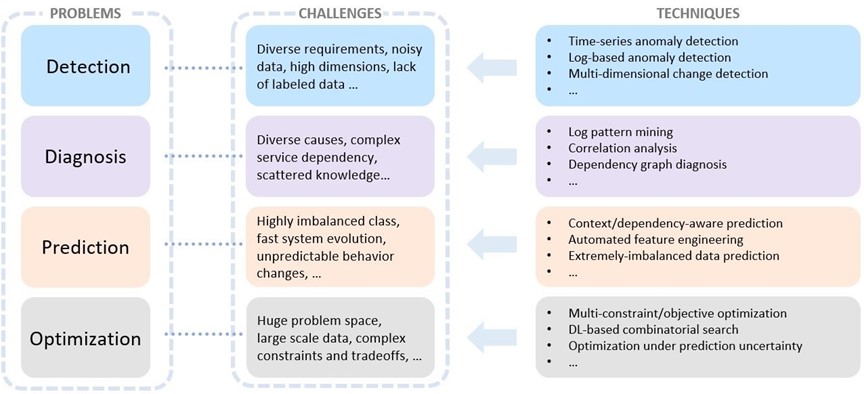
What is the AIOps problem space?
There are many scenarios around each of the three pillars of AIOps. Some example scenarios include predictive capacity forecasting for efficient and sustainable services, monitoring service health status, and detecting health issues in a timely manner in AI for Systems; ensuring code quality and preventing defective build deployed into production in AI for DevOps; and providing effective customer support in AI for Customers. Across all these scenarios, there are four major problem categories that, taken together, constitute the AIOps problem space: detection, diagnosis, prediction, and optimization (Figure 2). Specifically, detection aims to identify unexpected system behaviors (or anomalies) in a timely manner. Given the symptom and associated artifacts, the goal of diagnosis is to localize the cause of service issues and find the root cause. Prediction attempts to forecast system behaviors, customer workload patterns, or DevOps activities, and so on. Lastly, optimization tries to identify the optimal strategies or decisions required to achieve certain performance targets related to system quality, customer experience and DevOps productivity.
Figure 2: Problems and challenges of AIOps
Each problem has its own challenges. Take detection as an example. To ensure service health at runtime, it is important for engineers to continuously monitor various metrics and detect anomalies in a timely manner. In the development process, to ensure the quality of the continuous integration/continuous delivery (CI/CD) practice, engineers need to create mechanisms to catch defective builds and prevent them from being deployed to other production sites.
Both scenarios require timely detection, and in both there are common challenges for conducting effective detection. For example, time series data and log data are the most common data forms. Yet they are often multi-dimensional, there may be noise in the data, and they often have different detection requirements—all of which can pose significant challenges to reliable detection.
Microsoft Research: Our AIOps vision
Microsoft is conducting continuous research in each of the AIOps problem categories. Our goal for this research is to empower cloud systems to be more autonomous, more proactive, more manageable, and more comprehensive across the entire cloud stack.
AIOps strives to make cloud systems more autonomous, to minimize human operations and rule-based decisions, which significantly helps reduce user impact caused by system issues, make better operation decisions, and reduce maintenance cost. This is achieved by automating DevOps as much as possible, including build, deployment, monitoring, and diagnosis. For example, the purpose of safe deployment is to catch a defective build early to prevent it from rolling out to production and resulting in significant customer impact. It can be extremely labor intensive and time consuming for engineers, because anomalous behaviors have a variety of patterns that may change over time, and not all anomalous behaviors are caused by a new build, which may introduce false positives.
At Microsoft Research, we used transfer learning and active learning techniques to develop a safe deployment solution that overcomes these challenges. We’ve been running the solution in Microsoft Azure, and it has been highly effective at helping to catch defective builds – achieving more than 90% precision and near 100% recall in production over a period of 18 months.
Root cause analysis is another way that AIOps is reducing human operations in cloud systems. To shorten the mitigation time, engineers in cloud systems must quickly identify the root causes of emerging incidents. Owing to the complex structure of cloud systems, however, incidents often contain only partial information and can be triggered by many services and components simultaneously, which forces engineers to spend extra time diagnosing the root causes before any effective actions can be taken. By leveraging advanced contrast-mining algorithms, we have implemented autonomous incident-diagnosis systems, including HALO and Outage Scope, to reduce response time and increase accuracy in incident diagnosis tasks. These systems have been integrated in both Azure and Microsoft 365 (M365), which has considerably improved engineers’ ability to handle incidents in cloud systems.
Making cloud systems more proactive
AIOps makes cloud systems more proactive by introducing the concept of proactive design. In the design of a proactive system, an ML-based prediction component is added to the traditional system. The prediction system takes the input signals, does the necessary processing, and outputs the future status of the system. For example, what the capacity status of cluster A looks like next week, whether a disk will fail in a few days, or how many virtual machines (VMs) of a particular type will be needed in the next hour.
Knowing the future status makes it possible for the system to proactively avoid negative system impacts. For example, engineers can live migrate the services on an unhealthy computing node to a healthy one to reduce VM downtime, or pre-provision a certain number of VMs of a particular type for the next hour to reduce the latency of VM provisioning. In addition, AI/ML techniques can enable systems to learn over time which decision to make.
As an example of proactive design, we built a system called Narya, which proactively mitigated potential hardware failures to reduce service interruption and minimize customer impact. Narya, which is in production in Microsoft Azure, performs prediction on hardware failures and uses a bandit algorithm to decide which mitigation action to take.
Making cloud systems more manageable
AIOps makes cloud systems more manageable by introducing the notion of tiered autonomy. Each tier represents a set of operations that require a certain level of human expertise and intervention. These tiers range from the top tier of autonomous routine operations to the bottom tier, which requires deep human expertise to respond to rare and complex problems.
AI-driven automation often cannot handle such problems. By building AIOps solutions targeted at each tier, we can make cloud platforms easier to manage across the long tail of rare problems that inevitably arise in complex systems. Furthermore, the tiered design ensures that autonomous systems are developed from the start to evaluate certainty and risk, and that they have safe fallbacks when automation fails or the platform faces a previously unseen set of circumstances, such as the unforeseen increase in demand in 2020 due to the COVID-19 pandemic.
As an example of tiered autonomy, we built Safe On-Node Learning (SOL), a framework for safe learning and actuation on server nodes for the top tier. As another example, we are exploring how to predict the commands that operators should perform to mitigate incidents, while considering the associated certainty and risks of those commands when the top-tier automation fails to prevent the incidents.
Making AIOps more comprehensive across the cloud stack
AIOps can also be made more comprehensive by spanning the cloud stack—from the lowest infrastructure layers (such as network and storage) through the service layer (such as the scheduler and database) and on to the application layer. The benefit of applying AIOps more broadly would be a significant increase in the capability for holistic diagnosis, optimization, and management.
Microsoft services built on top of Azure are called first-party (1P) services. A 1P setting, which is often used to optimize system resources, is particularly suited to a more comprehensive approach to AIOps. This is because with the 1P setting a single entity has visibility into, and control over, the layers of the cloud stack, which enables engineers to amplify the AIOps impact. Examples of 1P services at Microsoft include large and established services such as Office 365, relatively new but sizeable services such as Teams, and up and coming services such as Windows 365 Cloud PC. These 1P services typically account for a significant share of resource usage, such as wide-area network (WAN) traffic and compute cores.
As an example of applying a more comprehensive AIOps approach to the 1P setting, the OneCOGS project, which is a joint effort of Azure, M365, and MSR, considers three broad opportunities for optimization:
Modeling users and their workload using signals cutting across the layers—such as using the user’s messaging activity versus fixed working hours to predict when a Cloud PC user will be active—thereby increasing accuracy to enable enabling appropriate allocation of system resources.
Jointly optimizing the application and the infrastructure to achieve cost savings and more.
Tame the complexity of data and configuration, thereby democratizing AIOps.
The AIOps methodologies, technologies and practices used for cloud computing platforms and 1P services are also applicable to third-party (3P) services on the cloud stack. To achieve this, further research and development are needed to make AIOps methods and techniques more general and/or easily adaptable. For example, when operating cloud services, detecting anomalies in multi-dimensional space and the subsequent fault localization are common monitoring and diagnosis problems.
Motivated by the real-world needs of Azure and M365, we proposed the technique AiDice, which automatically detects anomalies in multi-dimensional space, and HALO, a hierarchy-aware approach to locating fault-indicating combinations that uses telemetry data collected from cloud systems. In addition to deploying AiDice and HALO in Azure and M365, we’re also collaborating with product team partners to make AiDice and HALO AIOps services that can be leveraged by third-party services.
Conclusion
AIOps is a rapidly emerging technology trend and an interdisciplinary research direction across system, software engineering, and AI/ML communities. With years of research on Cloud Intelligence, Microsoft Research has built up rich technology assets in detection, diagnosis, prediction, and optimization. And through close collaboration with Azure and M365, we have deployed some of our technologies in production, which has created significant improvements in the reliability, performance, and efficiency of Azure and M365 while increasing the productivity of developers working on these products. In addition, we are collaborating with colleagues in academia and industry to promote the AIOps research and practices. For example, with the joint efforts we have organized 3 editions of AIOps Workshop at premium academic conferences AAAI 2020, ICSE 2021, and MLSys2022.
Moving forward, we believe that as a new dimension of innovation, Cloud Intelligence/AIOps will play an increasingly important role in making cloud systems more autonomous, more proactive, more manageable, and more comprehensive across the entire cloud stack. Ultimately, Cloud Intelligence/AIOps will help us make our vision for the future of the cloud a reality.
Welcome to Research Focus, a new series of blog posts that highlights notable publications, events, code/datasets, new hires and other milestones from across the research community at Microsoft.
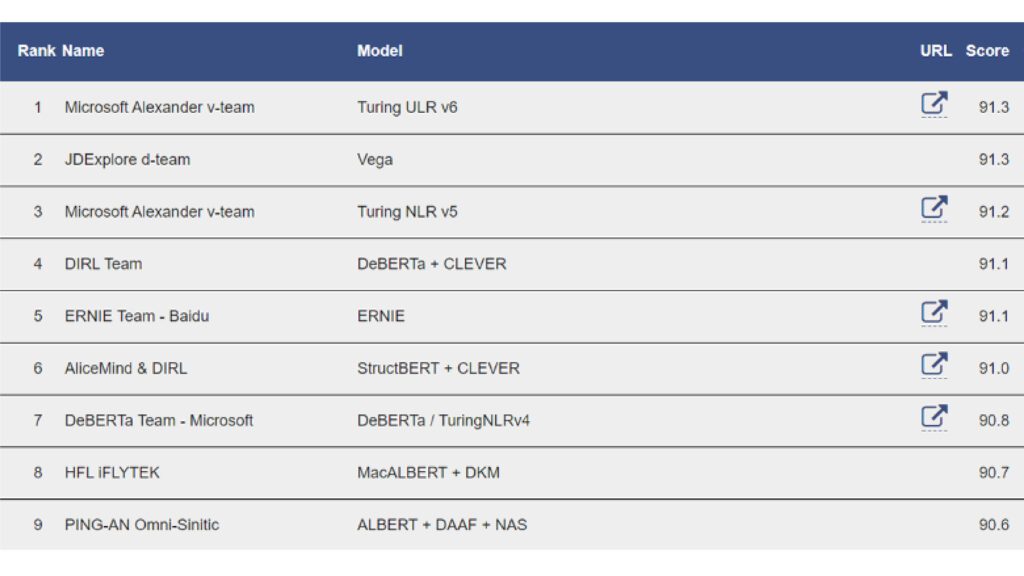
Microsoft Turing Universal Language Representation model, T-ULRv6, tops both XTREME and GLUE leaderboards with a single model
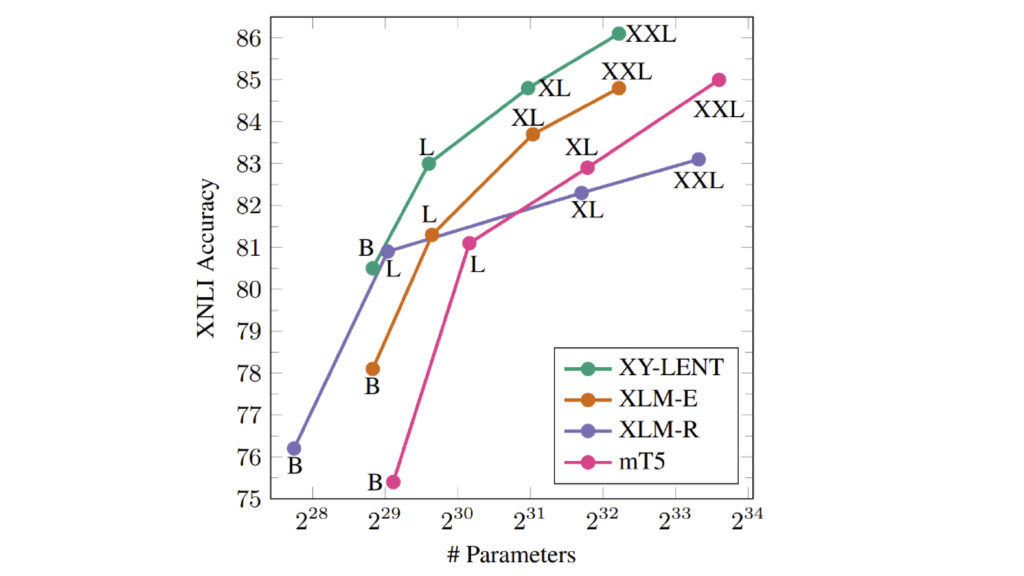
The most recent addition to Microsoft’s Turing Universal Language Representation Model family (T-ULRv6) has achieved the top position on both the Google XTREME and GLUE leaderboards, the first time that a single multilingual model has demonstrated state-of-the-art capabilities in both English and multilingual understanding tasks. The result of a collaboration between the Microsoft Turing team and Microsoft Research, the T-ULRv6 XXL model is based on “XY-LENT,” which leverages X-Y (non-English Centric) bitexts and incorporates the key innovations of XLM-E, the improved training data and vocabulary, and the advanced fine-tuning technique of XTune. Furthermore, to enable scaling to XXL sized models, T-ULRv6 leverages the memory optimization benefits afforded by ZeRO. To effectively utilize X-Y bitexts, the team adopted a novel sampling strategy and reconstructed the vocabulary using VoCap, which ensures an efficient distribution of data across languages and helps mitigate sparse sampling distributions from previous works. The XXL model variant outperforms both XLM-R XXL and mT5 XXL while being ~2x and ~3x smaller, respectively.
T-ULRv6 powers the language universalization of Microsoft Bing, enabling users to search and discover information across languages and domains. T-ULRv6 will soon enhance other Microsoft products with its multilingual capabilities.
XTREME, or Cross-lingual TRansfer Evaluation of Multilingual Encoders, is a benchmark covering 40 typologically diverse languages across 12 language families, with nine tasks that require reasoning about syntax or semantics.
GLUE – or the General Language Understanding Evaluation benchmark – is a collection of resources for training, evaluating, and analyzing natural language understanding systems.
Recent advances in machine learning architectures have induced a paradigm shift from task-specific models towards large general-purpose networks. For instance, in the past few years we have witnessed a revolution in the domains of natural language and computer vision with models such as GPT-3, BERT and DALL-E. The field of robotics is still mostly riddled with single-purpose systems architectures whose modules and connections, whether traditional or learning-based, require significant human design expertise. Inspired by these large pre-trained models, this work introduces a general-purpose robotics representation that can serve as a starting point for multiple tasks for a mobile agent, such as navigation, mapping and localization.
We present the Perception-Action Causal Transformer (PACT), a generative transformer-based architecture that aims to build representations directly from robot data in a self-supervised fashion. Through autoregressive prediction of states and actions over time, our model implicitly encodes dynamics and behaviors for a particular robot. This representation can then function as a single starting point to achieve distinct tasks through fine-tuning with minimal data.
Microsoft Research and NHS Scotland conduct world’s first clinical trials of Holoportation-based 3D telemedicine system to increase access to healthcare
Steven Lo, Spencer Fowers, Kwame Darko, Thiago Spina, Catriona Graham, Andrea Britto, Anna Rose, David Tittsworth, Aileen McIntyre, Chris O’Dowd, Roma Maguire, Wayne Chang, David Young, Amber Hoak, Robin Young, Mark Dunlop, Levi Ankrah, Martina Messow, Opoku Ampomah, Ben Cutler, Roma Armstrong, Ruchi Lalwani, Ruairidh Davison, Sophie Bagnall, Whitney Hudson, Mike Shepperd, Jonny Johnson, 3DTM (3D Telemedicine) Collaborative research group
The Covid pandemic has increased the usage of remote health consultations and underscored the need for a better system. Current 2D telemedicine engagements fail to replicate the fluency or authenticity of in-person consultations. Real-time 3D telemedicine has previously been proposed within a research setting only, with constraints on complexity, bandwidth and technology.
This research reports on an international collaboration on the participatory development and first validated clinical use of a novel, real-time 360-degree 3D telemedicine system worldwide. NHS Greater Glasgow and Clyde have been working with Microsoft since 2019 to assess how health care could leverage Microsoft’s 3D telemedicine, focusing on plastic surgery patients and leveraging Microsoft’s Holoportation communication technology.
This research was designed to compare validated outcome measures of a patient-centered 3D telemedicine system with a 2D system, assess alignment with an in-person consultation, and to ensure safety, reliability and clinical concordance. In three separate studies, the 3D system improved patient metrics in comparison to 2D telemedicine, suggesting that remote consultations could get closer to the experience of face-to-face consultations.
Automatic code generation from natural language intent using large language models is disrupting coding. However, the correctness of the resulting code with respect to user intent expressed in natural language is difficult to establish because natural language lacks formal semantics. In this project, we investigate the problem of neural specification generation (i.e., generating partial formal specifications that match the intent expressed in natural language), and incorporating such specifications during the coding process to improve trust in human-written or AI-generated code.
We instantiate this framework starting with unit tests; tests serve as weak yet formal specifications of a module. We can leverage the abundance of human-written unit tests to train models. Further, these specifications (tests) can be checked using concrete execution without the need for more sophisticated abstract interpreters. In prior work on TOGA, we demonstrated a neural model for synthesizing test oracles for a method and illustrated its use in finding functional bugs in code. In this work on TiCoder, we describe an interactive workflow to formalizing the informal user-intent through such model-generated tests and improving the accuracy, correctness and understanding of generated code.
Welcome to Research Focus, a new series of blog posts that highlights notable publications, events, code/datasets, new hires and other milestones from across the research community at Microsoft.
Meet the 2022 recipients of the Microsoft Research Global PhD Fellowship
Microsoft is thrilled to announce the 2022 Microsoft Research Global PhD Fellows from around the world. The program aims to empower the next generation of computing-related research talent. Microsoft recognizes the value of diversity in computing and aims to increase the pipeline of talent receiving advanced degrees in computing-related fields to build a stronger and inclusive computing-related research community. We currently offer PhD fellowships in Asia-Pacific, Canada and the United States, EMEA (Europe, Middle East, Africa), Latin America, Australia and New Zealand.
Multi-modal data abounds in biomedicine, such as radiology images and reports. Interpreting this data at scale is essential for improving clinical care workflows and accelerating clinical research. With its complex semantics, biomedical text poses additional challenges in vision-language modelling, and previous work has used insufficiently adapted models that lack domain-specific language understanding. In this study, we show that principled textual semantic modelling can substantially improve contrastive learning in biomedical vision-language processing (VLP). We release a language model (CXR-BERT) that achieves state-of-the-art results in radiology natural language inference through its improved vocabulary and novel language pretraining objective. Furthermore, we propose a self-supervised joint VLP approach (BioViL) with a focus on better text modelling. It establishes new state-of-the-art results on a wide range of publicly available benchmarks, in part by leveraging our novel domain-specific language model. As part of this study, a new dataset (MS-CXR) is released to facilitate the study of complex semantic modelling in biomedical VLP, which includes locally aligned phrase grounding annotations by radiologists. A broad evaluation, including on this new dataset, shows that our contrastive learning approach outperforms prior methods in segmentation tasks, despite only using a global-alignment objective.
On-Demand Watch now to learn about some of the most pressing questions facing our research community and listen in on conversations with 120+ researchers around how to ensure new technologies have the broadest possible benefit for humanity.
How AI Happens podcast: A conversation with AI4Science Senior Director Bonnie Kruft
Microsoft’s AI4Science Senior Director Bonnie Kruft was interviewed for a recent podcast in the “How AI Happens” series. Tune in to learn about her journey from earning a Ph.D. focused on quantum chemistry to working in AI and machine learning. She explains how she first discovered her love of data science, and how her Ph.D. equipped her with the skills she needed to succeed. The conversation also covers the data science approach to problem-solving, deep learning emulators and the impact that machine learning could have on the natural sciences.
Recent researcher awards and accomplishments
Ronen Eldan wins prestigious New Horizons in Mathematics Prize
Ronen Eldan, of Microsoft Research and the Weizmann Institute of Science, was awarded the prestigious New Horizons in Mathematics Prize by The Breakthrough Prize Foundation. Eldan was recognized for creating the stochastic localization method, which has led to significant progress in several open problems in high-dimensional geometry and probability, including Jean Bourgain’s slicing problem and the KLS conjecture.
The Breakthrough Prize Foundation and its founding sponsors – Sergey Brin, Priscilla Chan and Mark Zuckerberg, Julia and Yuri Milner, and Anne Wojcicki – announced the 2023 award winners in September. The foundation highlights game-changing discoveries in fundamental physics, life sciences and mathematics, along with early-career scientists who have made significant contributions to their fields.
Gary J. Sullivan named Fellow of the Society of Motion Picture and Television Engineers
Microsoft’s Gary J. Sullivan was recognized as a 2022 Fellow of the Society of Motion Picture and Television Engineers (SMPTE). The membership grade of fellow is awarded to individuals who have, by proficiency and contributions, attained an outstanding rank among engineers or executives in the motion-picture, television or related industries, according to SMPTE.
Sullivan is a principal video and image technology standardization program manager at Microsoft Research in Redmond, Washington. At Microsoft, he has been the originator and lead designer of the DirectX Video Acceleration (DXVA) video decoding feature of Microsoft Windows and in the international standardization community, he has led team projects that have been recognized by three Emmy Awards. His standardization work includes chairing or co-chairing various projects related to media compression in the JPEG, MPEG, and VCEG standards groups, including the AVC (H.264), HEVC (H.265) and VVC (H.266) video compression codec design projects. He is currently the chair of ISO/IEC JTC 1/SC 29, which oversees the work of JPEG and MPEG, and the Rapporteur of video and image coding in ITU-T SG16.
By Microsoft Mixed Reality & AI Labs in Cambridge and Zurich
Computer vision is one of the most remarkable developments to emerge from the field of computer science. It’s among the most rapidly growing areas in the technology landscape and has the potential to significantly impact the way people live and work. Advances at the intersection of machine learning (ML) and computer vision have been accelerating in recent years, leading to significant progress in numerous fields, including healthcare, robotics, the automotive industry, and augmented reality (AR). Microsoft is proud to be a prominent contributor to computer vision research.
Microsoft researchers have long been collaborating with academics and experts in the field on numerous computer vision projects with the goal of expanding what’s possible and helping people achieve more. One example is PeopleLens, a head-worn device that helps children who are blind or have low vision more easily interact in social situations by identifying people around them through spatialized audio. Another example is Swin Transformer. This computer vision architecture attains high accuracy in object detection and provides an opportunity to unify computer vision and natural language processing (NLP) architectures—increasing the capacity and adaptability of computer vision models.
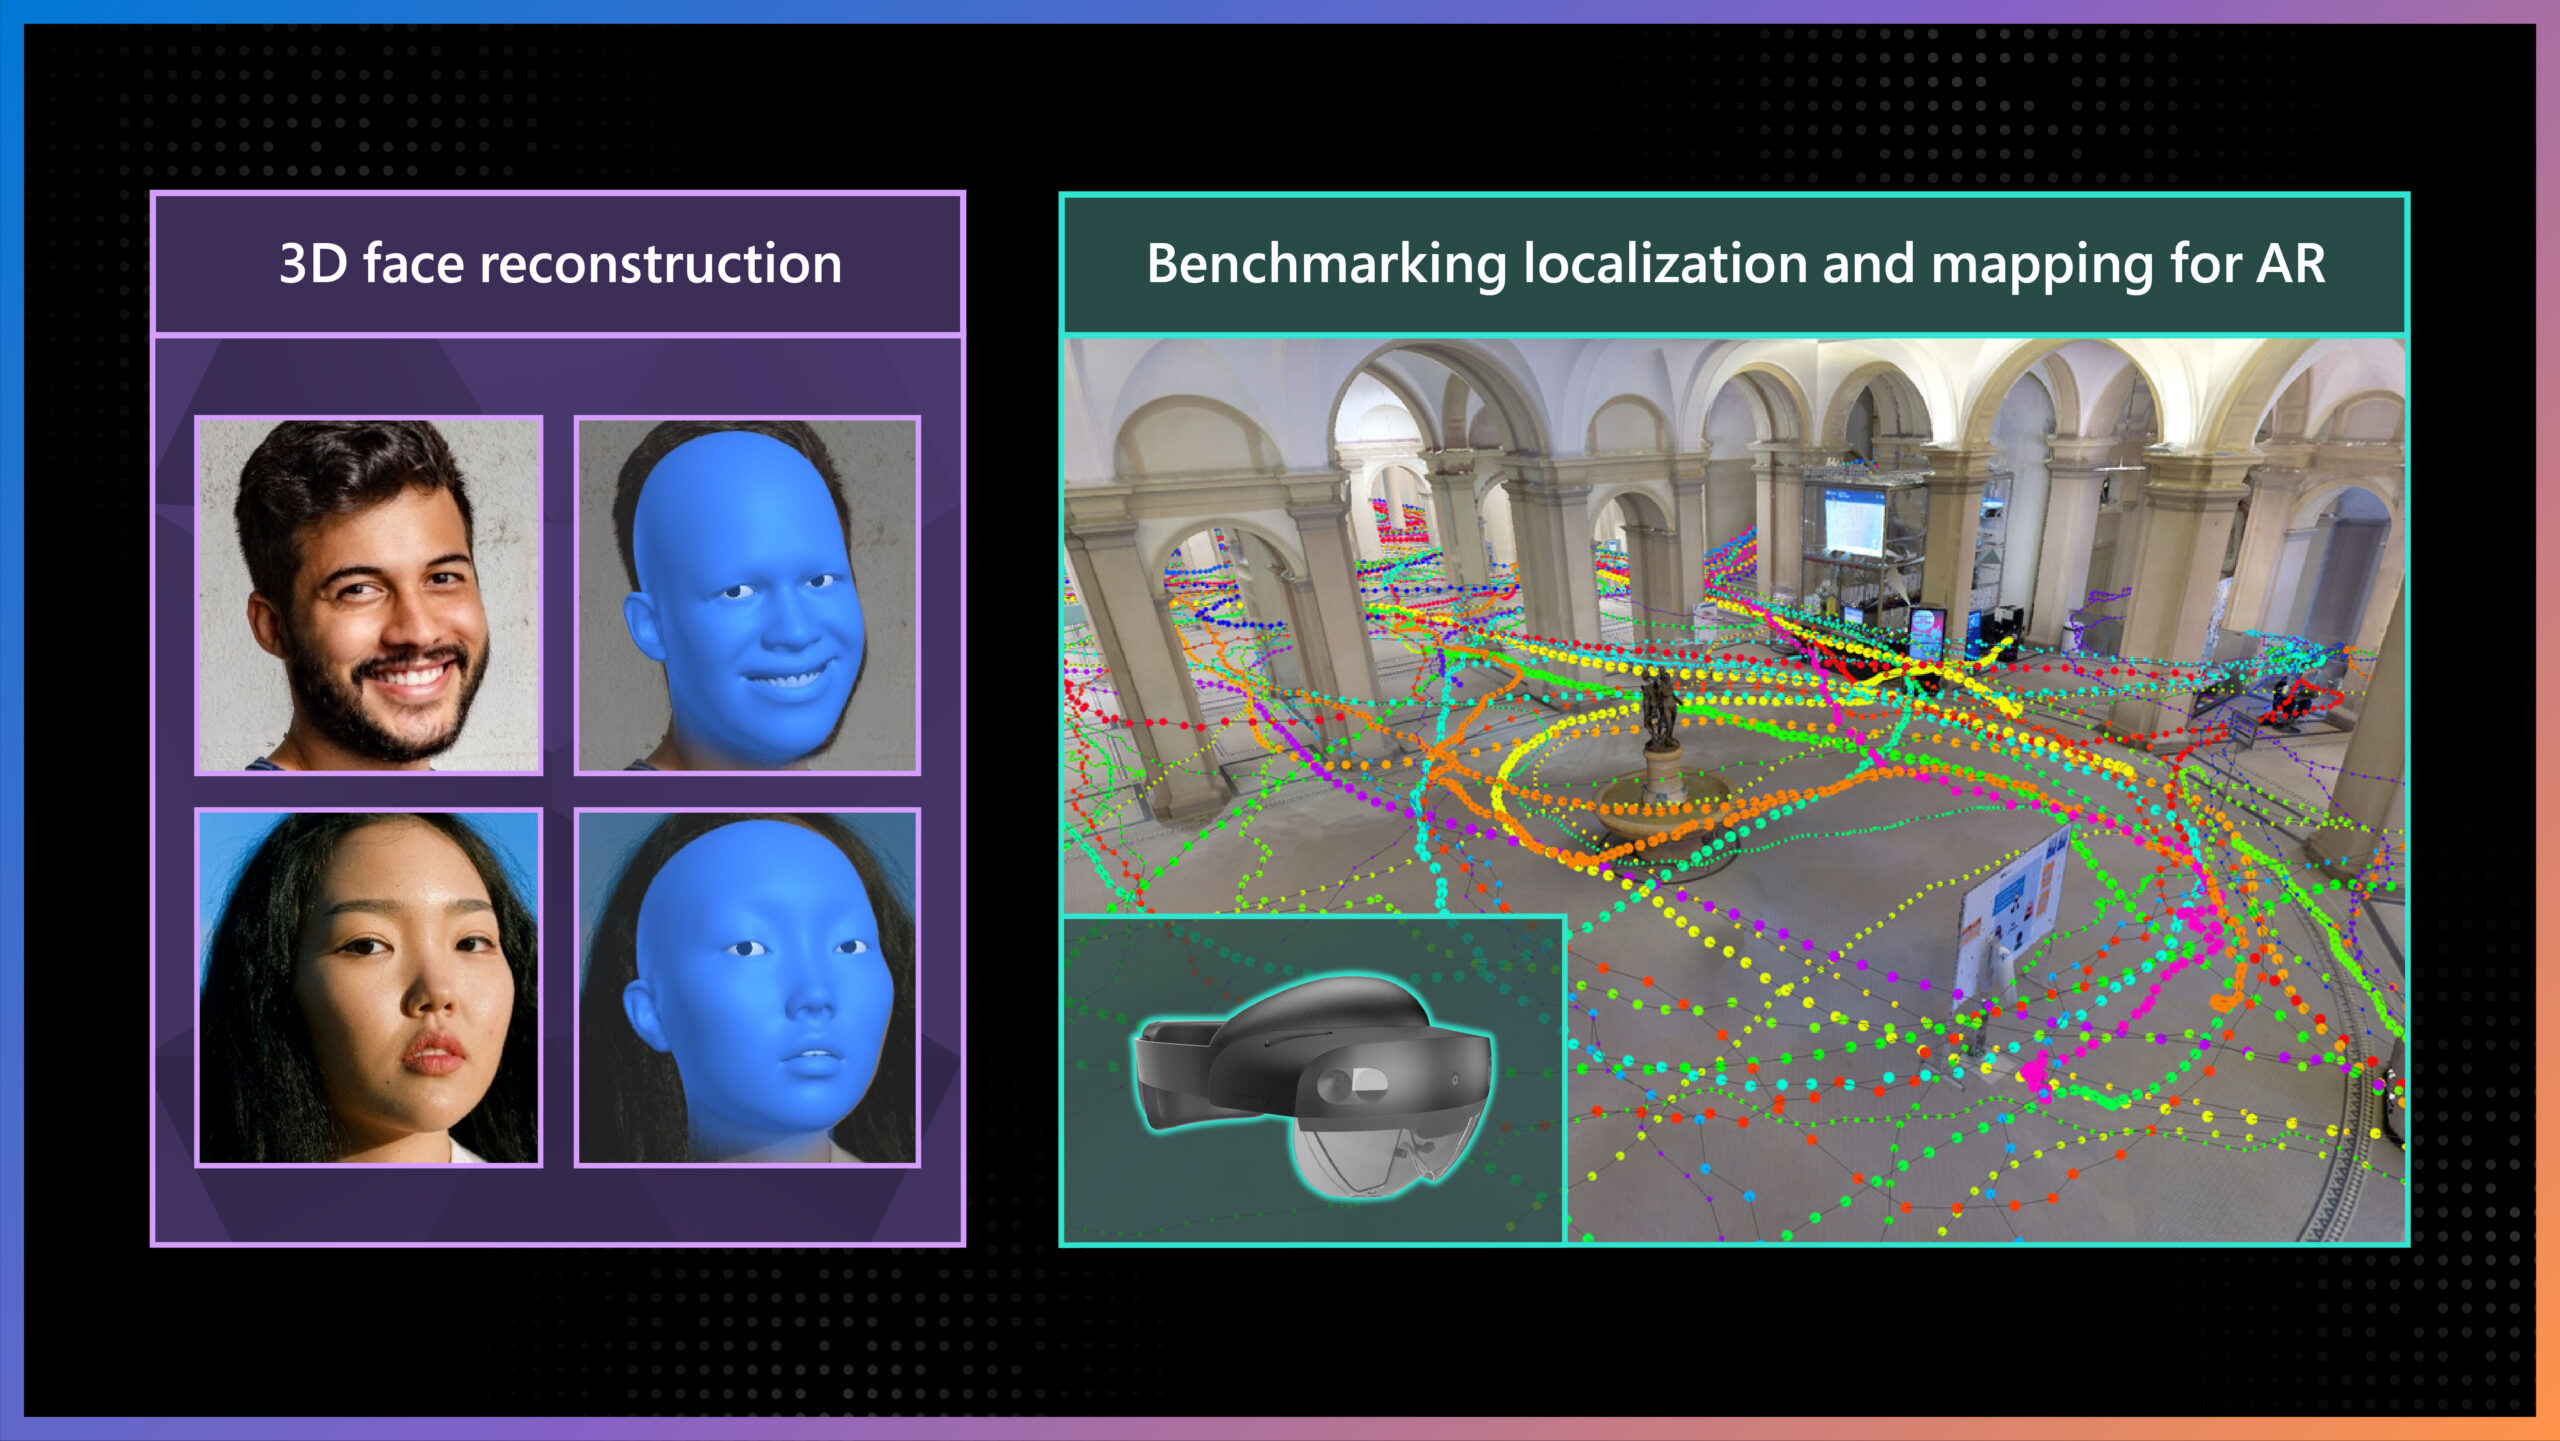
Microsoft Research is excited to share some of its newest work in this space at the European Conference on Computer Vision (ECCV) 2022, with 45 accepted papers that will be presented through live presentations, tutorials, and poster sessions. This post highlights two of these papers, which showcase the latest research from Microsoft and its collaborators. One involves increasing the number of facial landmarks for more accurate 3D face reconstruction, achieving state-of-the-art results while decreasing the required compute power. The other introduces a dataset that takes advantage of the capabilities of AR devices for visual localization and mapping driven by real-world AR scenarios.
3D face reconstruction with dense landmarks
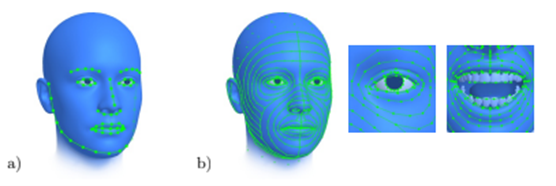
Facial landmarks are points that correspond across all faces, and they often play a key role in face analysis. Researchers frequently rely on them when performing basic computer vision tasks, such as estimating head position and identifying gaze direction and more generally the position in space of all the details of the face. Facial landmarks include such areas as the tip of the nose, corners of the eyes, and points along the jawline. Typically, public datasets that practitioners use to train ML models contain annotations for 68 facial landmarks. However, numerous aspects of human faces are not precisely represented by 68 landmarks alone, and additional methods are often needed to supplement landmark detection, adding complexity to the training workflow and increasing the required compute power.
Figure 1: Compared with a typical sparse set of 68 facial landmarks (a), dense landmarks (b) cover the entire head in detail, including ears, eyes, and teeth. These dense landmarks are better at encoding facial identity and subtle expressions.
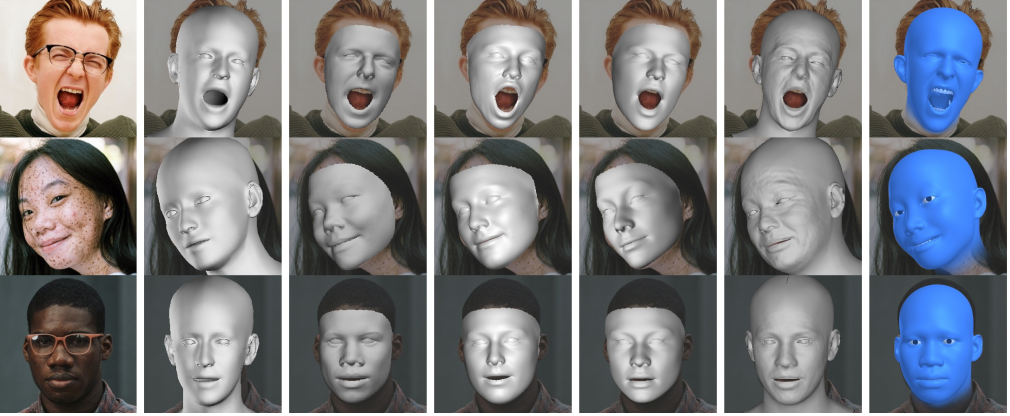
With the goal of achieving accurate 3D face reconstruction, we propose increasing the number of facial landmarks. In our paper “3D Face Reconstruction with Dense Landmarks,” we introduce a method to accurately predict 703 facial landmarks, more than 10 times as many as are commonly used, covering the entire face in great detail, including the eyes, ears, and teeth, as shown in Figure 1. We show that the increased number of landmarks are very precise when visible, and when they are occluded, for example, when someone lifts a coffee mug to their lips, we can estimate the location of these landmarks and what the part of the face looks like behind the object blocking it. We can use these landmarks to constrain a model-fitting problem to efficiently and precisely estimate all aspects of a face model, shown in the right-most column in Figure 2. This includes the head pose, eye gaze, as well as the identity of the person whose face is being reconstructed, for example, the thickness of the lips and the shape of the nose.
This simple pipeline is comprised only of dense landmarks and continuous mathematical optimization, allowing for extreme compute efficiency and enabling the entire system to run at over 150 frames per second on a single core of a laptop.
Figure 2: In this image, the original faces are on the left, the baselines are in the second through sixth columns, and our results are in the right-most column. Compared with previous recent monocular 3D face reconstruction methods, ours better captures gaze, expressions like winks and sneers, and the subtleties of facial identity. In addition, our method can run in real time with only a minor loss of fidelity.
Increasing privacy, fairness, and efficiency with synthetic data
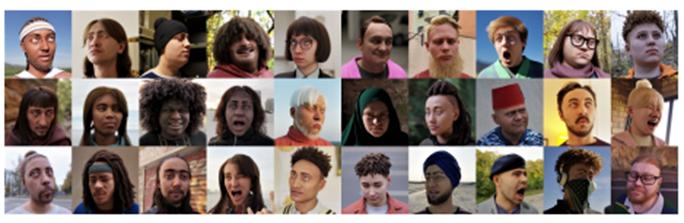
In computer vision, and particularly the area of face reconstruction, there are understandable concerns about anonymity when training ML models because training data often comes from real people. Our proposed method significantly reduces privacy concerns, as it uses only synthetic data to train ML models, compared with methods that use images of real people as part of their training datasets. That said, when we built the synthetic data pipeline, we needed to preserve the privacy of the people whose data we used, and we took care to acquire the consent of those several hundred subjects. This contrasts with the feasibility of acquiring consent from thousands (or even tens of thousands) of subjects, which would have been necessary if we were using real data.
It’s especially challenging, if not impossible, to preserve the privacy of people appearing in “found images” online, where the subject is often unknown. Using synthetic data helps us protect the privacy of data subjects and the rights of photographers and content creators. It’s another tool we can use in our mission to build technology in an ethical and responsible manner. Additionally, because people’s private information is not included in our dataset, if the ML model were to be attacked, only synthetic data would be subject to compromise.
Synthetic data also provides an opportunity to address inclusivity and fairness. Largely because the distribution of the data is fully controlled, ML practitioners can manage the fairness of representation by including diverse samples in their datasets, and all the data needed to do this would be perfectly labeled. For further details on how we build the synthetics model and training data and our approach to capturing the diversity of the human population, please see our face analysis paper.
There are other advantages to using synthetic data to train ML models, as well. For example, these models require a lot of data, giving rise to numerous difficulties that practitioners must navigate to obtain this data, such as the logistics of finding the number of people required, scheduling time in a lab, and situating multiple cameras to capture the various angles of a person’s face. These concerns are greatly reduced with synthetic data.
In addition, because data doesn’t need to be sourced from a real person, the iteration speed to improve the quality of the 3D face reconstruction is remarkably high, creating a robust workflow. And it isn’t necessary to apply quality assurance (QA) processes on each labeled image when using synthetic data—another cost- and time-saving benefit. Another advantage is the increase in accuracy, speed, and cost-effectiveness in labeling data. It would be nearly impossible to ask someone to consistently label 703 landmarks in a set of images.
Figure 3: Examples of the synthetic training data used in this project. Without the perfectly consistent annotations provided by synthetic data, dense landmark prediction would not be possible.
Face analysis is a foundational piece for many ML systems, such as facial recognition and controlling avatars, and using a method that provides both accuracy and efficiency while also addressing privacy and fairness concerns pushes the boundaries of the state of the art. Up until now, there hasn’t been much work, if any, on methods that can yield this level of quality with only synthetic data. The ability to achieve 3D face reconstruction using dense landmarks and synthetic data has the potential to truly transform what’s possible with ML.
LaMAR: Benchmarking localization and mapping for augmented reality
To unlock the full potential of augmented reality (AR), anyone using a mixed reality headset should be able to place virtual content in the physical world, share it with others, and expect it to remain in place over time. However, before they can augment digital content in the real world in the form of holograms, AR devices need to build a digitalmap of the physical 3D world. These devices then position, or re-localize, themselves with respect to this map, as illustrated in Figure 4, which allows them to retrieve previously placed holograms and show them to the user at a designated location. The computer vision foundations enabling these capabilities are called mapping andvisual localization.
Figure 4: The mapping and localization process.
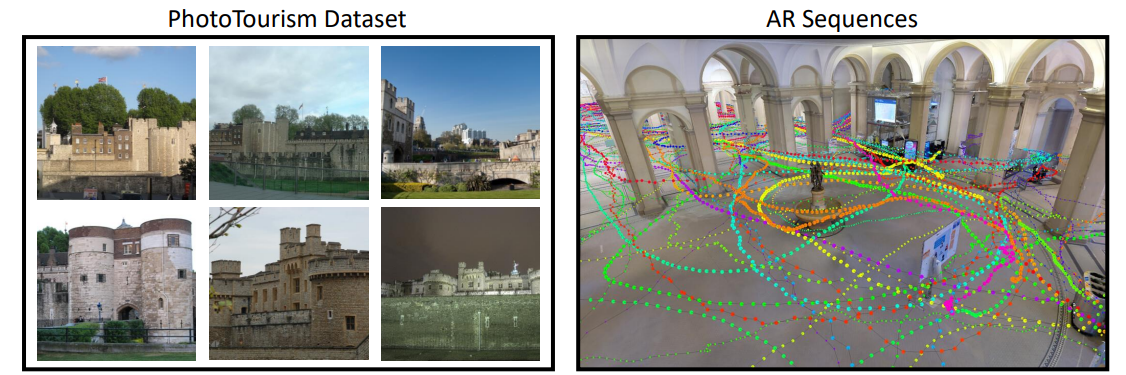
In general, research in visual localization focuses on single images, usually carefully selected views of famous attractions, shown on the left in Figure 5. However, this doesn’t reflect real AR scenarios—the combination of AR devices and applications—and the opportunity they provide. AR devices can locally map the environment and provide spatially registered sequences rather than single images, as shown in the image on the right in Figure 5. These sequences can also include additional data, like inertial or radio signals from sensors, which are typically available on modern AR devices, such as Microsoft HoloLens 2. Yet it’s challenging to use such sequences for localization because they are typically just collected during normal device usage and not generally aimed at facilitating localization.
Figure 5: On the left, single views are spread throughout large spaces and concentrate at points of interest. In contrast, the AR sequences on the right are densely sampled through the environment and do not focus on specific spots. While our dataset (on the right) captures a much smaller spatial area than landmark datasets (on the left), they contain a similar number of images. This illustrates how much more densely typical AR data is sampled within the scene. Each path represents a different sequence.
To close this gap, we introduce a new benchmark, the first to focus on this more realistic setting for AR, with the understanding that visual re-localization is a key element for compelling, shared, and persistent AR experiences. Given the spatial scale of the environment for typical AR scenarios, such as navigating an airport or inspecting a factory, we had to design a pipeline that could automatically compute the ground-truth camera positions of real AR sequences captured by a variety of readily available AR devices, such as the HoloLens or iPhone. By evaluating state-of-the-art methods on our benchmark, we offer novel insights on current research and provide avenues for future work in the field of visual localization and mapping for AR.
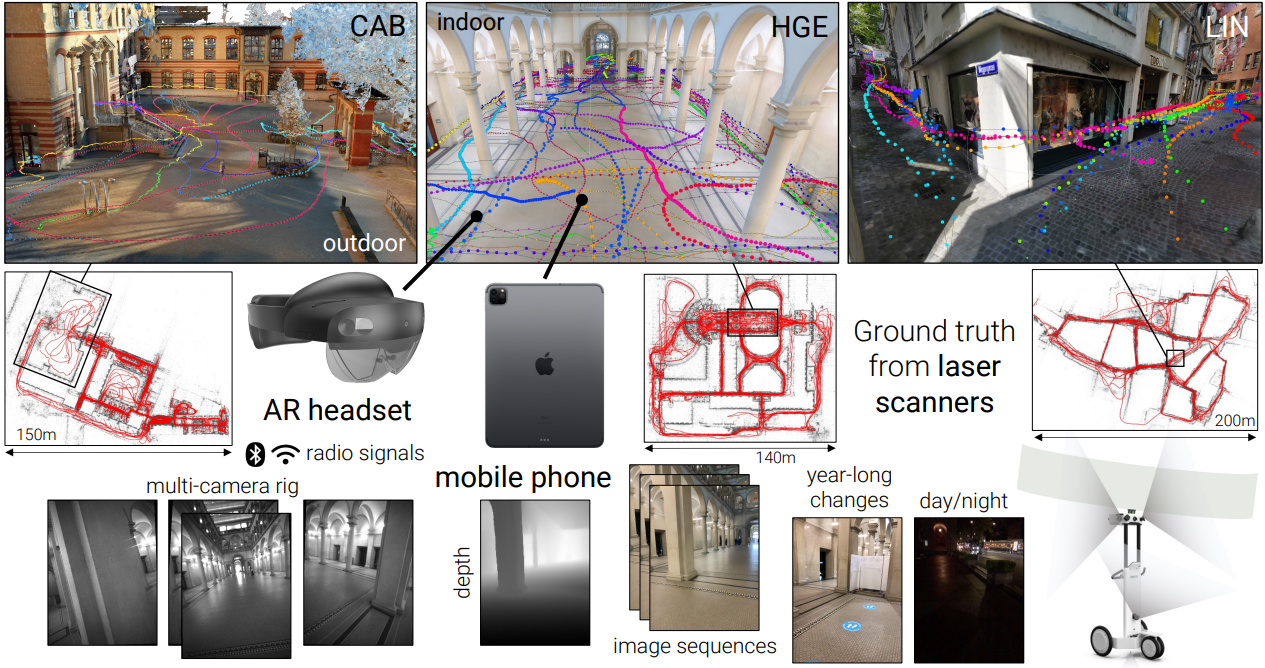
Figure 6: We revisited localization and mapping in the context of AR by introducing LaMAR, a large-scale dataset captured using AR devices (iPhone, iPad, HoloLens 2) and laser scanners.
To enable the research community to address the specifics of mapping and visual localization in the context of AR, we collected multi-sensor data streams from modern AR devices. These sensor streams come with camera poses (the camera’s position and orientation) from the on-device tracker at each instant. These data streams also contain images, depth measurements, samples from inertial measurement units (IMUs), and radio signals. Exploiting these can lead to more efficient algorithms. For example, radio signals such as Wi-Fi or Bluetooth can simplify image retrieval. Similarly, sequence localization can exploit the temporal aspect of sensor streams to provide a more spatial context, which can lead to more accurate estimates of camera poses. This typifies the realistic use case of a user launching an AR application and streaming sensorial data to localize the camera with respect to a previously built map, and it reflects how AR applications built on mixed reality cloud services, like Azure Spatial Anchors, work.
Figure 7: Sample sequences from the dataset.
The initial release of the LaMAR dataset contains more than 100 hours of recordings covering 45,000 square meters (484,000 square feet) captured over the course of two years using the head-mounted HoloLens 2 and handheld iPhone/iPad devices. The data was captured at various indoor and outdoor locations (a historical building, a multi-story office building, and part of a city center) and represents typical AR scenarios. It includes changes in illumination and the movement of objects—either slowly, such as the placement of a book on a desk, or more quickly, like anonymized people walking down a sidewalk.
Automatically aligning AR sequences to establish ground truth
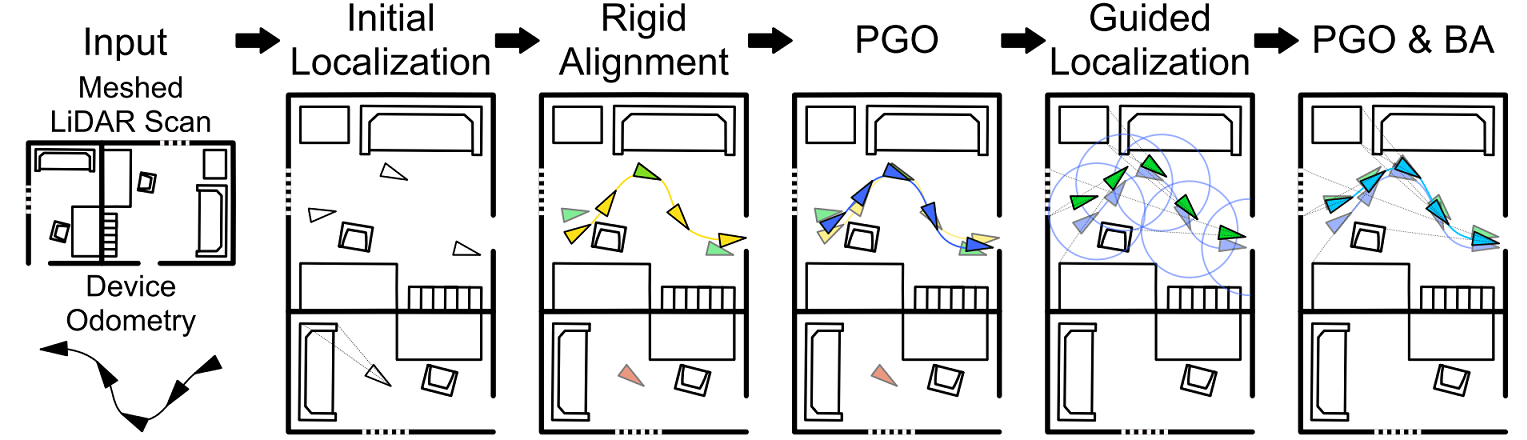
To estimate the ground-truth camera poses, we aligned the captured data with reference 3D models of the locations, as shown in Figure 8. These reference models were captured using NavVis M6 and VLX mapping systems, both equipped with laser scanners (lidars) that generate dense, textured, and highly accurate 3D models of the locations. To align the data, we developed a robust pipeline that does not require manual labeling or setting custom infrastructure, such as fiducial markers, and this enabled us to robustly handle crowd-sourced data from a variety of AR devices captured over extended periods.
Figure 8: The top-right and bottom-left of each square show the reference 3D model of the environment rendered from estimated ground-truth poses and overlayed with the image captured using the AR device. The top-left and bottom-right of each square show pixel-level accuracy of the alignment.
The actual alignment process is fully automatic and utilizes the on-device real-time tracker of AR devices, which provides camera poses in their local coordinate system. We aligned each captured sequence individually with the dense ground truth reference model, as illustrated in Figure 9. Once completed, all camera poses were refined jointly by optimizing the visual constraints within and across sequences.
Figure 9: Sequence-to-scan alignment. We first estimated the absolute pose of each sequence frame using image retrieval and matching. This initial localization prior was used to obtain a single rigid alignment between the input trajectory and the reference 3D model via voting. This allows us to discard outliers, as shown in the bottom part of the figure. The alignment was then relaxed by optimizing the individual frame poses in a pose graph (PGO) based on both relative and absolute pose constraints. We bootstrapped this initialization by mining relevant image pairs and re-localizing the queries. Given these improved absolute priors, we optimized the pose graph again and finally included reprojection errors of the visual correspondences in a bundle adjustment (BA) problem, yielding a refined trajectory.
Evaluating localization and mapping in the context of AR
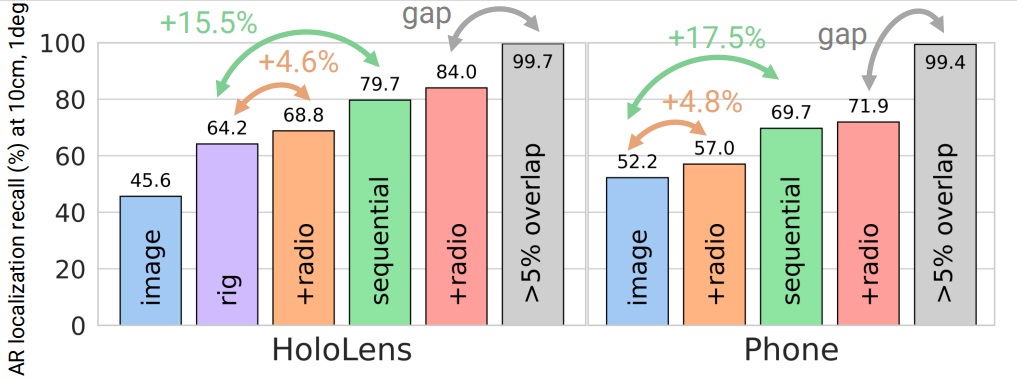
We evaluated current state-of-the-art approaches in the single-frame setting as localizing i) single images obtained from phones and ii) single images and full camera rigs from HoloLens 2. Then we adapted these state-of-the-art approaches to take advantage of radio signals. Finally, we designed baselines, building on these methods and utilizing the on-device real-time tracker in a multi-frame localization setting corresponding to a real-world AR application. The results show that performance of state-of-the-art methods can be significantly improved by including these additional data streams generally available in modern AR devices, as shown in Figure 10.
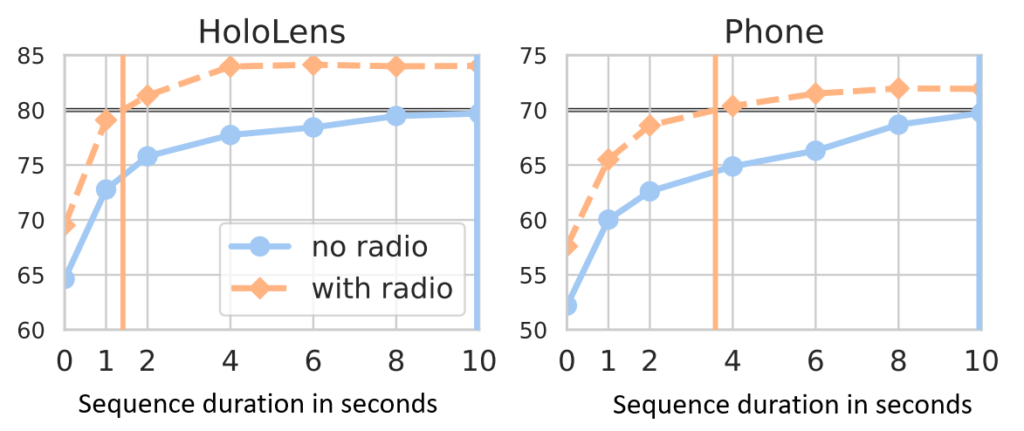
Figure 10: These bar graphs show localization recall for state-of-the-art methods on both HoloLens 2 and iPhone queries. We considered several tracks: single-image and rig localization with and without radios, and similarly for sequence localization. In addition, we report a theoretical upper bound: the percentage of queries with at least 5 percent ground truth overlap with respect to the best database image.
For a compelling user experience, AR applications should strive to retrieve and visualize content as quickly as possible after starting a session. To quantify this, we introduce a new metric called time-to-recall, which measures the sequence duration needed for successful localization. This encourages researchers to develop algorithms to accurately localize the camera as quickly as possible, as shown in Figure 11.
Figure 11: We show the time-to-recall at 80 percent for the HoloLens 2 and at 70 percent for phone queries. Using radio signals reduces the time-to-recall from 10 seconds to 1.40 seconds and 3.58 seconds, respectively.
Using the LaMAR benchmark
LaMAR is the first benchmark that focuses on a realistic setup for visual localization and mapping using AR devices. The evaluation results show enormous potential for leveraging posed sequences instead of single frames and for leveraging other sensor modalities, like radio signals, to localize the camera and map the environment.
Researchers can access the LaMAR benchmark, evaluation server, implementations of the ground-truth pipeline, as well as baselines with additional sensory data at the LaMAR Benchmark page. We hope this work inspires future research in developing localization and mapping algorithms tailored to real AR scenarios.
Welcome to Research Focus, a new series of blog posts that highlights notable publications, events, code/datasets, new hires and other milestones from across the research community at Microsoft.
Partial differential equations (PDEs) are widely used to describe simulation of physical processes as scalar and vector fields interacting and coevolving over time.
Recent research has focused on using neural surrogates to accelerate such simulations. However, current methods do not explicitly model relationships between fields and their correlated internal components, such as the scalar temperature field and the vector wind velocity field in weather simulations.
In this work, we view the time evolution of such correlated fields through the lens of mulitvector fields, which consist of scalar, vector, and higher-order components, such as bivectors. An example of a bivector is the cross-product of two vectors in 3-D, which is a plane segment spanned by these two vectors, and is often represented as a vector itself. But the cross-product has a sign flip under reflection, which a vector does not. It is a bivector.
The algebraic properties of multivectors, such as multiplication and addition, can be described by Clifford algebras, leading to Clifford neural layers such as Clifford convolutions and Clifford Fourier transforms. These layers are universally applicable and will find direct use in the areas of fluid dynamics, weather forecasting, and the modeling of physical systems in general.
While the promise of quantum is great, we are still in the early days of what is possible. Today’s quantum computers enable interesting research, however, innovators find themselves limited by the inadequate scale of these systems and are eager to do more. Microsoft is taking a more challenging, but ultimately a more promising approach to scaled quantum computing. We are engineering a full-stack quantum machine powered by topological qubits. We theorize that this type of qubit will be inherently more stable than qubits produced with existing methods without sacrificing size or speed. Earlier this year we had a major scientific breakthrough that cleared a significant hurdle – we discovered that we could produce the topological superconducting phase and its concomitant Majorana zero modes. In essence, we now have the building block for a topological qubit and quantum at scale. Learn more about this discovery from Dr. Chetan Nayak, Distinguished Engineer of Quantum at Microsoft, who just released a preprint to arXiv and met with leaders in the quantum computing industry.
To help users enhance low quality videos in real time, on edge equipment and with limited computing power, researchers from Microsoft Research Asia launched a set of intelligent image/video enhancement tools called DaVinci. This toolkit aims to solve the pain points of existing video enhancement and restoration tools, give full play to the advantages of AI technology and lower the threshold for users to process video footage.
The targeted features of the DaVinci toolkit include low-level image and video enhancement tasks, real-time image and video filters, and visual quality enhancement such as super-resolution, denoising, and video frame interpolation. The backend technology of the DaVinci toolkit is supported by the industry-leading large-scale, low-level vision pre-training technology, supplemented by a large amount of data training. To maximize the robustness of the model, researchers use four million publicly available images and video data, with contents covering landscapes, buildings, people, and so on. To ensure an adequate amount of training data and rich data types, researchers synthesized data with various degradations, so that the entire model training could cover more actual user application scenarios. The DaVinci toolkit has been packaged and released on GitHub.
In the post-pandemic world, a large portion of meetings, conferences, and trainings have been moved online, leading to a sharp increase in demand for audio and video creation. However, making zero-mistake audio/video recordings is time consuming, with re-recordings required to fix even the smallest mistakes. Therefore, a simple technique for making partial corrections to recordings is urgently needed. Researchers from Microsoft Research Asia’s Intelligent Multimedia Group and from Azure Speech Team developed a text-based speech editing system to address this problem. The system supports cutting, copying, pasting operations, and inserting synthesized speech segments based on text transcriptions.
AI4Science expands with new research lab in Berlin
Deep learning is set to transform the natural sciences, dramatically improving our ability to model and predict natural phenomena over widely varying scales of space and time. In fact, this may be the dawn of a new paradigm of scientific discovery. To help make this new paradigm a reality, Microsoft Research recently established AI4Science, a new global organization that will bring together experts in machine learning, quantum physics, computational chemistry, molecular biology, fluid dynamics, software engineering, and other disciplines.
This month, the AI4Science organization expanded with a new presence in Berlin, to be led by Dr. Frank Noé. As a “bridge professor,” Noé specializes in work at the interfaces between the fields of mathematics and computer science as well as physics, biology, chemistry and pharmacy. For his pioneering work in developing innovative computational methods in biophysics, he has received awards and funding from the American Chemical Society and the European Research Council, among others.
In the video below, Noé discusses the new lab in Berlin, and potential for machine learning to advance the natural sciences, with Chris Bishop, Microsoft Technical Fellow and director, AI4Science.
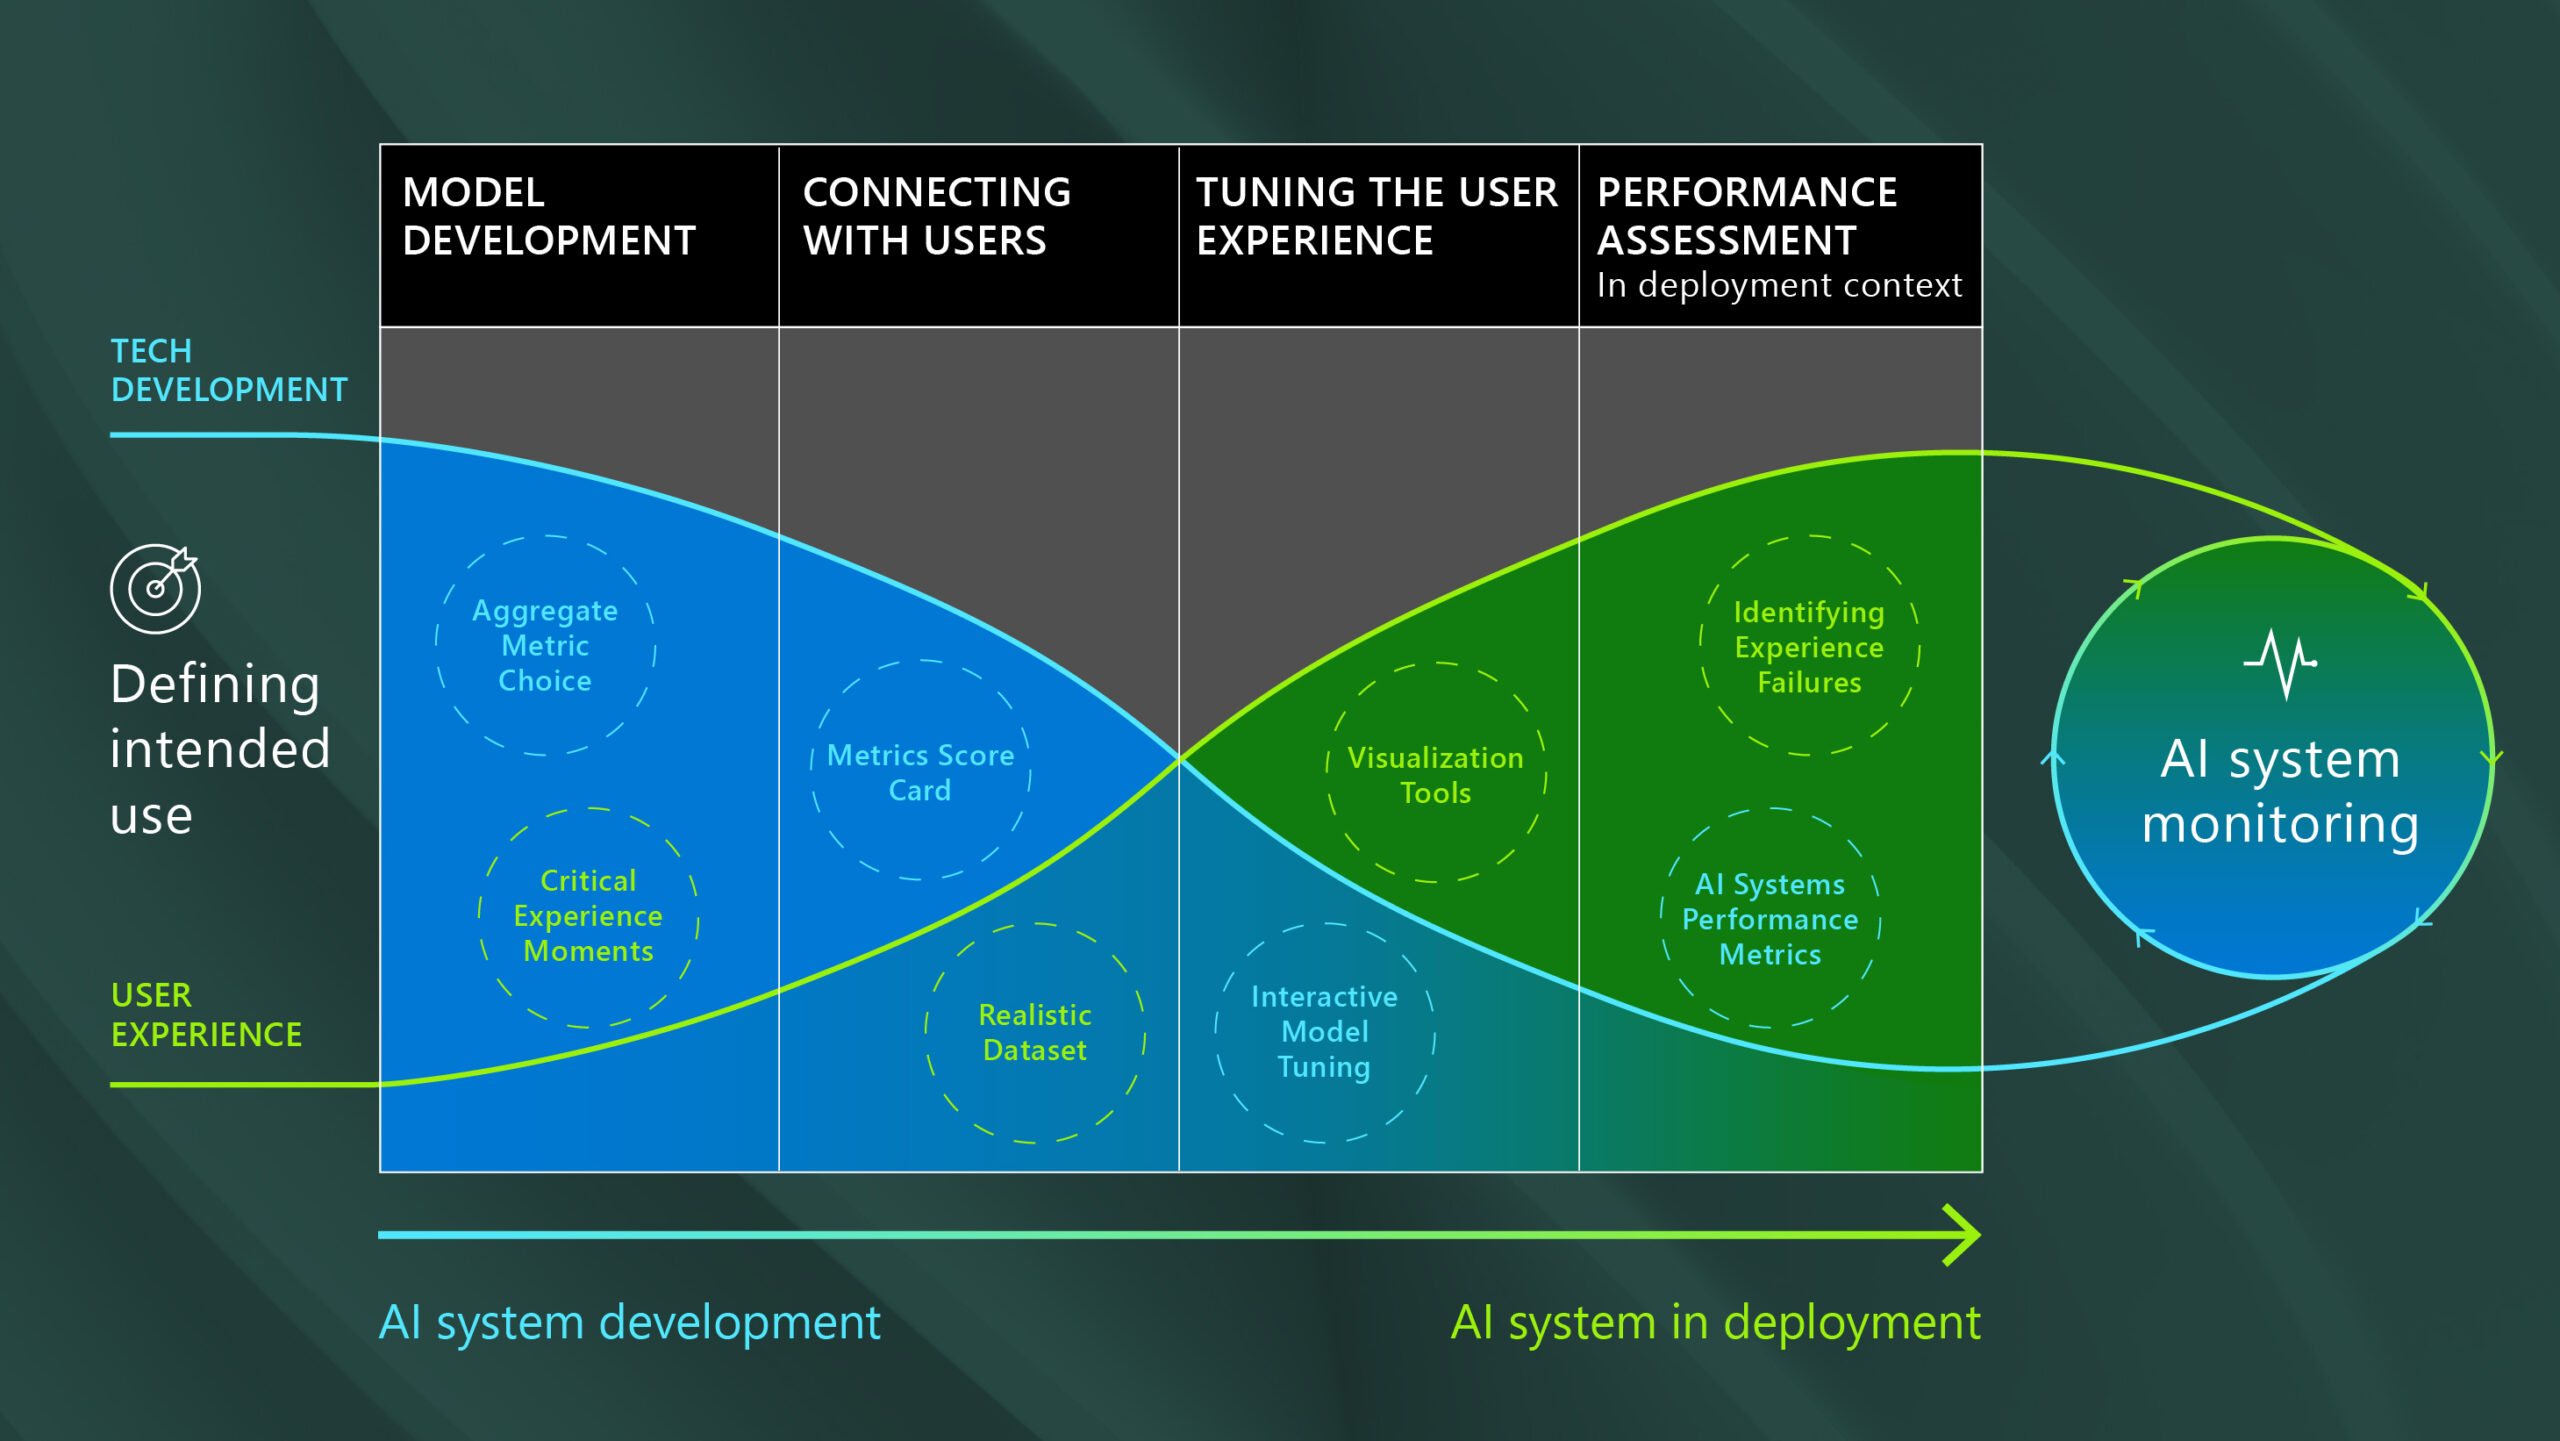
Figure 1: Performance assessment methods change across the development lifecycle for complex AI systems in ways that differ from general purpose AI. The emphasis shifts from rapid technical innovation that requires easy-to-calculate aggregate performance metrics at the beginning of the development process to metrics that reflect the performance of critical AI system attributes needed to underpin the user experience at the end.
AI systems are becoming increasingly complex as we move from visionary research to deployable technologies such as self-driving cars, clinical predictive models, and novel accessibility devices. Unlike singular AI models, it is more difficult to assess whether these more complex AI systems are performing consistently and as intended to realize human benefit.
Real-world contexts for which the data might be noisy or different from training data;
Multiple AI components interact with each other, creating unanticipated dependencies and behaviors;
Human-AI feedback loops that come from repeated engagements between people and AI system.
Very large AI models (e.g., transformer models)
AI models that interact with other parts of a system (e.g., user interface or heuristic algorithm)
How do we know when these more advanced systems are ‘good enough’ for their intended use? When assessing the performance of AI models, we often rely on aggregate performance metrics like percentage of accuracy. But this ignores the many, often human elements, that make up an AI system.
Our research on what it takes to build forward-looking, inclusive AI experiences has demonstrated that getting to ‘good enough’ requires multiple performance assessment approaches at different stages of the development lifecycle, based upon realistic data and key user needs (figure 1).
Shifting emphasis gradually from iterative adjustments in the AI models themselves toward approaches that improve the AI system as a whole has implications not only in terms of how performance is assessed, but who should be involved in the performance assessment process. Engaging (and training) non-technical domain experts earlier (i.e., for choosing test data or defining experience metrics) and in a larger capacity throughout the development lifecycle can enhance relevance, usability, and reliability of the AI system.
Spotlight: UPCOMING EVENT
Register today: Microsoft Research Summit 2022
October 18–20, 2022 Join us as the global research community gathers to share progress and spark conversations around advances that could empower people in new ways and positively impact our world.
Performance assessment best practices from the PeopleLens
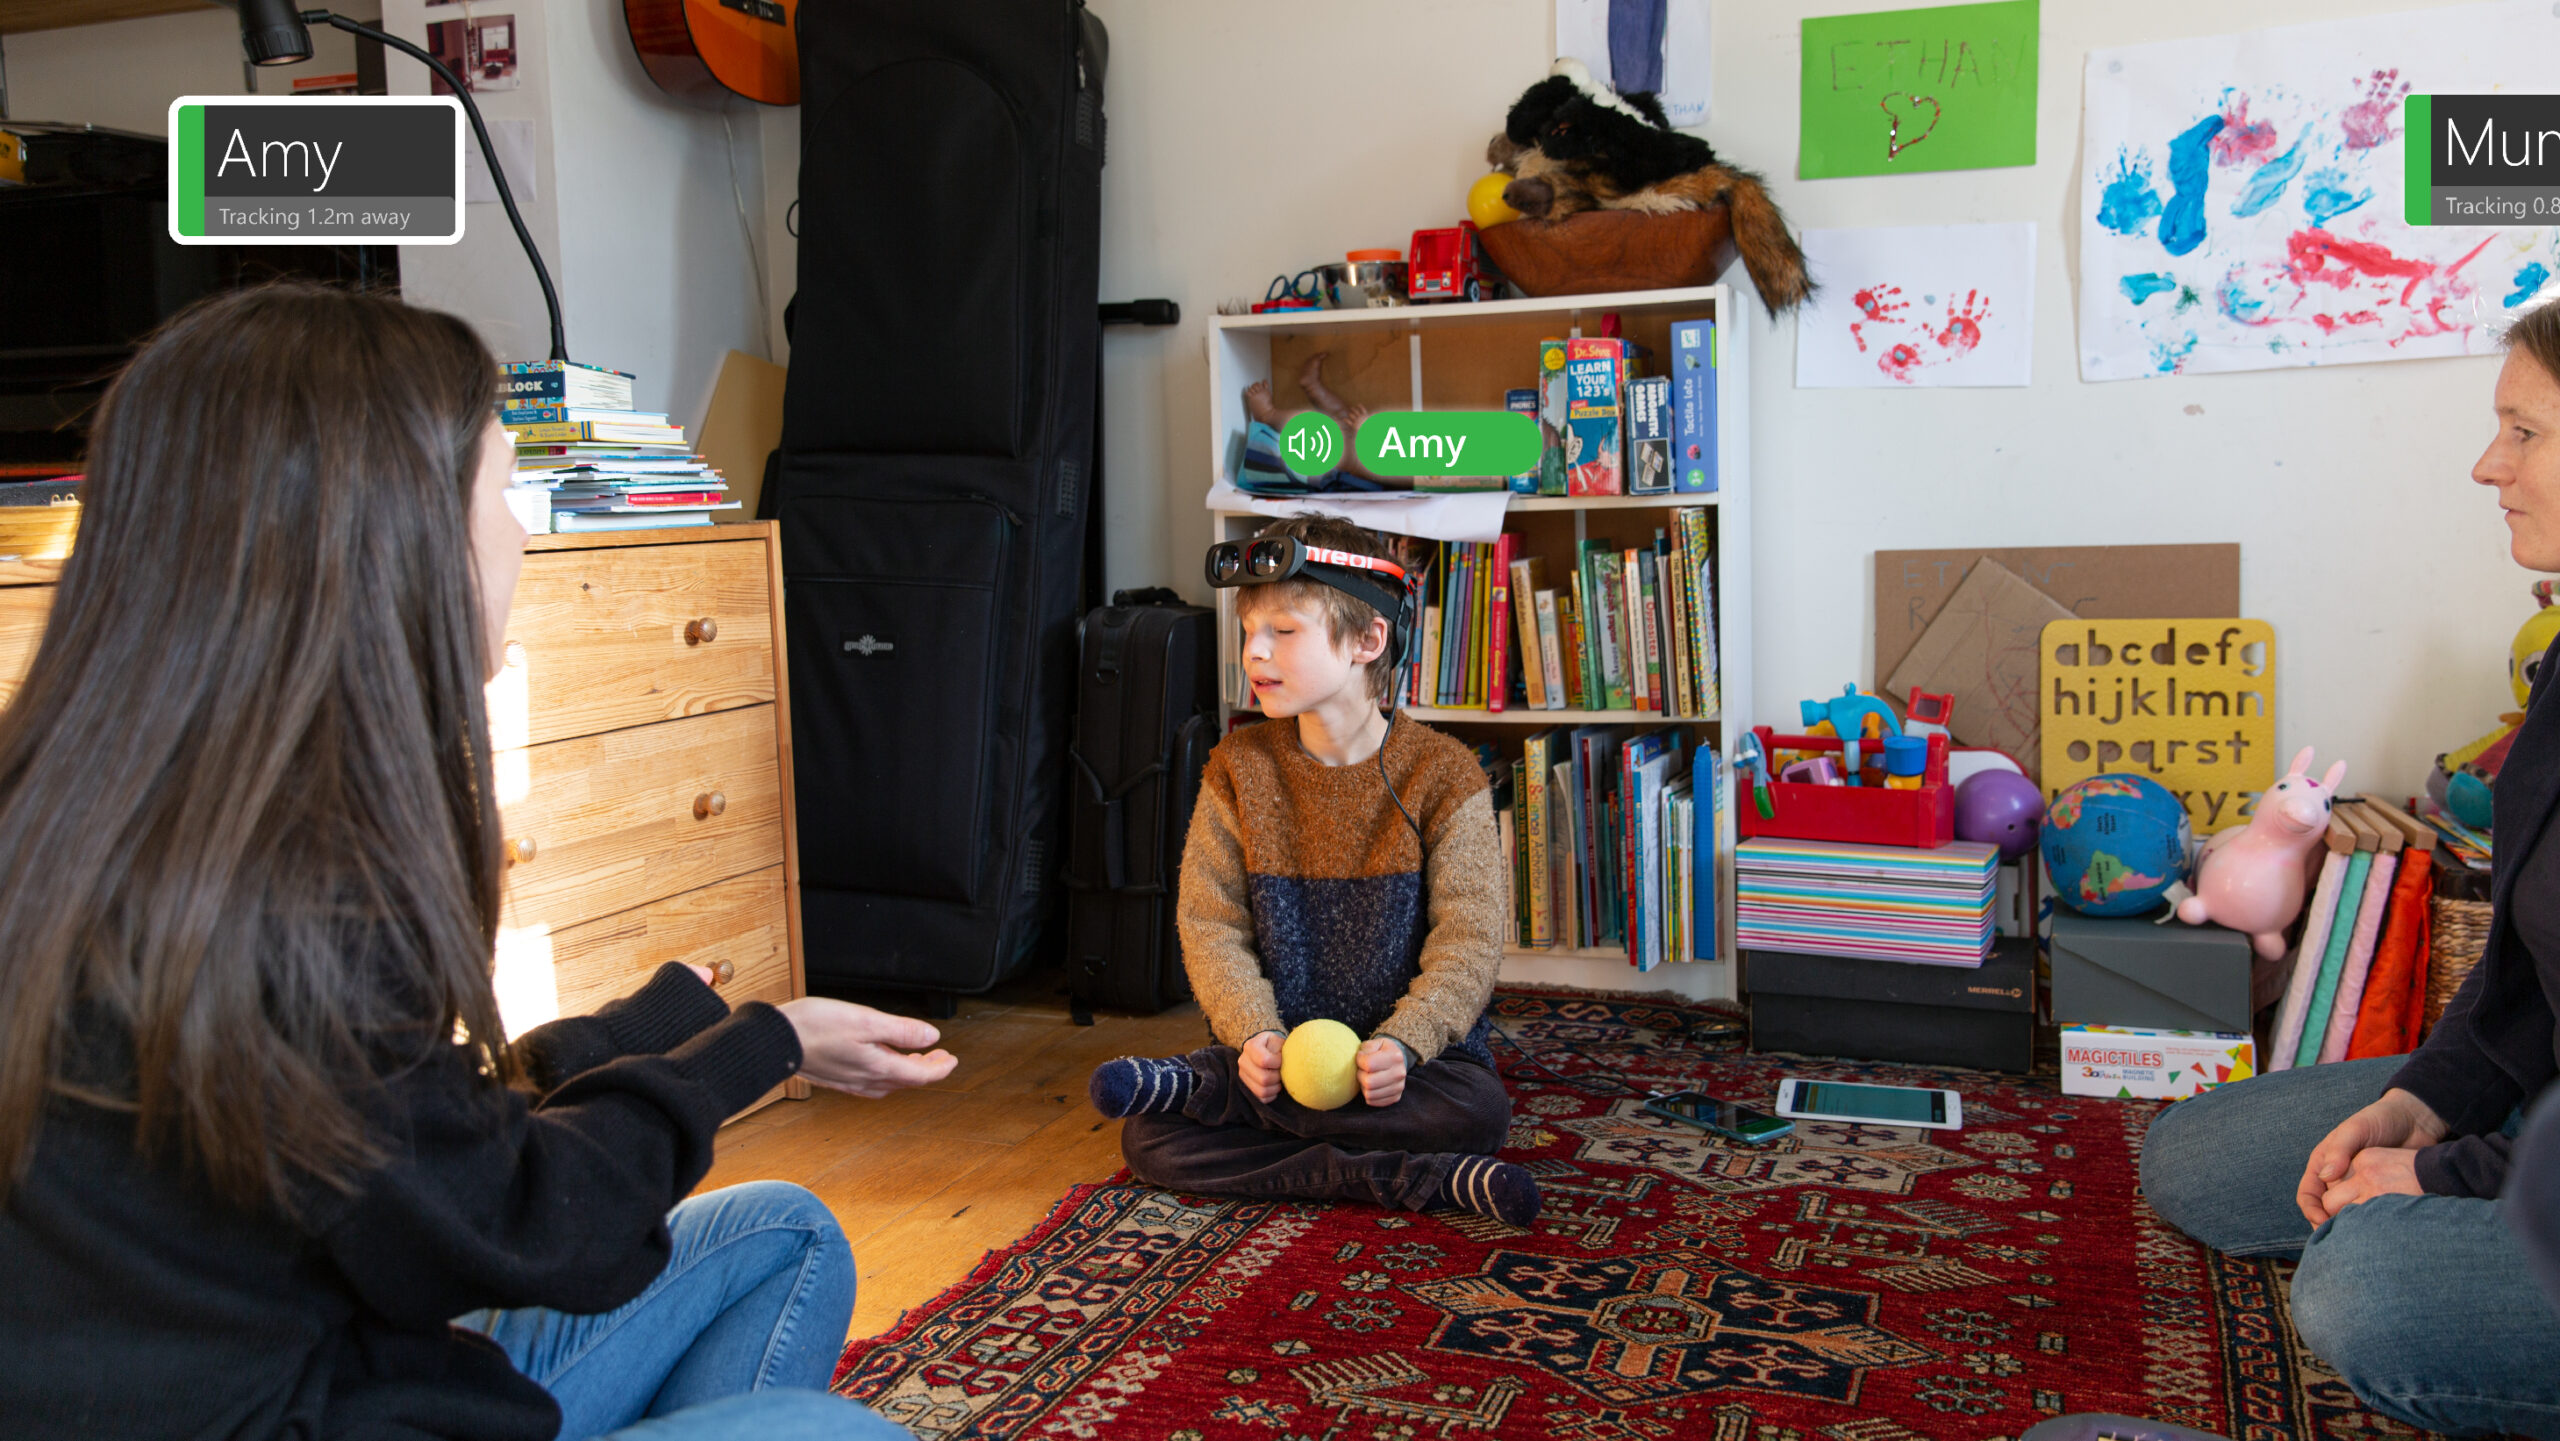
The PeopleLens (figure 2) is a new Microsoft technology designed to enable children who are born blind to experience social agency and build up the range of social attention skills needed to initiate and maintain social interactions. Running on smart glasses, it provides the wearer with continuous, real-time information about the people around them through spatial audio, helping them build up a dynamic map of the whereabouts of others. Its underlying technology is a complex AI system using several computer vision algorithms to calculate, pose, identify registered people, and track those entities over time.
The PeopleLens offers a useful illustration of the wide range of performance assessment methods and people necessary to comprehensively gauge its efficacy.
Figure 2: The PeopleLens is a new research technology designed to help people who are blind or have low vision better understand their immediate social environments by locating and identifying people in the space dynamically in real-time.
Getting started: AI model or AI system performance?
Calculating aggregate performance metrics on open-source benchmarked datasets may demonstrate the capability of an individual AI model, but may be insufficient when applied to an entire AI system. It can be tempting to believe a single aggregate performance metric (such as accuracy) can be sufficient to validate multiple AI models individually. But the performance of two AI models in a system cannot be comprehensively measured by simple summation of each model’s aggregate performance metric.
We used two AI models to test the accuracy of the PeopleLens to locate and identify people: the first was a benchmarked, state-of-the-art pose model used to indicate the location of people in an image. The second was a novel facial recognition algorithm previously demonstrated to have greater than 90% accuracy. Despite strong historical performance of these two models, when applied to the PeopleLens, the AI system recognized only 10% of people from a realistic dataset in which people were not always facing the camera.
This finding illustrates that multi-algorithm systems are more than a sum of their parts, requiring specific performance assessment approaches.
Connecting to the human experience: Metric scorecards and realistic data
Metrics scorecards, calculated on a realistic reference dataset, offer one way to connect to the human experience while the AI system is still undergoing significant technical iteration. A metrics scorecard can combine several metrics to measure aspects of the system that are most important to users.
We used ten metrics in the development of PeopleLens. The most valuable two metrics were time-to-first-identification, which measured how long it took from the time a person was seen in a frame to the user hearing the name of that person, and number of repeat false positives, which measured how often a false positive occurred in three frames or more in a row within the reference dataset.
The first metric captured the core value proposition for the user: having the social agency to be the first to say hello when someone approaches. The second was important because the AI system would self-correct single misidentifications, while repeated mistakes would lead to a poor user experience. This measured the ramifications of that accuracy throughout the system, rather than just on a per-frame basis.
Beyond metrics: Using visualization tools to finetune the user experience
While metrics play a critical role in the development of AI systems, a wider range of tools is needed to finetune the intended user experience. It is essential for development teams to test on realistic datasets to understand how the AI system generates the actual user experience. This is especially important with complex systems, where multiple models, human-AI feedback loops, or unpredictable data (e.g., user-controlled data capture) can cause the AI system to respond unpredictably.
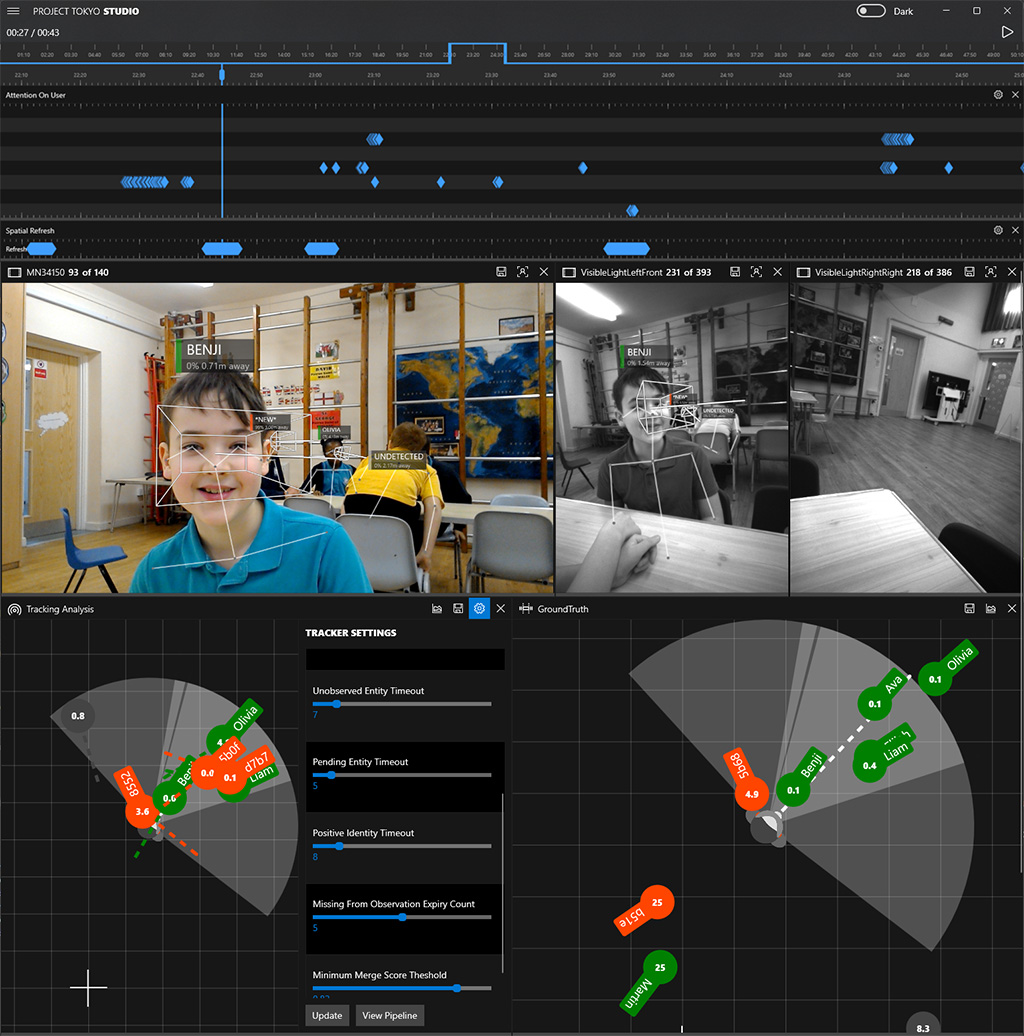
Visualization tools can enhance the top-down statistical tools of data scientists, helping domain experts contribute to system development. In the PeopleLens, we used custom-built visualization tools to compare side-by-side renditions of the experience with different model parameters (figure 3). We leveraged these visualizations to enable domain experts—in this case parents and teachers—to spot patterns of odd system behavior across the data.
Figure 3: Visualization tools helped the development team, including domain experts, in connecting the AI system to the user experience using realistic data. In this image, the top bar shows images taken from the wearable camera stream overlayed with the various model outcomes. The bottom bar shows the output of the world-state tracking algorithm on the left and the ground truth on the right. The panel in the middle shows model parameters that are being changed with the impact on the user experience being viewed in real time.
AI system performance in the context of the user experience
A user experience can only be as good as the underlying AI system. Testing the AI system in a realistic context, measuring things that matter to the users, is a critical stage before wide-spread deployment. We know, for example, that improving AI system performance does not necessarily correspond to improved performance of AI teams (reference).
We also know that human-to-AI feedback loops can make it difficult to measure an AI system’s performance. Essentially repeated interactions between AI system and user, these feedback loops can surface (and intensify) errors. They can also, through good intelligibility, be repaired by the user.
The PeopleLens system gave users feedback about the people’s locations and their faces. A missed identification (e.g., because the person is looking at a chest rather than a face) can be resolved once the user responds to feedback (e.g., by looking up). This example shows us that we do not need to focus on missed identification as they will be resolved by the human-AI feedback loop. However, users were very perplexed by the identification of people who were no longer present, and therefore performance assessments needed to focus on these false positive misidentifications.
Multiple performance assessment methods should be used in AI system development. In contrast to developing individual AI models, general aggregate performance metrics are a small component, relevant primarily in the earliest stages of development.
Documenting AI system performance should include a range of approaches, from metrics scorecards to system performance metrics for a deployed user experience, to visualization tools.
Domain experts play an important role in performance assessment, beginning early in the development lifecycle. Domain experts are often not prepared or skilled for the in-depth participation optimal in AI system development.
Visualization tools are as important as metrics in creating and documenting an AI system for a particular intended use. It is critical that domain experts have access to these tools as key decision-makers in AI system deployment.
Bringing it all together
For complex AI systems, performance assessment methods change across the development lifecycle in ways that differ from individual AI models. Shifting performance assessment techniques from rapid technical innovation requiring easy-to-calculate aggregate metrics at the beginning of the development process, to the performance metrics that reflect critical AI system attributes that make up the user experience toward the end of development helps every type of stakeholder precisely and collectively define what is ‘good enough’ to achieve the intended use.
It is useful for developers to remember performance assessment is not an end goal in itself; it is a process that defines how the system has reached its best state and whether that state is ready for deployment. The performance assessment process must include a broad range of stakeholders, including domain experts, who may need new tools to fulfill critical (sometimes unexpected) roles in the development and deployment of an AI system.
As AI becomes more deeply integrated into every aspect of our lives, it is essential that AI systems perform appropriately for their intended use. We know AI models can never be perfect, so how do we decide when AI performance is ‘good enough’ for use in a real life application? Is level of accuracy a sufficient gauge? What else matters? These are questions Microsoft Research tackles every day as part of our mission to follow a responsible, human-centered approach to building and deploying future-looking AI systems.
To answer the question, “what is good enough?”, it becomes necessary to distinguish between an AI model and an AI system as the unit of performance assessment. An AI model typically involves some input data, a pattern-matching algorithm, and an output classification. For example, a radiology scan of the patient’s chest might be shown to an AI model to predict whether a patient has COVID-19. An AI system, by contrast, would evaluate a broader range of information about the patient, beyond the COVID-19 prediction, to inform a clinical decision and treatment plan.
Research has shown that human-AI collaboration can increase the accuracy of AI models alone (reference). In this blog, we share key learnings from the recently retired Project Talia, the prior collaboration between Microsoft Research and SilverCloud Health to understand how thinking about the AI system as a whole—beyond the AI model—can help to more precisely define and enumerate ‘good enough’ for real-life application.
In Project Talia, we developed two AI models to predict treatment outcomes for patients receiving human-supported, internet-delivered cognitive behavioral treatment (iCBT) for symptoms of depression and anxiety. These AI models have the potential to assist the work practices of iCBT coaches. These iCBT coaches are practicing behavioral health professionals specifically trained to guide patients on the use of the treatment platform, recommend specific treatments, and help the patient work through identified difficulties.
Project Talia offers an illustration of the distinction between the AI model produced during research and a resulting AI system that could potentially get implemented to support real-life patient treatment. In this scenario, we demonstrate every system element that must be considered to ensure effective system outcomes, not just AI model outcomes.
Project Talia: Improving Mental Health Outcomes
SilverCloud Health (acquired by Amwell in 2021) is an evidence-based, digital, on-demand mental health platform that delivers iCBT-based programs to patients in combination with limited but regular contact from the iCBT coach. The platform offers more than thirty iCBT programs, predominantly for treating mild-to-moderate symptoms of depression, anxiety, and stress.
Patients work through the program(s) independently and with regular assistance from the iCBT coach, who provides guidance and encouragement through weekly reviews and feedback on the treatment journey.
Previous research (reference) has shown that involving a human coach within iCBT leads to more effective treatment outcomes for patients than unsupported interventions. Aiming to maximize the effects and outcomes of human support in this format, AI models were developed to dynamically predict the likelihood of a patient achieving a reliable improvement[1] in their depression and anxiety symptoms by the end of the treatment program (typically 8 to 14 weeks in length).
Existing literature on feedback-informed therapy (reference) and Project Talia research (reference) suggest that having access to these predictions could provide reassurance for those patients ‘on track’ toward achieving a positive outcome from treatment, or prompt iCBT coaches to make appropriate adjustments therein to better meet those patients’ needs.
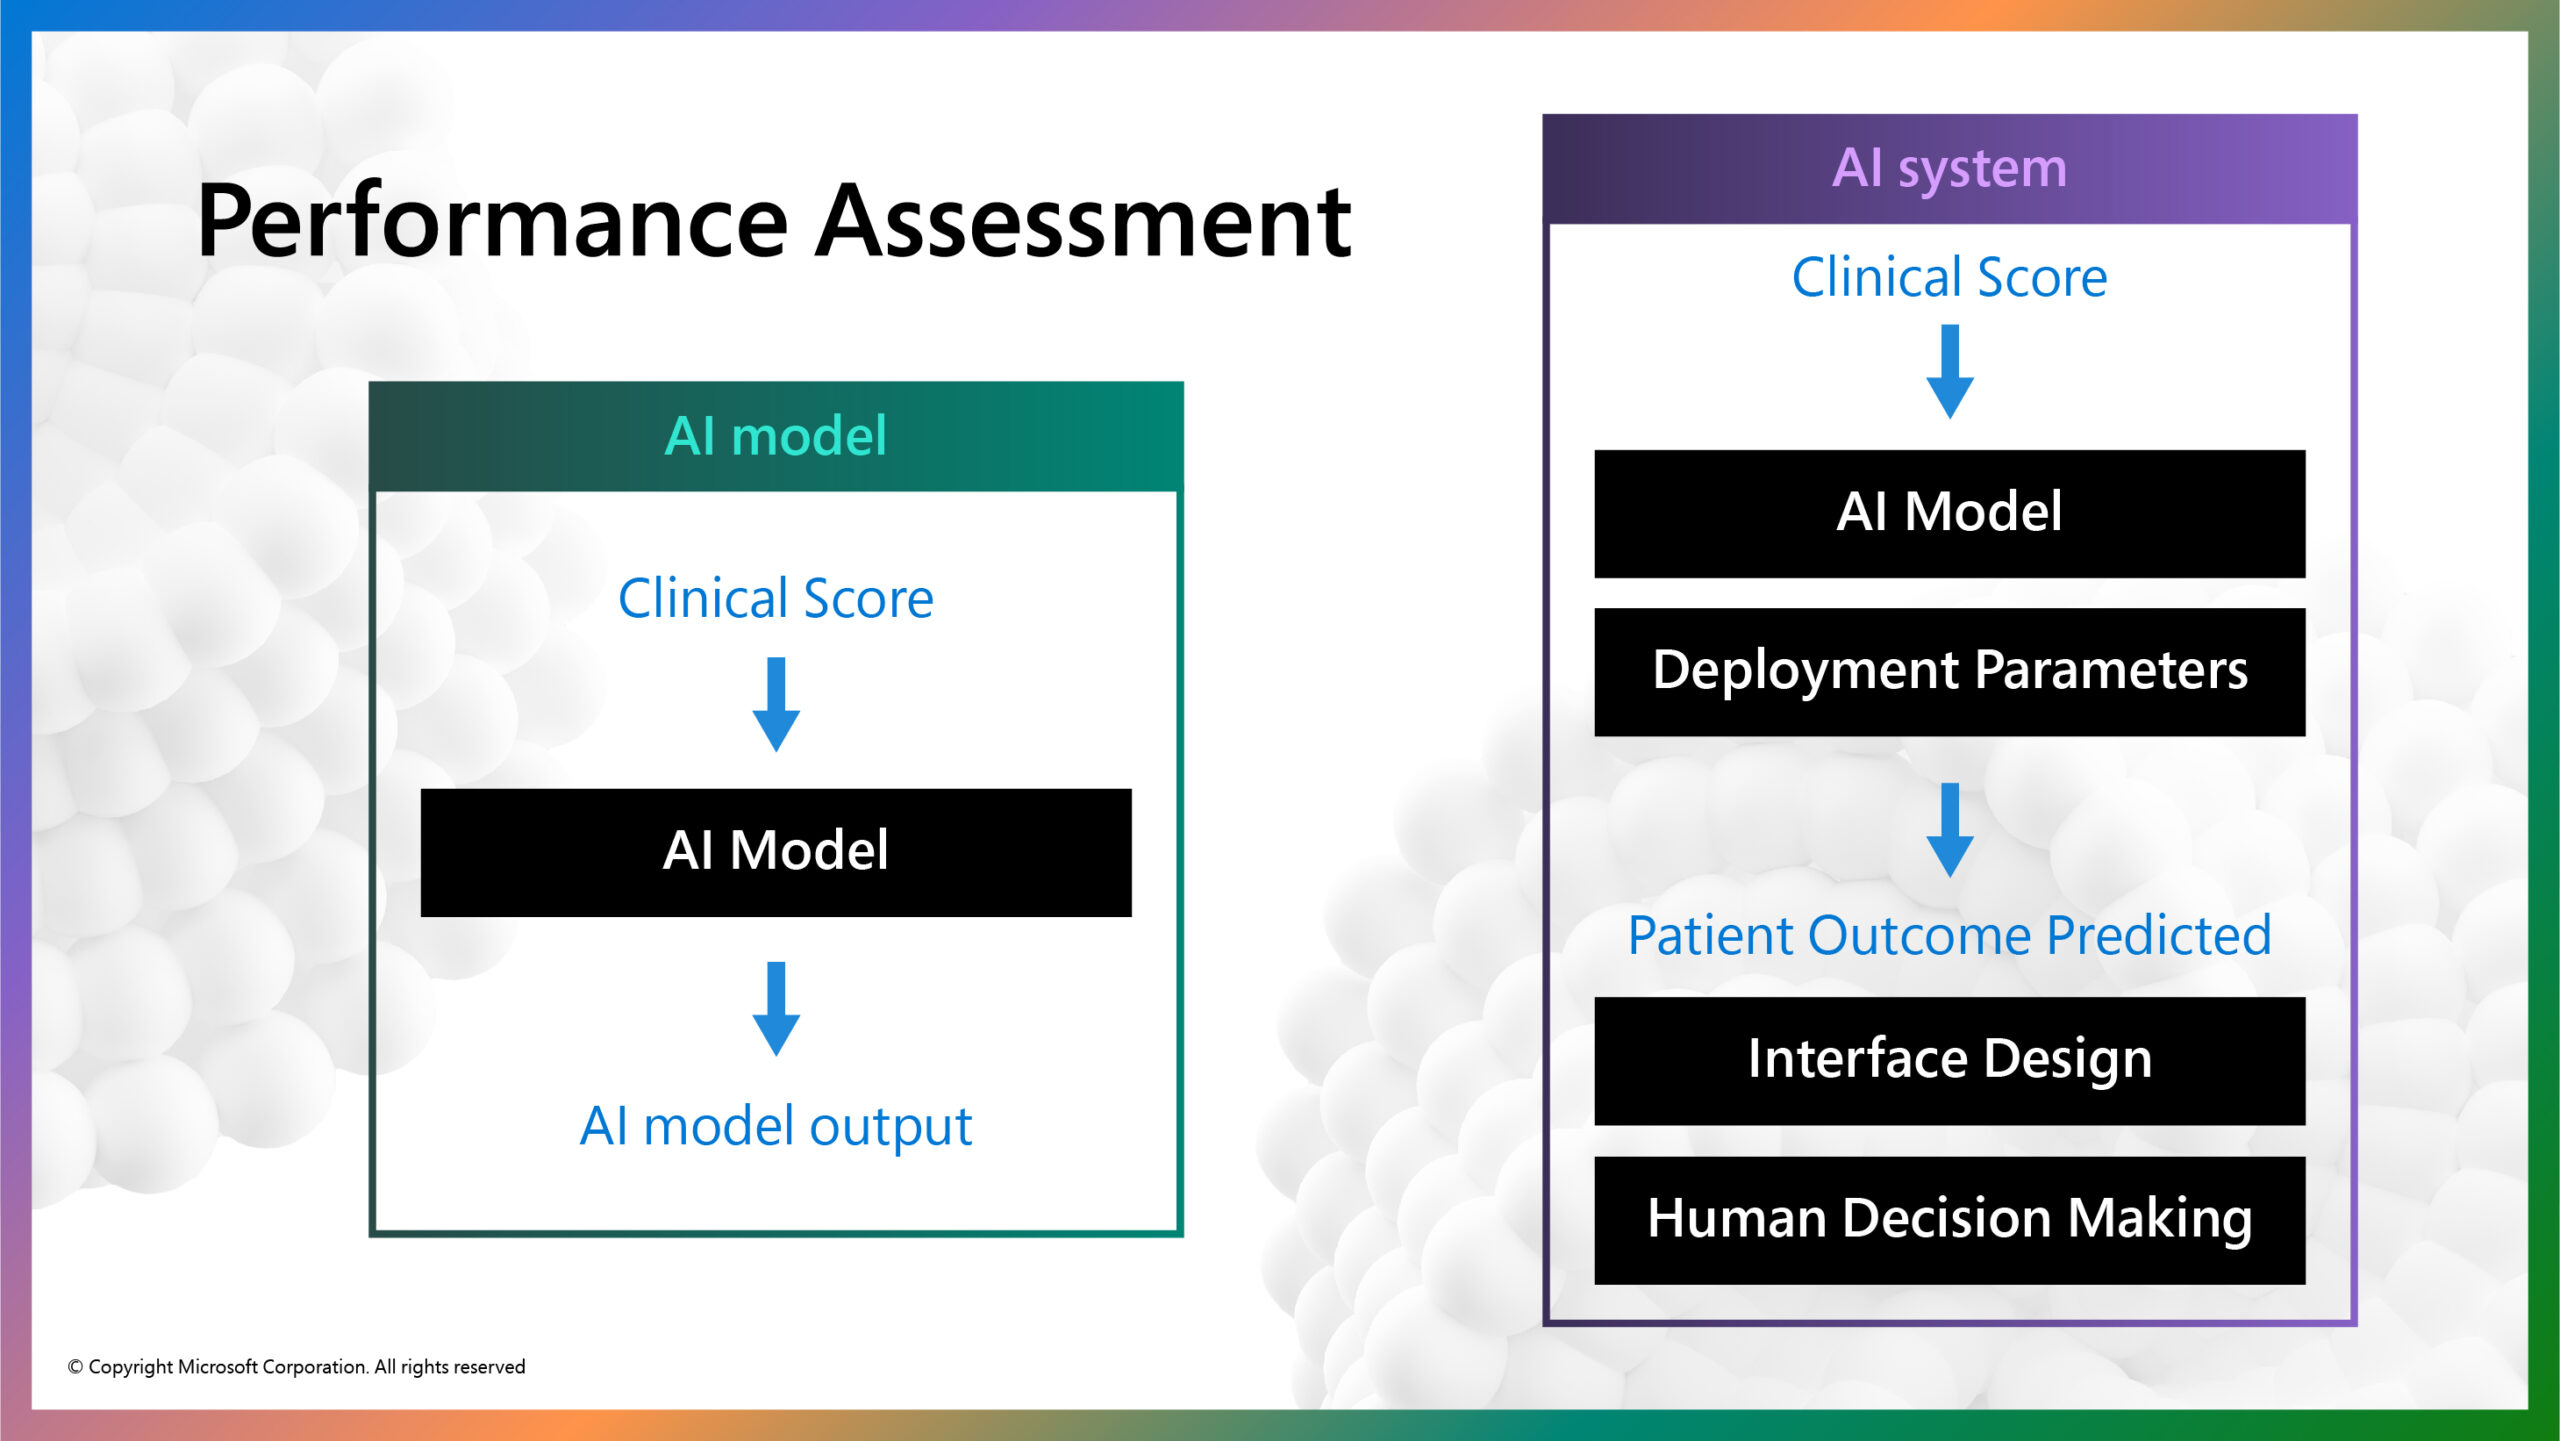
AI Model vs. AI System
Figure 1: Differentiating AI performance assessment on the level of AI model versus AI system.
The figure above illustrates the distinction between the AI model and AI system in this example (figure 1). The AI model takes in a clinical score calculated by a patient’s responses to standardized clinical questionnaires that assess symptoms of depression and anxiety at each treatment session. After three treatment sessions, the AI model predicts whether or not the patient will achieve a clinically significant reduction in mental health symptoms at completion of the treatment program. The AI model itself is trained on fully anonymized clinical scores of nearly 50,000 previous SilverCloud Health patients and achieved an acceptable accuracy of 87% (reference).
The outcome prediction could then be embedded into the clinical management interface that guides iCBT coaches in their efforts to make more informed decisions about that patient’s treatment journey (i.e., increase level and frequency of support from the coach).
When AI models are introduced into human contexts such as this, they rarely work in isolation. In this case, the clinical score is entered into a model with parameters tuned to a particular healthcare context. This example illustrates how AI model performance metrics are not sufficient to determine whether an AI system is ‘good enough’ for real-life application. We must examine challenges that arise throughout every element of the AI system.
Following are two specific examples of how AI system performance can be altered while retaining the same model: contextual model parameters and user interface and workflow integration.
Contextual Model Parameters: Which Error Type is Most Costly
Examining overall performance metrics exclusively can limit visibility into the different types of errors an AI model can make, which can have (potentially negative) implications on the AI system as a whole. For example, an AI model’s false positive and false negative errors can impact the AI system differently. A false positive error could mean a patient who needed extra help might not receive it; a false negative would mean a patient may receive unnecessary care. In this case, false positive errors would have a much bigger impact on a patient than false negative errors. But false negative errors can also be problematic when they cause unnecessary resource allocation.
Contextual model parameters can be tuned to change the balance between error types while maintaining the overall accuracy of the model. The clinical team could define these contextual model parameters to minimize false positive errors that could be more detrimental to patients, by specifying the model to produce only 5% false positives errors. Choosing this parameter could come, however, at the expense of a higher false negative rate, which would require monitoring how AI model performance might then impact service costs or staff burn-out.
This example illustrates the challenging decisions domain experts, who may know little about the details of AI, must make and the implications these decisions can have on AI system performance. In this example, we provided a prototype visualization tool to help the clinical team in their understanding of the implications of their choices across different patient groups.
We are moving into a world in which domain experts and business decision makers, who embed AI into their work practices, will bear increasing responsibility in assessing and debugging AI systems to improve quality, functionality, and relevance to their work.
User Interface and Workflow Integration
AI model predictions need to be contextualized for a given workflow. Research on iCBT coaches has shown that listing the predictions for all patients of a coach in a single screen outside the normal patient-centered workflow can be demotivating (reference). If a coach saw that the majority of their patients were predicted to not improve, or if their patients’ outcomes were predicted to be worse for than those of their colleagues, this could lead coaches to question their own competence or invite competitive thoughts about their colleagues’ performances—both unhelpful in this context.
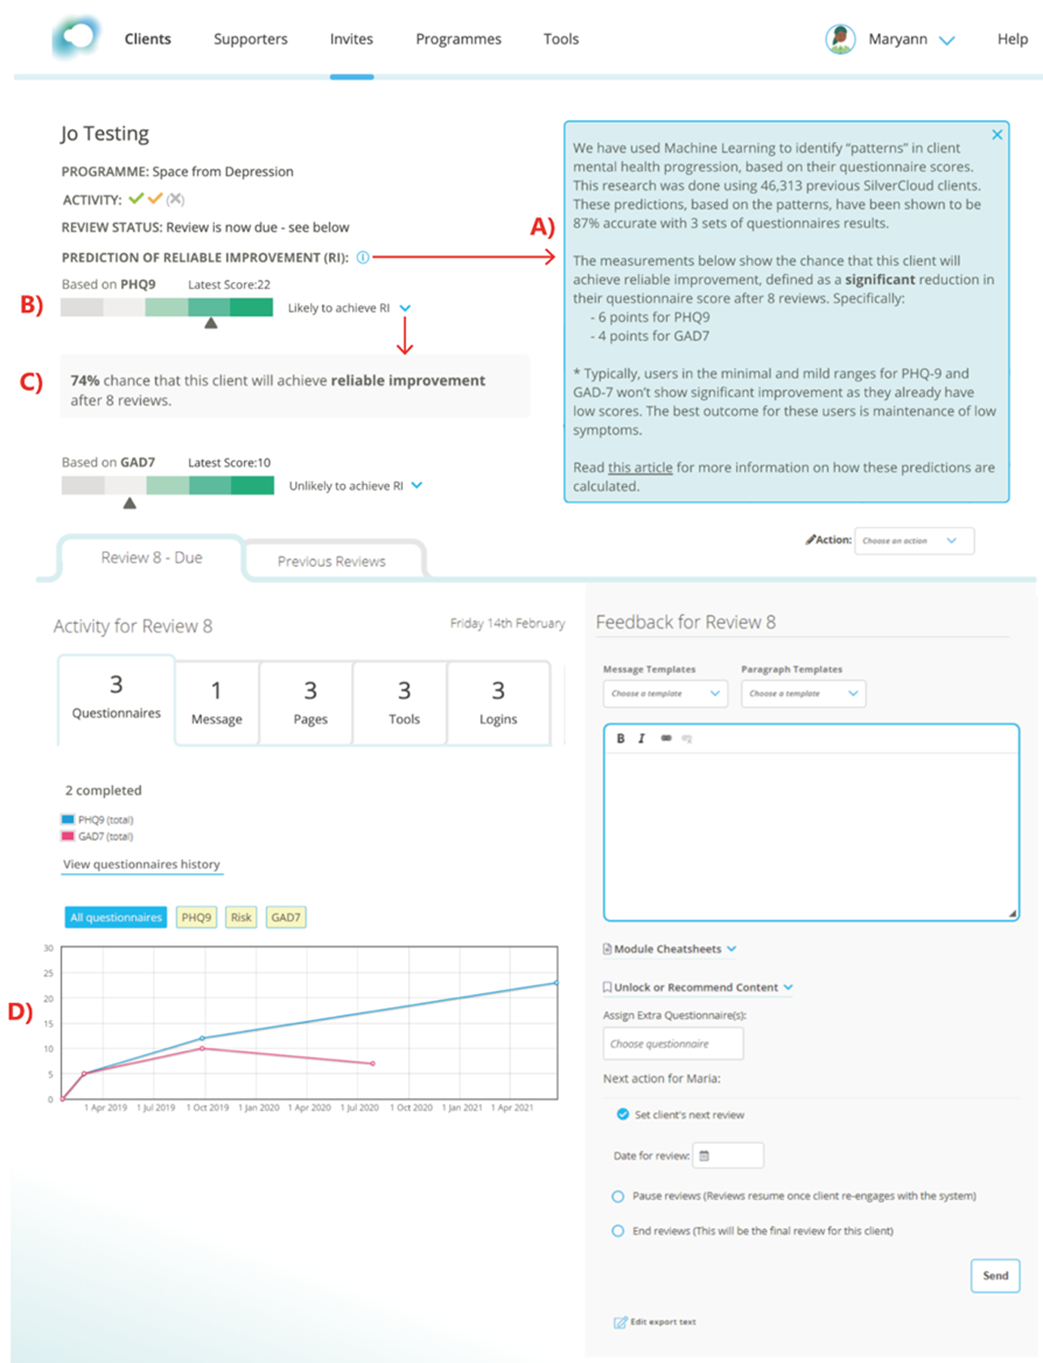
Displaying the AI model prediction inside the individual patient’s profile, as in the illustration below (figure 2), provides a useful indicator of how well the person is doing and therefore can guide clinical practice. It also deliberately encourages the use of the AI model prediction within the context of other relevant clinical information.
Situating the AI output with other patient information can nurture a more balanced relationship between AI-generated insight and coaches’ own patient assessments, which can counterbalance effects of over-reliance and over-trust in potentially fallible AI predictions (also referred to as automation bias).
Figure 2: User interface for clinical coaches that shows the integration of treatment outcome prediction (here defined as reliable improvement) within the patient status. It shows: A) a general explanation of the prediction; B) visual charts with a text label to convey the prediction results for depression and anxiety symptoms (via PHQ-9 and GAD-7 clinical scores); C) drop-down menus for numerical percentages of the prediction; and D) other contextual information about the patient that are considered in their review, including their clinical score trajectories over time.
This example illustrates the importance of user interface design and workflow integration in how well AI model predictions are understood and can contribute to the success or failure of an AI system as a whole. Domain experts, user research, and service designers start to play a far more important role in the development of AI systems than the typical focus on data scientists.
Final Thoughts
Aggregate performance metrics, such as accuracy, area-under-the-curve (AUC) scores, or mean square error, are easy to calculate on an AI model, but they indicate little about the utility or function of the entire AI system in practice. So, how do we decide when AI system performance is ‘good enough’ for use in real-life application? It is clear that high levels of AI model performance alone are not sufficient—we must consider every element of the AI system.
Contextual model parameters and interface and workflow design present just two examples of how preparing domain experts with expectations, skills, and tools are necessary for optimal benefit from the incorporation of AI systems into human contexts.
[1] Defined as an improvement of 6 or more points on the PHQ-9 depression scale, or 4 or more points on the Gad-7 anxiety scale.


 -based 3D telemedicine system to increase access to healthcare