Technique that relies on inverse reinforcement learning, or learning by example, improves task completion rate by 14% to 17% in simulations.Read More
Startup Couples AI with OR Video to Sharpen Surgeon Performance, Improve Patient Outcomes
AI is teaching cars to make better decisions, so could it do the same for surgeons?
Addressing that question is the mission of Theator, a startup based in Palo Alto, Calif., with an R&D site in Tel Aviv, that’s striving to fuel the nascent revolution in autonomous surgery.
Theator co-founder and Chief Technology Officer Dotan Asselmann said his company has been monitoring advances in self-driving cars as a blueprint for surgery, with a focus on using AI-driven analytics to improve decision-making.
Just as autonomous carmakers want to stop a vehicle before an accident, Theator wants to stop surgeries before any mistakes. And it’s doing this by analyzing video taken of surgeries being performed all over the world.
“Because it can scale, AI can acquire much more experience than any surgeon,” said Asselmann. “Our model has already analyzed thousands of surgeries that one individual physician would never have time to experience themselves.”
Turning Video Into Shared Knowledge
The problem Asselmann and the Theator team have identified is a lack of standardization in the surgical review process. Most surgeons learn their craft from just a few people. In fact, Asselmann said, many pick up the majority of their knowledge from their own experiences.
“Horizontal data sharing between surgeons has been limited — it’s mainly happened at conferences,” he said. “In today’s COVID reality, surgeons’ ability to expand their knowledge at scale is stifled.”
However, while the practice of conducting visually aided surgery has taken off and most operating rooms have been equipped with cameras that record procedures, surgeries are not routinely captured, stored or analyzed. This is what spurred Theator’s inception and has fueled its ongoing mission to harness AI and computer vision to power surgery.
The company’s technology is delivered through an edge appliance mounted on an operating room’s laparoscopic cart. From there, the NVIDIA Jetson AGX Xavier platform processes the videos, and Theator’s software anonymizes and then uploads them to its training environments in the Amazon and Azure clouds.
There, the company runs a variety of AI models, with training occurring on a cluster of NVIDIA V100 Tensor Core GPUs, while NVIDIA T4 Tensor Core GPUs handle inference.
 Once a video of a surgery has been processed, surgeons can immediately view highlight packages that focus on the select critical minutes where important decisions were made. Each procedure is added to Theator’s training dataset, thus expanding its models’ understanding.
By applying AI-driven analytics to the videos, Theator’s platform deconstructs the resulting data into steps, events, decisions and milestones. This allows surgeons to conduct post-surgery reviews, where they can compare parts of the procedure with previous identical procedures.
The platform can also use previous procedures to provide pre-operative assistance, and it can match videos to identify the cause of post-surgical complications. Future applications include the ability to predict, and potentially reduce, the need for costly and time-consuming interventions resulting from complications.
For example, a patient who develops a post-operative fever may have a bleed that has been left open. In the future, watching a Theator video summary could help a surgeon determine whether there was a problem before performing a scan or corrective procedure.
Ensuring Better Surgical Decisions
Asselmann believes that Theator can remove the cloud component from the equation and achieve the holy grail of real-time surgical support within a year or two – relying solely on its AI algorithms to conduct entire analytics processes on premises during minimally invasive surgery.
While the company’s focus is currently on aiding surgeons, he expects semi-autonomous surgery to be possible within the next five years. And while there will likely always be a surgeon in the loop, Asselmann believes level 3 or 4 automation for surgery will be utilized first and foremost in developing countries, where 5 billion people lack access to adequate surgical care.
Theator has reached this far with the help of NVIDIA Inception, an accelerator program for startups in the AI and data science fields. Asselmann credits the program with helping “increase our model training efficiency and reduce compute costs, while guiding the selection of the right hardware for our edge device.”
Through the NVIDIA Inception program, Theator was also provided a private demonstration of the NVIDIA Clara Guardian AI healthcare framework, as well as the NVIDIA DeepStream software development kit, which the startup used to build its high-efficiency real-time video pipeline.
Equipped with NVIDIA’s support, Theator can continue to bring critical context to the decisions surgeons are making every day in operating rooms all over the world.
“Surgeons are inundated with endless parameters flowing from multiple directions during surgery,” said Asselmann. “Our objective is to reduce the cognitive overload and aid them in making the optimal decision at the right time, for the right patient and circumstances.”
“You’ll still call the shots,” he says, “but you’ll be a much better surgeon with AI.”
Feature image credit: David Mark.
The post Startup Couples AI with OR Video to Sharpen Surgeon Performance, Improve Patient Outcomes appeared first on The Official NVIDIA Blog.
Alexa & Friends features Kayoko Yanagisawa, Alexa AI senior speech scientist
Yanagisawa discusses the science behind Alexa’s new bilingual Polyglot model, her career in speech research, and more.Read More
Alchemy: A structured task distribution for meta-reinforcement learning
There has been rapidly growing interest in developing methods for meta-learning within deep RL. Although there has been substantive progress toward such ‘meta-reinforcement learning,’ research in this area has been held back by a shortage of benchmark tasks. In the present work, we aim to ease this problem by introducing (and open-sourcing) Alchemy, a useful new benchmark environment for meta-RL, along with a suite of analysis tools.Read More
What precautions do people take for COVID-19?
To prevent the spread of COVID-19, people have been encouraged to adopt preventative measures such as hand-washing and mask-wearing. Through a survey of over 200,000 Facebook users in 26 countries conducted on Facebook between May and October 2020, we examined how the adoption of such precautions has ebbed and flowed over time, and how precaution-taking relates to both offline activity (e.g., seeing people in person) and online activity (e.g., viewing COVID-19-related content on Facebook).
In this survey, we asked about whether people adopted any of seven precautions:
- Washing hands or using hand sanitizer
- Using a face mask
- Avoiding crowded places
- Practicing social distancing
- Avoiding public locations
- Not leaving home except for essentials
- Not leaving home at all
Precaution-taking
How common were different precautions?
From May through October 2020, hand-washing and mask-wearing were the two most common precautions that people took worldwide. Of the people we surveyed, 73 percent reported washing their hands or using hand sanitizer, and 72 percent reported wearing a face mask.

Figure 1: Hand-washing and mask-wearing were the most commonly reported precautions that people took between May and October 2020 because of the COVID-19 pandemic. Country flags indicate prevalence in the respective countries (Taiwan, Peru, and the United States).
Figure 1 also shows how these overall rates compare with those of three countries: Taiwan (0.29 deaths per million as of early October 2020), the United States (640 deaths per million, and Peru (1,000 deaths per million). While people in Taiwan reported lower rates of following all precautions, people in Peru reported the highest rates of the more restrictive precautions (such as not leaving home at all).
How did precaution-taking change over time?
Despite the COVID-19 case rate rising and the death rate holding relatively steady from May to October 2020, likely through a combination of improved testing and treatment, people took fewer precautions over the same time period (Figure 2). In May 2020, three in five people reported avoiding public locations; by October 2020, only two in five people did.

Figure 2: Globally, between May and October 2020, people were less likely to take precautions over time.
Precaution-taking decreased over time. For all precautions surveyed except for mask-wearing, the proportion of respondents who reported taking them decreased over the period of the study. Mask-wearing increased between May and September 2020 but decreased in October 2020. In the United States, there were significant decreases in people washing their hands, avoiding crowded places, avoiding public locations, and not leaving home except for essentials.
Women took more precautions than men (Figure 4). This aligns with recent research that women were more likely to perceive COVID-19 as a serious problem and to adopt preventive measures.

Figure 3: Women took more COVID-19-related precautions than men.
Age differences. Older adults took more precautions, primarily in hand-washing and social distancing (Figure 4), while 18- to 30-year-olds were most likely to not take any precautions at all. These trends are largely consistent with the increase in risk of getting COVID-19 as one gets older (e.g., the case fatality rate is about 10 times higher for those above 60 than it is for those under 40).

Figure 4: Older adults took more precautions than younger adults.
How did precaution-taking vary by country?
Precaution-taking differed substantially by country. Not only were there large differences across countries in measures taken, such as mask-wearing and social distancing, but depending on the country, related precautions (e.g., mask-wearing vs. social distancing) were adopted at vastly differing rates.
Differences in mask-wearing (Figure 5). A majority of Americans wear masks: On average, three out of four people reported wearing a mask as a precaution. People in Japan were most likely to wear masks (87 percent), while Swedes were least likely to wear masks (7 percent), likely because Sweden’s public health authorities discouraged people from wearing masks. And though only 68 percent of people in Taiwan reported wearing a mask, Taiwan has one of the lowest death rates in the world, likely because of the successful countermeasures taken from the beginning of the pandemic.

Figure 5: Almost nine in 10 people in Japan reported wearing a mask as a preventive measure, while fewer than one in 10 people in Sweden reported wearing a mask.
The relatively high compliance in the United States is notable, despite poor guidance from the federal government during the time. Mask-wearing was highest in Maryland (93 percent) and lowest in Tennessee (58 percent) (Figure 6). These largely correspond to whether states had instituted a mask-wearing mandate. For example, Tennessee’s governor did not support a mask mandate. These findings on mask-wearing largely mirror existing surveys (e.g., by YouGov). Still, even higher rates of mask-wearing may be necessary to substantially reduce the spread of COVID-19, as described in a recent CMU blog post.

Figure 6: Between May and October 2020, in the United States, mask-wearing was highest in Maryland (MD) and lowest in Tennessee (TN). Grayed-out states had fewer than 50 responses.
Social distancing. People in Canada, the United Kingdom, and the United States reported some of the highest rates of social distancing in the world (Figure 7). Notably, 70 percent of Swedes reported social distancing, despite only 7 percent wearing masks. Like the mask-wearing rate, the social distancing rate was lower in Taiwan (27 percent), likely reflecting the already-low prevalence of COVID-19.

Figure 7: People in Canada, the United Kingdom, and the United States reported some of the highest rates of social distancing. In contrast with Swedes’ low rate of mask-wearing, they reported a relatively high rate of social distancing.
Precaution-taking was correlated with the deadliness of the disease. People reported being more cautious when the risk of dying from COVID-19 was higher. In countries with more COVID-19 deaths per million, people were more likely to take one or more precautions, and this trend was strongest for social distancing in particular (Figure 8).

Figure 8: Social distancing was correlated with the death rate in each country.
Surprising differences. While one may expect the adoption of different precautions to be largely correlated with each other, there were some countries where some precautions were relatively more prevalent than others:
- Sweden: Sweden had high rates of hand-washing (81 percent) and social distancing (71 percent), but it had low rates of mask-wearing (7 percent), staying at home except for essentials (30 percent), and the avoidance of public locations (34 percent).
- Japan: Other than for mask-wearing (88 percent), Japan had a comparatively low rate of following most other precautions (e.g., 36 percent avoided public locations).
- Italy: While Italy had a relatively higher rate of mask-wearing (83 percent), people were less likely to stay home (33 percent) and less likely to avoid public locations (26 percent).

Figure 9: There are substantial differences in how common different preventive measures are, both within and across countries. Blue indicates relatively higher prevalence of a precaution in a country compared with other countries, while red indicates relatively lower prevalence.
Why do these country differences exist? Multiple factors play a role: the death rate, perceptions of risk, preexisting norms (e.g., Japan’s culture of mask-wearing), and differences in government directives (e.g., Sweden discouraged mask-wearing). Other factors such as population density (e.g., it may be harder to avoid crowds in cities) also likely play a role.
Precaution-taking, social interactions, and feeling better
In the previous section, we described how precaution-taking varied by the type of precaution, a person’s age and gender, and the country that they live in. In this section, we explore how precaution-taking related to whether people saw others in person, and how it related to generally feeling better or feeling worse.
Was precaution-taking associated with seeing more people in person?
COVID-19 is a communicable disease, so many precautions are aimed at reducing the risk of person-to-person transmission. As Figure 10 shows, people who adopted “protective” measures (e.g., mask-wearing and hand-washing) reported having interacted with more people offline outside of their homes, while those who adopted “isolating” measures (e.g., staying home) reported having interacted with fewer people offline.

Figure 10: People who adopted more “protective” measures (e.g., hand-washing) had more offline interactions; people who adopted more “isolating” measures (e.g., not leaving home) had fewer offline interactions. Error bars represent 95 percent confidence intervals; darker bars indicate statistically significant associations (p < 0.05).
Does taking more precautions lead to more offline interactions (or vice versa)? On one hand, some researchers have hypothesized that precautions such as mask-wearing may give people a false sense of security, leading them to become less careful in their interactions with others (e.g., how often a person interacts with others outside their household). On the other hand, people with more offline interactions likely have a stronger incentive to adopt “protective” precautions.
Our findings show little evidence of the former. When we examined the extent to which precaution-taking in the past was correlated with future offline interactions, we found that taking more precautions was associated with a small subsequent increase in offline interactions in Spain and a decrease in offline interactions in Indonesia and the Philippines. Additionally, in Canada and Japan, having more offline interactions was associated with subsequent decreases in the number of precautions people took. More research is necessary to understand and verify these observations.
Was precaution-taking associated with feeling better or feeling worse?
Some studies have warned that “quarantine and social distancing […] lead to elevated levels of loneliness and social isolation.” Past research found that loneliness is associated with negative affect, so we expected largely similar findings with respect to precaution-taking. However, this was not the case.
People who took precautions reported feeling better. To understand whether people felt better or worse, the survey included a question about the extent to which a person “felt good most of the time” and a question about the extent to which they “felt bad most of the time.” People who reported taking precautions were more likely to feel good most of the time (Figure 11) and less likely to feel bad most of the time (not shown). Only in the extreme case of not leaving home at all did people report feeling worse.
Why might people who take precautions feel better? They may feel safer from taking these precautions or feel better from actively playing a role in their community to stem the spread of the disease. Taking “protective” precautions such as mask-wearing may also have allowed people to better maintain social connections with each other and thus feel more supported.

Figure 11: Precaution-taking is generally associated with feeling better.
Precaution-taking and Facebook
In this section, we show how seeing COVID-19-related content on Facebook may be related to precaution-taking, and how precaution-taking may be related to use of the “care” reaction.
Was viewing COVID-19-related content on Facebook associated with precaution-taking?
People who saw more COVID-19-related content on Facebook were more likely to take one or more precautions. After adjusting for differences in demographics and on-Facebook activity (e.g., the total number of posts that a person saw), we found a significant association between the proportion of COVID-19-related content seen and whether any precautionary measures were taken. On one hand, people who see more COVID-19-related content may end up becoming more informed and thus take more precautions; on the other hand, people who are more concerned about COVID-19 may also be the people who follow and view more COVID-19-related content.
Which precautions were associated with viewing more COVID-19-related content? People who viewed proportionally more COVID-19-related content were more likely to wear a mask (Figure 12). They were less likely to not leave their homes at all.

Figure 12. People who viewed proportionally more COVID-19-related content were more likely to also report wearing a face mask or washing their hands.
Was precaution-taking associated with using the “care” reaction?
Mask-wearing was associated with using the “care” reaction more. One commonly emphasized benefit of mask-wearing is that it protects others from being infected by the wearer. This benefit is largely different from many of the other precautionary measures, where the perceived benefit accrues largely to oneself. As such, mask-wearing may be more strongly associated with caring for others compared with other precautionary measures. To understand if this may be the case, we examined how people used the “care” reaction, which typically indicates support or care for others.
In regression analyses, mask-wearing was associated with proportionally greater use of the “care” reaction (Figure 13). This corroborates prior work that indicated that antisocial traits such as a lack of empathy and risk-taking were associated with a lower likelihood of mask-wearing or social distancing. While there were also significant associations with respect to not leaving home or avoiding crowded places, follow-up analyses indicate that these were because mask-wearing was correlated with both.

Figure 13. Mask-wearing was associated with using the “care” reaction more, suggesting a link between mask-wearing and empathy.
Conclusion
In summary, from May through October 2020, people took fewer preventive measures against COVID-19. Across 26 countries, including the United States, hand-washing and mask-wearing were the two most common preventive measures. Women adopted more precautions than men, and older adults adopted more precautions than younger adults.
Still, there were differences in how often precautions were taken in different countries. While Japan had the highest rate of mask-wearing (88 percent), social distancing was far less prevalent (39 percent). Conversely, Sweden had the lowest rate of mask-wearing (7 percent), but social-distancing was more common (71 percent).
And while some precautions were associated with seeing more people in person (e.g., wearing masks), others were not (e.g., avoiding public locations). Precaution-taking was also associated with feeling better.
Additionally, people who saw more COVID-19-related content on Facebook were also more likely to take one or more precautions. Mask-wearing was also associated with using the “care” reaction more, so people who wear masks may tend to be more supportive of others.
We hope that these findings begin to shed light on the relationship between COVID-19, the precautions that people take, and the online and offline interactions that people have. For more information about what Facebook is doing to keep people safe and informed about the coronavirus, read the latest updates on Newsroom.
The post What precautions do people take for COVID-19? appeared first on Facebook Research.
Amazon DevOps Guru is powered by pre-trained ML models that encode operational excellence
On December 1, 2020, we announced the preview of Amazon DevOps Guru, a machine learning (ML)-powered service that gives operators of cloud-based applications a simpler way to measure and improve an application’s operational performance and availability to reduce expensive downtime.
Amazon DevOps Guru is a turn-key solution that helps operators by automatically ingesting operational data for analysis and predictively identifying operationally relevant issues. Although DevOps Guru uses ML models that are informed by years of operational expertise in building, scaling, and maintaining highly available applications at Amazon.com, it doesn’t require any ML experience.
Amazon DevOps Guru automatically identifies most common behaviors of applications that correspond to operational incidents. When it identifies a critical issue, it alerts service operators with a summary of related anomalies, the likely root cause, and context on when and where the issue occurred. When possible, it also provides prescriptive recommendations on how to remediate the issue. In this post, we shed light on some of the ML approaches that power DevOps Guru.
DevOps Guru detectors
At the core of Amazon DevOps Guru is a unique approach to identify meaningful operational incidents. At the start of our research for DevOps Guru, we focused on domain-agnostic, general-purpose anomaly detection models. Though they gave statistically correct results, these models couldn’t always identify or distinguish critical failures from interesting but not critical issues. Over time, we learned that failure patterns differ considerably from metric to metric. For example, a common use case of DevOps Guru is running highly available, low-latency web applications, where an operator may be interested in monitoring both application latency and the number of incoming requests. However, failure patterns in these two metrics differ substantially, making generic statistical anomaly detection models to address both scenarios unlikely to succeed. As a result, we changed our approach radically. After consulting with domain experts to identify known anomaly types across a variety of metrics and services, we set out to built domain-specific, single-purpose models to identify these known failure modes instead of normal metric behavior.
Fast-forward to now, Amazon DevOps Guru relies on a large ensemble of detectors—statistical models tuned to detect common adverse scenarios in a variety of operational metrics. DevOps Guru detectors don’t need to be trained or configured. They work instantly as long as enough history is available, saving days if not months of time that would otherwise be spent training ML models prior to anomaly generation. Individual detectors work in preconfigured ensembles to generate anomalies on some of the most important metrics operators monitor: error rates, availability, latency, incoming request rates, CPU, memory, and disk utilization, among others.
Detectors codify experts’ understanding of operational anomalies as closely as possible, in both determining anomalous patterns as well as establishing bounds for normal application behavior. Both detectors, and the ensembles that compose them into full models, were trained and tuned on Amazon’s data based on years of operational experience at Amazon.com and AWS. Next, we dive into some of the capabilities of DevOps Guru detectors.
Monitoring resource metrics with finite bounds
The purpose of this detector is to monitor finite resource metrics such as disk utilization. It utilizes a digital filter to detect long-running trends in metric data in a highly scalable and compute-effective manner. The detector notifies operators when these trends point to impending resource exhaustion. The following graph shows an illustrative example.

This detector identified a significant trend in disk usage, heading for disk exhaustion within 24 hours. The model has identified a significant trend between the vertical dashed lines. Extrapolating this trend (diagonal dashed line), the detector predicts time to resource exhaustion. As the metric breaches the horizontal red line, which acts as a significance threshold, the detector notifies operators.
Detecting scenarios with periodicity
Many metrics, such as the number of incoming requests in customer-facing APIs, exhibit periodic behavior. The purpose of the causal convolution detector is to analyze temporal data with such patterns and to determine expected periodic behavior. When the detector infers that a metric is periodic, it adapts normal metric behavior thresholds to the seasonal pattern (as in the following graph). On a selected group of metrics, Amazon DevOps Guru can also identify and filter periodic spiking behavior, such as regular batch jobs producing high database load. In the following graph, we only see one detector active for better visualization—in reality, the causal convolution detector tracks the seasonal metric closely, whereas a further dynamic threshold detector detects catastrophic changes if breached.
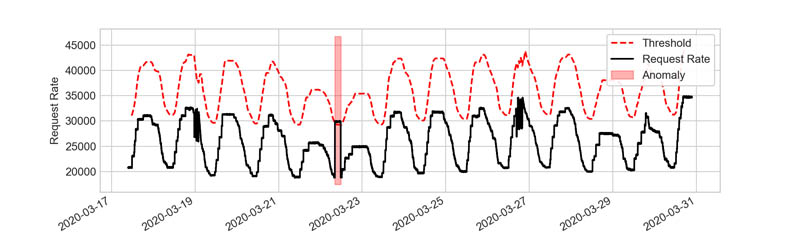
The causal convolution detector sets bounds for application behavior in line with daily application load patterns. By tracking the seasonality, it allows catching spikes relative to the weekend, which traditional approaches, based on static threshold lines, only catch at the expense of many false positives.
DevOps Guru insights
Instead of providing just a list of anomalies that an ensemble of detectors find, DevOps Guru generates operational insights that aggregate relevant information needed to investigate and remediate an operational issue. Amazon DevOps Guru leverages anomaly metadata to identify related anomalies and potential root causes. Based on metadata, related anomalies are grouped together based on their temporal proximity, shared resources, and a large graph of potential causal links between anomaly types.
DevOps Guru presents insights with the following:
- Graphs and timelines related to the numerous anomalous metrics
- Contextual information such as relevant events and log snippets for easily understanding the anomaly scope
- Recommendations to remediate the issue
The following screenshot illustrates an example insight detail page from DevOps Guru, which shows a collection of related metrics’ anomalies in a timeline view.

Conclusion
Amazon DevOps Guru saves IT operators hours if not days of time and effort spent detecting, debugging, and resolving operational issues. Because it uses pre-trained proprietary ML models informed by years of operational experience at Amazon.com and AWS in managing highly available services, IT operators can receive the same high-quality insights without having any ML experience. Start using DevOps Guru today.
Acknowledgments: The authors would like to acknowledge the contributions of Jan Gasthaus, Valentin Flunkert, Syama Rangapuram, Lorenzo Stella, Konstantinos Benidis and Francois Aubet to the algorithms and models presented in this blog post.
About the Authors
 Caner Türkmen is a Machine Learning Scientist at Amazon Web Services, where he works on problems at the intersection of machine learning, forecasting, and anomaly detection. Before joining AWS, he worked in the management consulting industry as a data scientist, serving the financial services and telecommunications industries on projects across the globe. Caner’s personal research interests span a range of topics including probabilistic and Bayesian ML, stochastic processes, and their practical applications.
 Ravi Turlapati leads product efforts at AWS. Ravi joined AWS more than three years ago, and has launched multiple products from scratch including AWS Data Exchange and Amazon DevOps Guru. In his latest role at AWS AI group, Ravi aims to deliver easy to use ML-based products that solve complex challenges for customers. Ravi is passionate about social causes and supports any charity that creates a self sustaining environment for those in need.
 Tim Januschowski is a Machine Learning Science Manager in Amazon’s AWS AI Labs. He has broad interests in machine learning with a particular focus on machine learning for business problems and decision making. At Amazon, he has produced end-to-end solutions for a wide variety of problems, from forecasting, to anomaly detection and personalization in application areas such as retail, operations and energy. Tim’s interests in applying machine learning span applications, system, algorithm and modeling aspects and the downstream mathematical programming problems. He studied Mathematics at TU Berlin, IMPA, Rio de Janeiro, and Zuse-Institute Berlin and holds a PhD from University College Cork.
TracIn — A Simple Method to Estimate Training Data Influence
Posted by Frederick Liu and Garima Pruthi, Software Engineers, Google Research
The quality of a machine learning (ML) model’s training data can have a significant impact on its performance. One measure of data quality is the notion of influence, i.e., the degree to which a given training example affects the model and its predictive performance. And while influence is a well-known concept to ML researchers, the complexity behind deep learning models, coupled with their growing size, features and datasets, have made the quantification of influence difficult.
A few methods have been proposed recently to quantify influence. Some rely on changes in accuracy when retraining with one or several data points dropped, and some use established statistical methods, e.g., influence functions that estimate the impact of perturbing input points or representer methods that decompose a prediction into an importance weighted combination of training examples. Still other approaches require use of additional estimators, such as data valuation using reinforcement learning. Though these approaches are theoretically sound, their use in products has been limited by the resources needed to run them at scale or the additional burdens they place on training.
In “Estimating Training Data Influence by Tracing Gradient Descent”, published as a spotlight paper at NeurIPS 2020, we proposed TracIn, a simple scalable approach to tackle this challenge. The idea behind TracIn is straightforward — trace the training process to capture changes in prediction as individual training examples are visited. TracIn is effective in finding mislabeled examples and outliers from a variety of datasets, and is useful in explaining predictions in terms of training examples (as opposed to features) by assigning an influence score to each training example.
The Ideas Underlying TracIn
Deep learning algorithms are typically trained using an algorithm called stochastic gradient descent (SGD), or a variant of it. SGD operates by making multiple passes over the data and making modifications to the model parameters that locally reduce the loss (i.e., the model’s objective) with each pass. An example of this is demonstrated for an image classification task in the figure below, where the model’s task is to predict the subject of the test image on the left (“zucchini”). As the model progresses through training, it is exposed to various training examples that affect the loss on the test image, where the loss is a function both of the prediction score and the actual label — the higher the prediction score for zucchini, the lower the loss.
 |
| Estimating training data influence of the images on the right by tracing the loss change of the zucchini in the seatbelt image during training. |
Suppose that the test example is known at training time and that the training process visited each training example one at a time. During the training, visiting a specific training example would change the model’s parameters, and that change would then modify the prediction/loss on the test example. If one could trace the training example through the process, then the change in loss or prediction on the test example could be attributed to the training example in question, where the influence of a training example would be the cumulative attribution across visits to the training example.
There are two types of relevant training examples. Those that reduce loss, like the images of zucchinis above, are called proponents, while those that increase loss, like the images of seatbelts, are called opponents. In the example above, the image labeled “sunglasses” is also a proponent, because it has a seatbelt in the image, but is labeled as “sunglasses,” driving the model to better distinguish between zucchini and seatbelts.
In practice, the test example is unknown at training time, a limitation that can be overcome by using the checkpoints output by the learning algorithm as a sketch of the training process. Another challenge is that the learning algorithm typically visits several points at once, not individually, which requires a method to disentangle the relative contributions of each training example. This can be done by applying pointwise loss gradients. Together, these two strategies capture the TracIn method, which can be reduced to the simple form of the dot product of loss gradients of the test and training examples, weighted by the learning rate, and summed across checkpoints.
 |
| The simple expression for TracIn influence. The dot product of loss gradients of training example (z) and test example (z’) is weighted by learning rate (ηi) at different checkpoints and summed up. |
Alternatively, one could instead examine the influence on the prediction score, which would be useful if the test example has no label. This form simply requires the substitution of the loss gradient at the test example with the prediction gradient.
Computing Top Influence Examples
We illustrate the utility of TracIn by first calculating the loss gradient vector for some training data and a test example for a specific classification — an image of a chameleon — and then leveraging a standard k-nearest neighbors library to retrieve the top proponents and opponents. The top opponents indicate the chameleon’s ability to blend in! For comparison, we also show the k nearest neighbors with embeddings from the penultimate layer. Proponents are images that are not only similar, but also belong to the same class, and opponents are similar images but in a different class. Note that there isn’t an explicit enforcement on whether proponents or opponents belong to the same class.
 |
| Top row: Top proponents and opponents of influence vectors. Bottom row: Most similar and dissimilar examples of embedding vectors from the penultimate layer. |
Clustering
The simplistic breakdown of the loss of the test example into training example influences given by TracIn also suggests that the loss (or prediction) from any gradient descent based neural model can be expressed as a sum of similarities in the space of gradients. Recent work has demonstrated that this functional form is similar to that of a kernel, implying that this gradient similarity described here can be applied to other similarity tasks, like clustering.
In this case, TracIn can be used as a similarity function within a clustering algorithm. To bound the similarity metric so that it can be converted to a distance measure (1 – similarity), we normalize the gradient vectors to have unit norm. Below, we apply TracIn clustering on images of zucchini to obtain finer clusters.
 |
| Finer clusters within Zucchini images using TracIn similarity. Each row is a cluster with zucchini in similar forms within the cluster: cross-sectionally sliced zucchini (top), piles of zucchinis (middle), and zucchinis on pizzas (bottom). |
Identifying Outliers with Self-Influence
Finally, we can also use TracIn to identify outliers that exhibit a high self-influence, i.e., the influence of a training point on its own prediction. This happens either when the example is mislabeled or rare, both of which make it difficult for the model to generalize over the example. Below are some examples with high self-influence.
 |
| Mislabeled examples. Assigned labels are striked out, correct labels are at bottom. |
 |
| Left: A rare oscilloscope example with just the oscillations, and no instrument in the image gets high self-influence. Right: Other common oscilloscope images have the scope with knobs and wires. These have a low self-influence. |
Applications
Having no requirement other than being trained using SGD (or related variants), TracIn is task-independent and applicable to a variety of models. For example, we have used TracIn to study training data for a deep learning model used to parse queries to the Google Assistant, queries of the kind “set my alarm for 7AM”. We were intrigued to see that the top opponent for the query “disable my alarm” with an alarm active on the device, was “disable my timer”, also with an alarm active on the device. This suggests that Assistant users often interchange the words “timer” and “alarm”. TracIn helped us interpret the Assistant data.
More examples can be found in the paper, including a regression task on structured data and a number of text classification tasks.
Conclusion
TracIn is a simple, easy-to-implement, scalable way to compute the influence of training data examples on individual predictions or to find rare and mislabeled training examples. For implementation references of the method, you can find a link to code examples for images from the github linked in the paper.
Acknowledgements
The NeurIPS paper was jointly co-authored with Satyen Kale and Mukund Sundararajan (corresponding author). A special thanks to Binbin Xiong for providing various conceptual and implementation insights. We also thank Qiqi Yan and Salem Haykal for numerous discussions. Images throughout this post sourced from Getty Images.

How Facebook partners with academia to help drive innovation in energy-efficient technology
Facebook is committed to sustainability and the fight against climate change. That’s why in September 2020 we announced our commitment to reaching net-zero emissions across our value chain in 2030. Part of Facebook’s sustainability efforts involve data center efficiency — from building servers that require less energy to run to developing a liquid cooling system that uses less water.
To learn more about these data center sustainability efforts at Facebook and how we’re engaging with the academic community in this space, we sat down with Dharmesh Jani (“DJ”), the Open Ecosystem Lead on the hardware engineering team and the Open Compute IC Chair, and Dr. Katharine Schmidtke, Director of Sourcing at Facebook for application-specific integrated circuits and custom silicon. DJ and Schmidtke’s teams are working to achieve four goals:
- Extend Facebook data center equipment lifecycle and make our gear reusable by others.
- Improve energy efficiency in Facebook infrastructure via hardware and software innovations.
- Reduce carbon-heavy content in our data centers.
- Work with industry and academia to drive innovation on sustainability across our value chain.
DJ and Schmidtke discuss why it’s important to build data centers that are as energy efficient as possible, how we’re working with and supporting academia and industry partners in this space, and potential research challenges that the Facebook researchers and engineers could tackle next.
Building energy-efficient data centers
For over a decade, Facebook has been committed to sustainability and energy efficiency. In 2009, Facebook built its first company-owned data center in Prineville, Oregon, one of the world’s most energy-efficient data centers with a power usage effectiveness (PUE) ratio between 1.06 and 1.08. In 2011, Facebook shared its designs with the public and — along with other industry experts — launched the Open Compute Project (OCP), a rapidly growing global community whose mission is to design, use, and enable mainstream delivery of the most efficient designs for scalable computing. However, there’s more to be done.
“On average, data centers use 205 TWh of electricity per year, which is the equivalent of 145 metric tons of CO2 emissions,” explains DJ. “With the growth of hyperscale data centers in the coming years, this emission is going to increase dramatically if mitigation is not considered today (source 1, source 2). Facebook wants to work to address this growing emission, as well, to ensure we run efficient operations and achieve our goal of net-carbon zero in 2030.”
You may also like
Chasing carbon: The elusive environmental footprint of computing
According to DJ, Facebook is doing multiple things to address these problems: “The sustainability team within Facebook is working across organizations to align on the goals that lead to reduction in carbon. Circularity is one of the emerging efforts within infrastructure to increase equipment life cycle, which has the biggest impact on the net-zero-carbon effort. We’re driving sustainability and circularity efforts in the industry through the Open Compute Project,” he says.
Data center construction itself also contributes to carbon emission. High-utilization efficiency on already-built data centers is the key to reducing new data center construction demand. Over the years, Facebook has been developing a suite of industry-leading technologies to control and manage the peak power demand of data centers. As a result, many more servers can be hosted in existing data centers with limited power capacity. This has led to more than 50% data center construction demand reduction. The technology is developed in-house with the help of academic collaborations and research internship programs. Some key research findings and hyper-scale industrial operation experience are also shared back to the community via top academic conference publications. Here are some examples: Dynamo: Facebook’s Data Center-Wide Power Management System, Coordinated Priority-aware Charging of Distributed Batteries in Oversubscribed Data Centers.
Learn more about Facebook data center efficiency on the Tech@ blog, and read our latest Sustainability Report on Newsroom.
Partnerships and collaborations
Developing energy-efficient technology isn’t something that industry can do alone, which is why we often partner with experts in academia and support their pioneering work. “Facebook has launched a number of research collaborations directed at power reduction and energy efficiency over the past few years,” Schmidtke says. “Recently, Facebook sponsored the Institute of Energy Efficiency at UC Santa Barbara with a gift of $1.5 million over three years. We hope our contribution will help foster research in data center energy efficiency.”
“Another example is the ongoing research collaboration with Professor Clint Schow at UCSB,” Schmidtke says. “The project is focused on increasing the efficiency of optical interconnect data transmission between servers in our data center network. The research has just entered its second phase and is targeting highly efficient coherent optical links for data transmission.”
Facebook is also an industry member of Center for Energy-Smart Electronic Systems (partnering with the University of Texas at Arlington) and Future Renewable Electric Energy Delivery and Management Systems Engineering Research Center (at North Carolina State University).
In addition to fostering innovation within the academic community, Facebook is leveraging industry partners. According to DJ, “We’re looking to drive sustainability-related initiatives within the OCP community to align other industry players across the value chain. We plan to define sustainability as one of the OCP tenets so that all future contributions can focus on it.”
What’s next
DJ offers three sustainability challenges that researchers in the field could tackle next, all of which would involve industry collaborations with academia and other research organizations.
One research challenge is making computation more carbon neutral. The AI field’s computing demands have witnessed exponential growth: Since 2012, the amount of compute used in the largest AI training runs has been increasing exponentially with a 3.4-month doubling time — a 300,000x increase in compute from AlexNet to AlphaGo Zero. “How can we make AI more efficient while the current approach of increasing computation is not viable?” says DJ. “This is one of the biggest challenges in the field, so I’m eager to see more Green AI initiatives.”
Another challenge is scheduling workloads (WL) within data centers when carbon intensity is low. “We have to think of the amount of WL coming into the data centers and complex interactions to optimize for such use cases,” explains DJ. “I hope to see novel algorithmic ways of reducing energy consumption, distributing workloads, and impacting carbon emissions.”
An additional potential area of focus is technology that utilizes chiplets. Chiplets can be thought of as reusable, mix-and-match building blocks that come together to form more complex chips, which is a more efficient system that uses a smaller carbon footprint. “I’m looking forward to new computer architectures that are domain specific and driven by chiplets,” says DJ. “We have only explored the tip of the iceberg in terms of sustainability. There is much we can do together in this space to further the goal of a greener tomorrow.”
Facebook is committed to open science, and we value our partnerships with industry and academia. We are confident that together we can help drive technology and innovation forward in this space.
The post How Facebook partners with academia to help drive innovation in energy-efficient technology appeared first on Facebook Research.
Anomaly detection with Amazon Lookout for Metrics
This is a guest blog post from Quantiphi, an AWS Advanced Consulting Partner that specializes in artificial intelligence, machine learning, and data and analytics solutions.
We’ve all heard the saying “time is money,” and that’s especially true for the retail industry. In a highly competitive environment where large volumes of data are generated, quick and accurate anomaly detection is critical to smooth business operations and positive customer experiences. However, doing so is easier said than done. Traditional anomaly detection techniques fall short because they can’t efficiently keep up with the growing volume of data. To put this in perspective, one of the largest retailers today collects around 2.5 petabytes of data per hour. Techniques that detect anomalies quickly at this scale and identify their root causes are required for taking effective business decisions.
Traditionally, businesses use dashboards to track metrics or key performance indicators. However, as the number of metrics grow, anomaly identification and remediation using traditional techniques become cumbersome. Therefore, many organizations look at machine learning (ML)-based anomaly detection to overcome this challenge.
In this post, we walk you through a retail example to demonstrate how Amazon Lookout for Metrics, a new ML-based AWS service for anomaly detection, helps accelerate detection and remediation of anomalies.
Anomaly detection in retail transactional data
Let’s dive into an anomaly detection use case we worked on for an online retailer. The retailer generated large amounts of customer transactional data, which serves as a window into their end-customer’s behavior (what products, brands, promotions, and ads they engaged with). For them, quick and accurate anomaly detection in KPIs is imperative for timely remediation, in order to maintain inventory flow and price compliance. As a result, the retailer wanted to ensure that the anomaly insights were actionable and reflected real risks to inventory availability and revenue.
To set up Lookout for Metrics, we first divided the data into regular time intervals. We then set up the detector, specifying the category of every column and the time format of the timestamp, which are mandatory fields. Lookout for Metrics allows us to define up to five measures and five dimensions for continuous monitoring for anomalies. We then trained the detector using historical data and used live data for testing and continuous learning. We uploaded this data to Amazon Simple Storage Service (Amazon S3) regularly, at the time interval specified when setting up the detector.
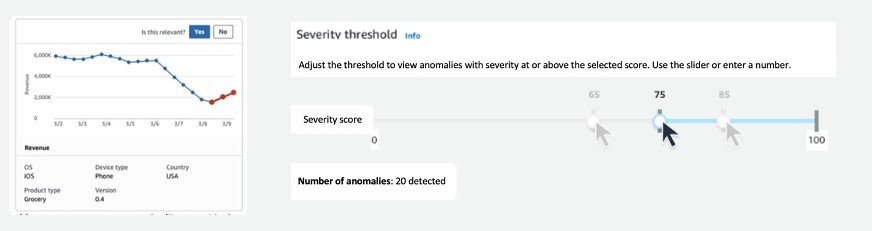
At each specified time interval, Lookout for Metrics checked for the presence of new data and new anomalies. When it detected an anomaly, it provided two additional insights. First it provided a severity score measuring the magnitude of the anomaly. The severity scores also helped the retailer tune the sensitivity of their model to focus only on the most important events. Second, it revealed a breakdown of the dimensions that contributed to the anomaly, with a percentage contribution from each dimension value, which was useful for determining the appropriate actions to take.
When the retailer applied the detector, we identified a few transactions in which thousands of items were sold at steep discounts. We used insights from the dimensions to quickly learn that these transactions were due to wholesale purchasing and bulk order shipments to large corporations. The retailer was then able to promptly take action to ensure inventory availability for other customers wasn’t impacted.
Comparing Amazon Lookout for Metrics to traditional anomaly detection methods
One of the key benefits of using Lookout for Metrics is a reduction in setup time from days to hours. The setup process is straightforward (see the following diagram). After you define your data source and the metrics you want to track, you can build your first detector model. Lookout for Metrics is then capable of detecting anomalies continuously. In the previous retail example, we detected anomalies in the transactional dataset within 10 minutes of setting up the Lookout for Metrics detector. The process with traditional methods would take 2–3 days. Traditional methods also require highly technical resources and subject matter experts versed in analytics and ML to create and manage custom models. In the case of Lookout for Metrics, the service manages the ML pipeline, allowing you to focus on anomalies, root causes, and actions.

By leveraging a managed service like Lookout for Metrics, anomaly detection is simplified and automated, saving time and effort. Lookout for Metrics helps customers in a wide variety of industries such as retail, ads and marketing, gaming, software and internet, and telecommunications to accurately detect anomalies in their time series data and understand the root cause.
You can use Lookout for Metrics to do the following:
- Detect anomalies in metrics with high accuracy using advanced ML technology, leading to fewer false alarms and missed anomalies, with no ML experience required.
- Get a more holistic view of their business while minimizing disparate alerts. The service groups concurrent anomalies and sends a single alert on related anomalies, which summarizes the what, how, and where.
- Continuously improve accuracy and performance by providing feedback on detected anomalies. Lookout for Metrics incorporates your feedback in real time to learn what is most relevant to your business.
- Prioritize which anomalies to focus on first using the ranked severity score and tune the sensitivity threshold to get alerted on only the relevant anomalies (see the following diagram).
Summary
As an Advanced Consulting Partner, Quantiphi comes with immense experience in solving critical business challenges for our customers. We have worked on several anomaly detection engagements. In addition to the retail example discussed in this post, we recently helped an advertisement analytics company improve their offerings by building models to improve the effectiveness of ad campaigns.
With Lookout for Metrics, we aim to expedite the delivery of solutions to detect anomalies in different business processes, thus bringing unprecedented value to our customers.
Amazon Lookout for Metrics (Preview) is available on the AWS Management Console, via the AWS SDKs, and the AWS Command Line Interface (AWS CLI) in the following Regions: US East (N. Virginia), US East (Ohio), US West (Oregon), Europe (Ireland), and Asia Pacific (Tokyo). See the AWS Region Table for more details. Request access to the preview today.
Quantiphi is an AWS Advanced Consulting Partner with a deep understanding of artificial intelligence, machine learning, and data and analytics solutions. For more information about Quantiphi, contact them here.
The content and opinions in this post are those of the third-party author and AWS is not responsible for the content or accuracy of this post.
About the Authors
Vibhav Gupta is a Senior Client Solutions Partner at Quantiphi.
Tripurana Rahul is a Senior Business Analyst at Quantiphi.
How AWS scientists help create the NFL’s Next Gen Stats
In its collaboration with the NFL, AWS contributes cloud computing technology, machine learning services, business intelligence services — and, sometimes, the expertise of its scientists.Read More