Video Classification on Edge Devices with TensorFlow Lite and MoViNet

Posted by Dan Kondratyuk, Liangzhe Yuan, Google Research and Khanh LeViet, TensorFlow Developer Relations

We are excited to announce MoViNets (pronounced “movie nets”), a family of new mobile-optimized model architectures for video classification. The models are trained on the Kinetics-600 dataset to be able to recognize 600 different human actions (such as playing trumpet, robot dancing, bowling, and more) and can classify video streams captured on a modern smartphone in real time. You can download the pre-trained TensorFlow Lite models from TensorFlow Hub or try it out using our Android and Raspberry Pi demo apps, as well as fine-tune your own MoViNets with the Colab demo and the code in the TensorFlow Model Garden.

Demo from the TensorFlow Lite video classification reference app

Video classification is a machine learning task that takes video frames as input and predicts a single class from a larger set of classes. Video action recognition is a type of video classification where the set of predicted classes consists of human actions that happened in the frames. Video action recognition is similar to image recognition in that both take input images and output the probabilities of the images belonging to each of the predefined classes. However, a video action recognition model has to look at both the content of each frame and the spatial relationships between adjacent frames to understand the actions in the video. For example, if you look at these still images, it’s difficult to tell what the person is doing.

But if you look at the full video, it becomes clear that the person is performing jumping jacks.

MoViNet Model Architecture

MoViNets are a family of convolutional neural networks which efficiently process video streams, outputting accurate predictions with a fraction of the latency of convolutional video classifiers like 3D ResNets or transformer-based classifiers like ViT.

Frame-based classifiers output predictions on each 2D frame independently, resulting in sub-optimal performance due to their lack of temporal reasoning. On the other hand, 3D video classifiers offer high accuracy predictions by processing all frames in a video clip simultaneously, at a cost of significant memory and latency penalties as the number of input frames increases. MoViNets offer key advantages from both 2D frame-based classifiers and 3D video classifiers while mitigating their disadvantages.

The following figure shows a typical approach to using 3D networks with multi-clip evaluation, where the predictions of multiple overlapping subclips are averaged together. Shorter subclips result in lower latency, but reduce the overall accuracy.

Diagram illustrating Multi-Clip Evaluation for 3D Video Networks

MoViNets take a hybrid approach, which proposes the use of causal convolutions in place of 3D convolutions, allowing intermediate activations to be cached across frames with a Stream Buffer. The Stream Buffer copies the input activations of all 3D operations, which is output by the model and then input back into the model on the next clip input.

Diagram illustrating Streaming Evaluation for MoViNets

The result is that MoViNets can receive one frame input at a time, reducing peak memory usage while resulting in no loss of accuracy, with predictions equivalent to inputting all frames at once like a 3D video classifier. MoViNets additionally leverage Neural Architecture Search (NAS) by searching for efficient configurations of models on video datasets (specifically Kinetics 600) across network width, depth, and resolution.

The result is a set of action classifiers that can output temporally-stable predictions that smoothly transition based on frame content. Below is an example plot of MoViNet-A2 making predictions on each frame on a video clip of skateboarding. Notice how the initial scene with a small amount of motion has relatively constant predictions, while the next scene with much larger motion causes a dramatic shift in predicted classes.

MoViNets need a few modifications to be able to run effectively on edge devices. We start with MoViNet-A0-Stream, MoViNet-A1-Stream, and MoViNet-A2-Stream, which represent the smaller models that can feasibly run in real time (20 fps or higher). To effectively quantize MoViNet, we adapt a few modifications to the model architecture – the hard swish activation is replaced by ReLU6, and Squeeze-and-Excitation layers are removed in the original architectures, which results in 3-4 p.p accuracy drop on Kinetics-600. We then convert the models to TensorFlow Lite and use integer-based post-training quantization (as well as float16 quantization) to reduce the model sizes and make them run faster on mobile CPUs. The integer-based post-training quantization process further introduces 2-3 p.p. accuracy loss. Compared to the original MoViNets, quantized MoViNets lag behind in accuracy on full 10-second Kinetics 600 clips (5-7 p.p. accuracy reduction in total), but in practice they are able to provide very accurate predictions on daily human actions, e.g., push ups, dancing, and playing piano. In the future, we plan to train with quantization-aware training to bridge this accuracy gap.

A video plotting the top-5 predictions of MoViNet-A2 over time on an example 8-second (25 fps) skateboarding video clip. Create your own plots with this Colab notebook.

We benchmark quantized A0, A1, and A2 on real hardware and the model inference time achieves 200, 120, and 60 fps respectively on Pixel 4 CPU. In practice, due to the input pipeline overhead, we see increased latency closer to 20-60 fps when running on Android with a camera as input.

Model

Quantization

Top-1 Accuracy (%)

Latency 
(ms, Pixel 4 CPU)

Model Size (MB)

Recommended Input

A0-Stream

int8

65.0

4.80

3.1

172 x 172, 5 fps

A1-Stream

int8

70.1

8.35

4.5

172 x 172, 5 fps

A2-Stream

int8

72.2

15.76

5.1

224 x 224, 5 fps

A0-Stream

float16

71.5

17.47

7.6

172 x 172, 5 fps

A1-Stream

float16

76.0

34.82

13

172 x 172, 5 fps

A2-Stream

float16

77.5

76.31

15

224 x 224, 5 fps

Train a Custom Model

You can train your own video classifier model using the MoViNet codebase in the TensorFlow Model Garden. The provided Colab notebook provides specific steps on how to fine-tune a pretrained video classifier on another dataset.

Future Steps

We are excited to see on-device online video action recognition powered by MoViNets, which demonstrate highly efficient performance. In the future, we plan to support quantize-aware training for MoViNets to mitigate the quantization accuracy loss. We also are interested in extending MoViNets as the backbone for more on-device video tasks, e.g. video object detection, video object segmentation, visual tracking, pose estimation, and more.

Acknowledgement

We would like to extend a big thanks to Yeqing Li for supporting MoViNets in TensorFlow Model Garden, Boqing Gong, Huisheng Wang, and Ting Liu for project guidance, Lu Wang for code reviews, and the TensorFlow Hub team for hosting our models.

Read More

How to migrate from BoostedTrees Estimators to TensorFlow Decision Forests

Posted by Mathieu Guillame-Bert and Josh Gordon for the TensorFlow team

Decision forest models like random forests and gradient boosted trees are often the most effective tools available for working with tabular data. They provide many advantages over neural networks, including being easier to configure, and faster to train. Using trees greatly reduces the amount of code required to prepare your dataset, as they natively handle numeric, categorical, and missing features. And they often give good results out-of-the-box, with interpretable properties.

Although we usually think of TensorFlow as a library to train neural networks, a popular use case at Google is to use TensorFlow to create decision forests.

An animation of a decision tree classifying data.

This article provides a migration guide if you were previously creating tree-based models using tf.estimator.BoostedTrees, which was introduced in 2019. The Estimator API took care of much of the complexity of working with models in production, including distributed training and serialization. However, it is no longer recommended for new code.

If you are starting a new project, we recommend that you use TensorFlow Decision Forests (TF-DF). This library provides state-of-the-art algorithms for training, serving and interpreting decision forest models, with many benefits over the previous approach, notably regarding quality, speed, and ease of use.

To start, here are equivalent examples using the Estimator API and TF-DF to create a boosted tree model.

Previously, this is how you would train a gradient boosted tree models with tf.estimator.BoostedTrees (no longer recommended)

python
import tensorflow as tf

# Dataset generators
def make_dataset_fn(dataset_path):
def make_dataset():
data = ... # read dataset
return tf.data.Dataset.from_tensor_slices(...data...).repeat(10).batch(64)
return make_dataset

# List the possible values for the feature "f_2".
f_2_dictionary = ["NA", "red", "blue", "green"]

# The feature columns define the input features of the model.
feature_columns = [
tf.feature_column.numeric_column("f_1"),
tf.feature_column.indicator_column(
tf.feature_column.categorical_column_with_vocabulary_list("f_2",
f_2_dictionary,
# A special value "missing" is used to represent missing values.
default_value=0)
),
]

# Configure the estimator
estimator = boosted_trees.BoostedTreesClassifier(
n_trees=1000,
feature_columns=feature_columns,
n_classes=3,
# Rule of thumb proposed in the BoostedTreesClassifier documentation.
n_batches_per_layer=max(2, int(len(train_df) / 2 / FLAGS.batch_size)),
)

# Stop the training is the validation loss stop decreasing.
early_stopping_hook = early_stopping.stop_if_no_decrease_hook(
estimator,
metric_name="loss",
max_steps_without_decrease=100,
min_steps=50)

tf.estimator.train_and_evaluate(
estimator,
train_spec=tf.estimator.TrainSpec(
make_dataset_fn(train_path),
hooks=[
# Early stopping needs a CheckpointSaverHook.
tf.train.CheckpointSaverHook(
checkpoint_dir=input_config.raw.temp_dir, save_steps=500),
early_stopping_hook,
]),
eval_spec=tf.estimator.EvalSpec(make_dataset_fn(valid_path)))

How to train the same model using TensorFlow Decision Forests

python
import tensorflow_decision_forests as tfdf

# Load the datasets
# This code is similar to the estimator.
def make_dataset(dataset_path):
data = ... # read dataset
return tf.data.Dataset.from_tensor_slices(...data...).batch(64)

train_dataset = make_dataset(train_path)
valid_dataset = make_dataset(valid_path)

# List the input features of the model.
features = [
tfdf.keras.FeatureUsage("f_1", keras.FeatureSemantic.NUMERICAL),
tfdf.keras.FeatureUsage("f_2", keras.FeatureSemantic.CATEGORICAL),
]

model = tfdf.keras.GradientBoostedTreesModel(
task = tfdf.keras.Task.CLASSIFICATION,
num_trees=1000,
features=features,
exclude_non_specified_features=True)

model.fit(train_dataset, valid_dataset)

# Export the model to a SavedModel.
model.save("project/model")

Remarks

  • While not explicit in this example, early stopping is automatically enabled and configured.
  • The dictionary of the “f_2” features is automatically built and optimized (e.g. rare values are merged into an out-of-vocabulary item).
  • The number of classes (3 in this example) is automatically determined from the dataset.
  • The batch size (64 in this example), has no impact on the model training. Larger values are often preferable as it makes reading the dataset more efficient.

TF-DF is all about ease of use, and the previous example can be further simplified and improved, as shown next.

How to train a TensorFlow Decision Forests (recommended solution)

import tensorflow_decision_forests as tfdf
import pandas as pd

# Pandas dataset can be used easily with pd_dataframe_to_tf_dataset.
train_df = pd.read_csv("project/train.csv")

# Convert the Pandas dataframe into a TensorFlow dataset.
train_ds = tfdf.keras.pd_dataframe_to_tf_dataset(train_df, label="my_label")

model = tfdf.keras.GradientBoostedTreeModel(num_trees=1000)
model.fit(train_dataset)

Remarks

  • We did not specify the semantics (e.g. numerical, or categorical) of the features. In this case, the semantics will be automatically inferred.
  • We also didn’t list which input features to use. In this case, all the columns (except for the label) will be used. The list and semantics of the input feature is visible in the training logs, or with the model inspector API.
  • We did not specify any validation dataset. Each algorithm will optionally extract a validation dataset from the training examples as best for the algorithm. For example, by default, GradientBoostedTreeModel uses 10% of the training data for validation if no validation dataset is provided.

Now, let’s look at a couple differences between the Estimator API and TF-DF.

Differences between the Estimator API and TF-DF

Type of algorithms

TF-DF is a collection of decision forest algorithms. This includes (but is not limited to) the Gradient Boosted Trees available with the Estimator API. Notably, TF-DF also supports Random Forest (great for nosy datasets) and a CART implementation (great for model interpretation).

In addition, for each of those algorithms, TF-DF includes many variations found in the literature and validated experimentally [1, 2, 3].

Exact vs approximate splits

The TF1 GBT Estimator is an approximated tree learning algorithm. Informally, the Estimator builds trees by only considering a random subset of examples and a random subset of the conditions at each step.

By default, TF-DF is an exact tree training algorithm. Informally, TF-DF considers all the training examples and all the possible splits at each step. This is a more common and often better performing solution.

While sometimes faster on larger datasets (>10B examples x features), the estimator approximation are often less accurate (as more trees need to be grown to reach the same quality). In a small dataset (<100M examples x features), the form of approximated training implemented in the Estimator can even be slower than exact training.

TF-DF also supports various types of “approximated” tree training. The recommended approach is to use exact training, and optionally test approximated training on large datasets.

Inference

The Estimator runs model inference using the top-down tree routing algorithm. TF-DF uses an extension of the QuickScorer algorithm.

While both algorithms return the exact same results, the top-down algorithm is less efficient because of exceeding branching predictions and cache misses. TF-DF inference is generally 10x faster on the same model.

For latency critical applications TF-DF offers a C++ API. It provides often ~1µs/example/core inference time. This is often a 50x-1000x speed-up over TF SavedModel inference (especially on small batches).

Multi-head models

The Estimator supports multi-head models (a model that outputs multiple predictions). TF-DF (currently) does not support multi-head models directly, however, using the Keras Functional API, multiple TF-DF models trained in parallel can be assembled into a multi-head model.

Learning more

You can learn more about TensorFlow Decision Forests by visiting the website. If you’re new to this library, the beginner example is a good place to start. Experienced TensorFlow users can visit this guide for important details about the difference between using decision forests and neural networks in TensorFlow, including how to configure your training pipeline, and tips on Dataset I/O. You can also see Migrate from Estimator to Keras APIs for more info on migrating from Estimators to Keras in general.

Read More

How LinkedIn Personalized Performance for Millions of Members using Tensorflow.js

A guest post by LinkedIn

Mark Pascual, Sr. Staff Engineer

Nitin Pasumarthy, Staff Engineer

Introduction

The Performance team at LinkedIn optimizes latency to load web and mobile pages. Faster sites improve customer engagement and eventually revenue to LinkedIn. This concept is well documented by many other companies too who have had similar experiences but how do you define the optimal trade off between page load times and engagement?

The relationship between speed and engagement is non-linear. Fast loading sites, after a point, may not increase engagement by further reducing their load times. At LinkedIn we have used this relationship between engagement and speed to selectively customize the features on LinkedIn Lite – a lighter, faster version of LinkedIn, specifically built for mobile web browsers.

To do this, we trained a deep neural network to identify if a request to LinkedIn would result in a fast page load in real time. Based on the performance quality result predicted by this model we change the resolution of all images on a given user’s news feed before the resulting webpage was sent to the client. This led to an increase in the magnitude of billions for extra Feed Viral Actions (+0.23%) taken, millions more Engaged Feed Users (+0.16%) and Sponsored Revenue increased significantly for us too (+0.76%).

Image Quality Comparison: Image on the left uses 4x more memory than the one on the right which is less than ideal to send to users on slow network connections or when the device may be low on resources. Prior to using an ML model, we only showed the low resolution image which was not great for users that had capacity for higher quality images on newer devices.

We described in great detail why many of our performance optimization experiments failed back in 2017 and how we used those learnings to build a Performance Quality Model (PQM) in our Personalizing Performance: Adapting Application in real time to member environments blog.

PQM’s bold goal is to predict various performance metrics (e.g. page load time) of any web / mobile page using both device and network characteristics of end users to empower (web) developers to build impactful application features that are otherwise tricky to implement (like the one we described above).

We are happy to announce that we are open sourcing our first performance quality model that is trained on millions of RUM data samples from around the world free to use for your own website performance optimizations! Learn more and get started here.

In the rest of this blog, we will go over how our team of full stack developers deployed this PQM in production that works at Linkedin scale! We wish to prove that deploying TensorFlow.js ML models today is both easy and beneficial for those working on the Node.js stack.

TensorFlow.js: Model Deployment in Node.js

At the time of our production deployment, LinkedIn’s TensorFlow model deployment machinery was still being developed. Furthermore, using TensorFlow Serving was not yet a feasible option for us. So even though we had a model ready for use, we needed to figure out a way to deploy it.

As LinkedIn is primarily a Java/JVM stack for serving external traffic, it might seem like TensorFlow Java would be ideal, but it was still experimental and didn’t have the API stability guarantees that we require.

We looked at our options and realized that we already use Node.js (behind the JVM) as part of our frontend web serving stack in order to perform server side optimizations when serving HTML pages. The architecture for this is unique in that we use the JVM to manage an external pool of Node.js processes to perform “work,” e.g., the previously mentioned server side optimizations. The “work” can really be anything that Node.js can perform. In our use case, this enables us to use TensorFlow.js in an architecture that was already proven.

We repurposed our frontend stack to use Node.js to deploy our custom model and ended up with great results. In terms of performance, our mixed stack of Java and Node.js easily met our SLAs. The 50th and 90th percentile production latencies as measured (a) from a client (within the datacenter), (b) from on host instrumentation, and (c) in terms of only Node.js performing inference using TensorFlow.js are shown in the table below.

50th Percentile

90th Percentile

From client (within datacenter)

10 ms

12 ms

On host

8 ms

10 ms

Inference in Node.js

2 ms

3 ms

The resulting architecture is shown above in Figure 1 below.

The API request that requires a prediction is received by the JVM server and is routed to our Rest.li infrastructure which in turn routes the request to our performance prediction resource. To handle the request, the PaaS resource performs some feature generation based on the inputs and then makes an RPC call out to the Node.js process for the prediction.

The N Node.js processes are long-lived. They are started upon JVM startup and have already loaded the desired model using tf.node.loadSavedModel(). When a process receives a request for a prediction, it simply takes the input features, calls tf_model.predict(), and returns the result. Here is a simplified version of the Node.js code:

const tf = require(‘@tensorflow/tfjs-node’);

async function main() {
// load the model when the process starts so it’s always ready
const model = await tf.node.loadSavedModel(‘model_dir’);

function predict(rawInput) {
return tf.tidy(() => {
// prepare the inputs as tensor arrays
const x = {}
for (const feature of Object.keys(predictionInput)) {
x[feature] = tf.tensor([input[feature]], [1, 1]);
}

const output = model.predict(x, {});
const probs = Array.from(output.probabilities.dataSync());
const classes = Array.from(output.all_class_ids.dataSync());
const result = Object.fromEntries(classes.map((classId, i) => [classId, probs[i]]));
return result; // {0: 0.8, 1: 0.15, 2: 0.05} probability of each performance quality
});
}

// Register our ‘predict’ RPC handler (pseudo-code)
// process is an abstraction of the Node.js side of the communication channel
// with the JVM
process.registerHandler(‘predict’, input => {
const result = predict(input);
return Promise.resolve(result);
});
}

main();

The API request that requires a prediction is received by the JVM server and is routed to our Rest.li infrastructure which in turn routes the request to our performance prediction resource. To handle the request, the PaaS resource performs some feature generation based on the inputs and then makes an RPC call out to the Node.js process for the prediction.

The N Node.js processes are long-lived. They are started upon JVM startup and have already loaded the desired model using tf.node.loadSavedModel(). When a process receives a request for a prediction, it simply takes the input features, calls tf_model.predict(), and returns the result. Here is a simplified version of the Node.js code:

Express could replace Rest.li’s role and the feature generation pieces would need to be ported to Node.js, but everything else remains the same. As you can see, the architecture is cleaner and requires less mental hoops to manage both Java and Node.js in the same stack.

An Unexpected Win

In the architecture we described above, the external processes do not have to be Node.js. The library that we use to manage the external process is pretty straightforward to implement in most technologies. In fact, we could have chosen Python for the external processes as it’s popular for this ML use case. So what are the reasons we stuck with Node.js? Well, there’s two: (1) we already had a Node.js implementation for the external process infrastructure and would have had to develop a new one for Python, and (2) it turns out that Node.js is also slightly faster at making the predictions due to the pre/post processing benefitting from the JIT compiler of JavaScript.

In order to prove this to ourselves, we took samples (~100k) from our real world prediction inputs and ran them against both Node.js and Python. The test bed was not exactly our production stack (we didn’t include the JVM side), but it was close enough for our purposes. The results are shown below:

Stack

50th percentile

Delta (from Python)

Python

1.872 ms

0%

Node.js

1.713 ms

-8.47%

The results show that Node.js is almost 10% faster at performing inference for our specific model. Of course, performance may vary based on model architectures and the amount of pre and post processing being performed in Node. These results were from our model running on a typical production machine. Results may also vary due to model complexity, machine differences, and so on.

Checkout our README in the open source repo to find out how we tested the model in Python and Node.js.

Looking to the future

Our current unique architecture does have some areas for improvement. Probably the biggest opportunity is to address the uniqueness of this multi stack architecture itself. The mix of both Java and Node.js technologies adds additional cognitive overhead and complexity during design, development, debugging, operations, maintenance – however as previously stated you could move the whole stack to Node to simplify matters, so this is a solvable problem.

Another potential area for improvement comes from currently using a single threaded architecture on the Node.js side. Because of this, only a single prediction currently occurs at a time so latency sometimes includes some amount of queueing time. This can potentially be worked around by using Node worker threads for parallel execution that may be considered in future versions of this implementation. In our particular case, however, prediction is very fast even as it stands, so we do not feel the need to explore this right now.

Summary

The availability of TensorFlow.js gave us an easy option to deploy our model to serve production use cases when other options were not quite suitable or available to us. While our unique requirements resulted in using non-standard architecture (the mixture of the JVM and Node.js), TensorFlow.js can be used to an even greater effect in a homogeneous Node.js serving stack resulting in a very clean and performant architecture. With our open source performance quality model, a full stack JS engineer can personalize performance and improve their user engagement and we look forward to seeing how others use our open sourced model to do just that on their own websites.

Acknowledgements

This success would not be possible without the tremendous work by Prasanna Vijayanathan and Niranjan Sharma. A huge thank you to Ritesh Maheshwari and Rahul Kumar for their support and encouragement. Special thanks to Ping Yu (Google) and Jason Mayes (Google) for their continued support and feedback.

Read More

Intro mPOD DxTrack: A low-cost healthcare device using TensorFlow Lite Micro

A guest post by Jeffrey Ly, CEO & Joanna Ashby, CMO of mPOD, Inc.

mPOD is a NIH-funded pre-seed startup headquartered out of Johnson & Johnson’s Innovation (JLABS) in New York City. In this article, we’d like to share with you a hardware device we have developed independently at mPOD leveraging TensorFlow Lite Micro (TFLM) as a core technology, called DxTrack.

mPOD DxTrack leverages TFLM and low cost hardware to enable accurate, rapid and objective interpretation of currently available lateral flow assays (LFAs) in less than 10 seconds. LFAs serve as diagnostic tools because they are low-cost and simple to use without specialized skills or equipment. Most recently popularized by COVID-19 rapid antigen tests, LFAs are also used extensively testing for pregnancy, disease tracking, STDs, food intolerances, and therapeutic drugs along with an extensive array of biomarkers totaling billions of tests sold each year. The mPOD Dxtrack is applicable to use with any type of visually read lateral flow assay, demonstrating a healthcare use case for TFLM that can directly impact our everyday lives.

The LFA begins with a sample (nasal swab, saliva, urine, blood, etc) loaded at (1) in the figure below. Once the sample has flowed to the green conjugate zone (2), it is labeled with a signaling moiety. Through capillary action, the sample will continue flowing until it is immobilized at (3), with these LFA tests, two lines indicate a positive result, one line indicates a negative result.

Figure 1. Side (A) & Top (B) view of a lateral flow assay (LFA) sample where at (1) the sample (nasal swab, saliva, urine, blood, etc) is loaded before flowing to the green zone (2), where the target is labeled with a signaling moiety. Through capillary action, the sample will continue flowing until it is immobilized at (3) to form the test line. Excess material is absorbed at (4).
Figure 2. These are the 3 possible classes results for a lateral flow assay (LFA) test.
Figure 3. This is a diagram NOWDiagnostics ADEXUSDx lateral flow assay (LFA) designed to collect and run saliva sample in point-of-care (POC) and over-the-counter (OTC) settings.

When used correctly, these tests are very effective; however self-testing presents challenges for the lay user to interpret. Significant variability is present between devices, making it difficult to tell if the test line you see is negative …or a faint positive?

Figure 4. A visualization of how the TinyML model on the mPOD DxTrack break interprets and classifies different lateral flow assay (LFA) results.

To address this challenge, we developed mPOD DxTrack, an over-the-counter (OTC) LFA reader that improves the utility of lateral flow assays by enabling rapid and objective readings with a simple, under $5 (Cost-of-Goods) globally-deployable device. The mPOD DxTrack aims to read lateral flow assay tests using ML to accomplish two goals: 1) enable rapid and objective readings of LFAs and 2) streamline digital reporting. Critically, TinyML allows for the software on the mPOD DxTrack to be deployed on low-cost (less-than $5) hardware that can be widely distributed – which is difficult with existing LFA readers which rely on high-cost/high complexity hardware that cost hundreds to thousands of dollars per unit. Ultimately, we believe that TinyML will enable the mPOD DxTrack to catch missed positive test results by removing human bias and increasing confidence in lateral flow device testing, reducing user error, and increasing overall result accuracy.

Figure 5. Assembly view of the mPOD DxTrack with lateral flow assay (LFA) cassette.

Technical Dive

Key Considerations

  • Achieving high accuracy 99% overall accuracy, (99% sensitivity, 99% specificity) for model performance when interpreting live-run LFA strips.
  • Ensuring the model can maintain that level of performance while fitting the hardware constraints.

Model size constraints for TinyML

Deployment of the DxTrack TinyML model on the Pico4ML Dev kit is constrained by 2 pieces of hardware: Flash memory and SRAM. The Pico4ML Dev kit has 2MB of flash memory to host the .uf2 file and 264kb of SRAM that accommodate the intermediate arrays (among other things) of the model. Ensuring the model size stays within these bounds is critical because while the code can successfully compile, run on the host machine and even successfully flash on the Pico4Ml Dev Kit, it will hang during set-up and not execute the main loop.

Rather than guess and check the size of intermediate arrays (a process we initially took with little reproducible success), we ended up developing a workflow that enabled us to quantify the model’s arena size by first using the interpreter function. See below, where this function was called during setup:

TfLiteStatus setup_status = ScreenInit(error_reporter);
if (setup_status != kTfLiteOk){
while(1){TF_LITE_REPORT_ERROR(error_reporter, "Set up failedn");};
}
arena_size = interpreter->arena_used_bytes();
printf("Arena_Size Used: %zu n", arena_size);

When printed out, this is what the value from the interpreter function should look during Pico4ML Dev kit boot-up:

DEV_Module_Init OK                                                              
Arena_Size Used: 93500
sd_spi_go_low_frequency: Actual frequency: 122070
V2-Version Card
R3/R7: 0x1aa
R3/R7: 0xff8000
R3/R7: 0xc0ff8000
Card Initialized: High Capacity Card
SD card initialized
SDHC/SDXC Card: hc_c_size: 15237
Sectors: 15603712
Capacity: 7619 MB
sd_spi_go_high_frequency: Actual frequency: 12500000

With this value available to us, we are then able to set the appropriate TensorArenaSize. As you can see from above, the model uses 93500 bytes of SRAM. By setting the TensorArenaSize to just above that amount 99×1024 = 101376 bytes, we are able to allocate enough memory to host the model without going over the hardware limits (which also causes the Pico4ML Dev Kit to freeze).

// An area of memory to use for input, output, and intermediate arrays.
constexpr int kTensorArenaSize = 99* 1024; // 136 * 1024; //81 * 1024;
static uint8_t tensor_arena[kTensorArenaSize];

Transforming from Unquantized to Quantized Models

Now that we have a reproducible methodology to quantify and deploy the model onto the Pico4ML Dev Kit, our next challenge is ensuring that the model can achieve the accuracy we require while still fitting with the size constrained by the hardware. For reference, the mPOD DxTrack platform is designed to interpret a 96×96 image. In the original model design, we were able to achieve > 99.999% accuracy with our model, but the intermediate layer is 96x96x32 at fp32 which requires over 1 MB of memory – it would never fit on the Pico4ML Dev Kit’s 264KB of SRAM. In order to achieve the size requirement for the model, we needed to take the model from unquantized to quantized; our best option was to utilize full int8 quantization. In essence, instead of treating the tensor values as floating points (float32), we correlate those values to integers (int8). Unfortunately, this decreased the model size 4-fold, allowing it to fit onto the Pico4ML Dev Kit’s rounding error from fp32 to int8 compounded, resulting in dramatically reduced model performance.

ALT TEXT

To combat this drop in model performance, we examined the effect of two different quantization strategies to improve performance: Post-training quantization (PTQ) and Quantization-aware training (QAT).

Below, we compare 3 different models to understand which quantization strategy is best. For reference:

  • Model 1: 2-layer convolutional network
  • Model 2: 3-layer convolutional network
  • Model 3: 4-layer convolutional network

As we can see, Quantization-aware training (QAT) uniformly beats the post-training quantization (PTQ) method and it became part of our workflow moving forward.

What performance can we achieve now?

Tested across over 800 real-world test runs, the mPOD DxTrack can preliminary achieve an overall accuracy of 98.7%. This version of the model is currently being evaluated by our network of manufacturing partners who we work closely with. Currently we are assembling a unique dataset of images as part of a patient-focused data pipeline to learn from each manufacturing partnership and building bespoke models.

Our preliminary work has also helped us correlate model performance with appropriately large dataset size to achieve the performance high enough accuracy for our healthcare application. Per the figure attached, the model needs to be trained on a quality dataset of at least 15,000 images. Our commercial-ready target is likely to require datasets that are greater than 100,000 images.

ALT TEXT

To learn more about mPOD Inc, please visit our website at www.mpod.io. If you’re interested in learning more about TinyML, we recommend checking out this book and this course.

Read More

Accelerating TensorFlow Lite Micro on Cadence Audio Digital Signal Processors

Posted by Raj Pawate (Cadence) and Advait Jain (Google)

Digital Signal Processors (DSPs) are a key part of any battery-powered device offering a way to process audio data with a very low power consumption. These chips run signal processing algorithms such as audio codecs, noise canceling and beam forming.

Increasingly these DSPs are also being used to run neural networks such as wake-word detection, speech recognition, and noise suppression. A key part of enabling such applications is the ability to execute these neural networks as efficiently as possible.

However, productization paths for machine learning on DSPs can often be ad-hoc. In contrast, speech, audio, and video codecs have worldwide standards bodies such as ITU and 3GPP creating algorithms for compression and decompression addressing several aspects of quality measurement, fixed point arithmetic considerations and interoperability.

TensorFlow Lite Micro (TFLM) is a generic open-sourced inference framework that runs machine learning models on embedded targets, including DSPs. Similarly, Cadence has invested heavily in PPA-optimized hardware-software platforms such as Cadence Tensilica HiFi DSP family for audio and Cadence Tensilica Vision DSP family for vision.

Google and Cadence – A Multi-Year Partnership for Enabling AI at the Edge

This was the genesis of the collaboration between the TFLM team and the Audio DSP teams at Cadence, starting in 2019. The TFLM team is focusing on leveraging the broad TensorFlow framework and developing a smooth path from training to embedded and DSP deployment via an interpreter and reference kernels. Cadence is developing a highly optimized software library, called NeuralNet library (NNLIB), that leverages the SIMD and VLIW capabilities of their low-power HiFi DSPs. This collaboration started with three optimized kernels for one Xtensa DSP, and now encompasses over 50 kernels across a variety of platforms such as HiFi 5, HiFi 4, HiFi 3z, Fusion F1 as well as Vision DSPs such as P6, and includes the ability to offload to an accelerator, if available.

Additionally, we have collaborated to add continuous integration for all the optimized code targeted for the Cadence DSPs. This includes infrastructure that tests that every pull request to the TFLM repository passes all the unit tests for the Tensilica toolchain with various HiFix and Vision P6 cores. As such, we ensure that the combined TFLM and NNLIB open source software is both tightly integrated and has good automated test coverage.

Performance Improvements

Most recently, we have collaborated on adding optimizations for models that are quantized with int16 activations. Specifically in the domain of audio, int16 activations can be critical for the quality of quantized generative models. We expect that these optimized kernels will enable a new class of ML-powered audio signal processing. The table below shows a few operators that are required for implementing a noise suppression neural net. We show a 267x improvement in cycle count for a variant of SEANet, an example noise suppression neural net.

The following table shows the improvement with the optimized kernels relative to the reference implementations as measured with the Xtensa instruction set simulation tool.

Operator

Improvement

Transpose Conv

458x

Conv2D

287x

Sub

39x

Add

24x

Leaky ReLU

18x

Srided_Slice

10x

Pad

6x

Overall Network

267x

How to use these optimizations

All of the code can be used from the TFLite Micro GitHub repository.

To use HiFi 3z targeted TFLM optimizations, the following conditions need to be met:

  • the TensorFlow Lite (TFLite) flatbuffer model is quantized with int16 activations and int8 weights
  • it uses one or more of the operators listed in the table above
  • TFLM is compiled with OPTIMIZED_KERNEL_DIR=xtensa

For example, you can run Conv2D kernel integration tests with reference C++ code with:

make -f tensorflow/lite/micro/tools/make/Makefile TARGET=xtensa TARGET_ARCH=hifi4 XTENSA_CORE= test_integration_tests_seanet_conv

And compare that to the optimized kernels by adding OPTIMIZED_KERNEL_DIR=xtensa:

make -f tensorflow/lite/micro/tools/make/Makefile TARGET=xtensa TARGET_ARCH=hifi4 OPTIMIZED_KERNEL_DIR=xtensa XTENSA_CORE= test_integration_tests_seanet_conv

Looking Ahead

While the work thus far has been primarily focused on convolutional neural networks, Google and Cadence are also working together to develop an optimized LSTM operator and have released a first example of an LSTM-based key-word recognizer. We expect to expand on this and continue to bring optimized and production-ready implementations of the latest developments in AI/ML to Tensilica Xtensa DSPs.

Acknowledgements

We would like to acknowledge a number of our colleagues who have contributed to making this collaboration successful.

Cadence: Manjunath CP, Bhanu Prakash Bandaru Venkata, Anirban Mandal

Google: Advait Jain, Deiqang Chen, Lawrence Chan, Marco Tagliasacchi, Nat Jeffries, Nick Kreeger, Pete Warden, Rocky Rhodes, Ting Yan, Yunpeng Li, Victor Ungureanu

Read More

Highlights from TensorFlow’s 2021 exploreCSR awards

Posted by Josh Gordon, Jocelyn Becker, and Sloan Davis for the TensorFlow team

Increasing the number of students pursuing computer science research is a priority at Google, especially for students from historically marginalized groups in the field. Since 2018, Google’s exploreCSR awards have aided higher education efforts that support students interested in pursuing graduate studies and research careers in computing.

The TensorFlow team is proud to provide additional funding to support this important program. To date, we have awarded more than 20 professors with funding to support their education and outreach work in machine learning.

We’d like to highlight examples of the many (and often, unique) outreach programs the 2021 award recipients have created so far. These range from research experiences with robotics, aquatic vehicles, federated learning, and offline digital libraries to mentored small group workshops on data science and programming skills. They’re sorted alphabetically by university below.

If you’re interested in creating your own programs like these with support from Google, keep an eye on the exploreCSR website for the next round of applications opening in June 2022.

Laura Hosman and Courtney Finkbeiner, Arizona State University

The SolarSPELL initiative at Arizona State University will host a workshop series thanks to support from exploreCSR to encourage students underrepresented in computer science research in their academic journey. The SolarSPELL initiative produces an offline, solar-powered digital library designed to bring educational content to resource-constrained locations that may lack electricity, internet connectivity, and/or traditional libraries.

The exploreCSR workshop series, titled “SolarSPELL exploreCSR: Computing for Good”, involves 6 weeks of sessions using SolarSPELL as a case study for how students can apply machine learning to tackle real-world problems and develop solutions for social good. Students will meet SolarSPELL’s co-director and learn about the history of the SolarSPELL initiative; learn about graduate programs available at ASU; and hear from guest panelists from industry.

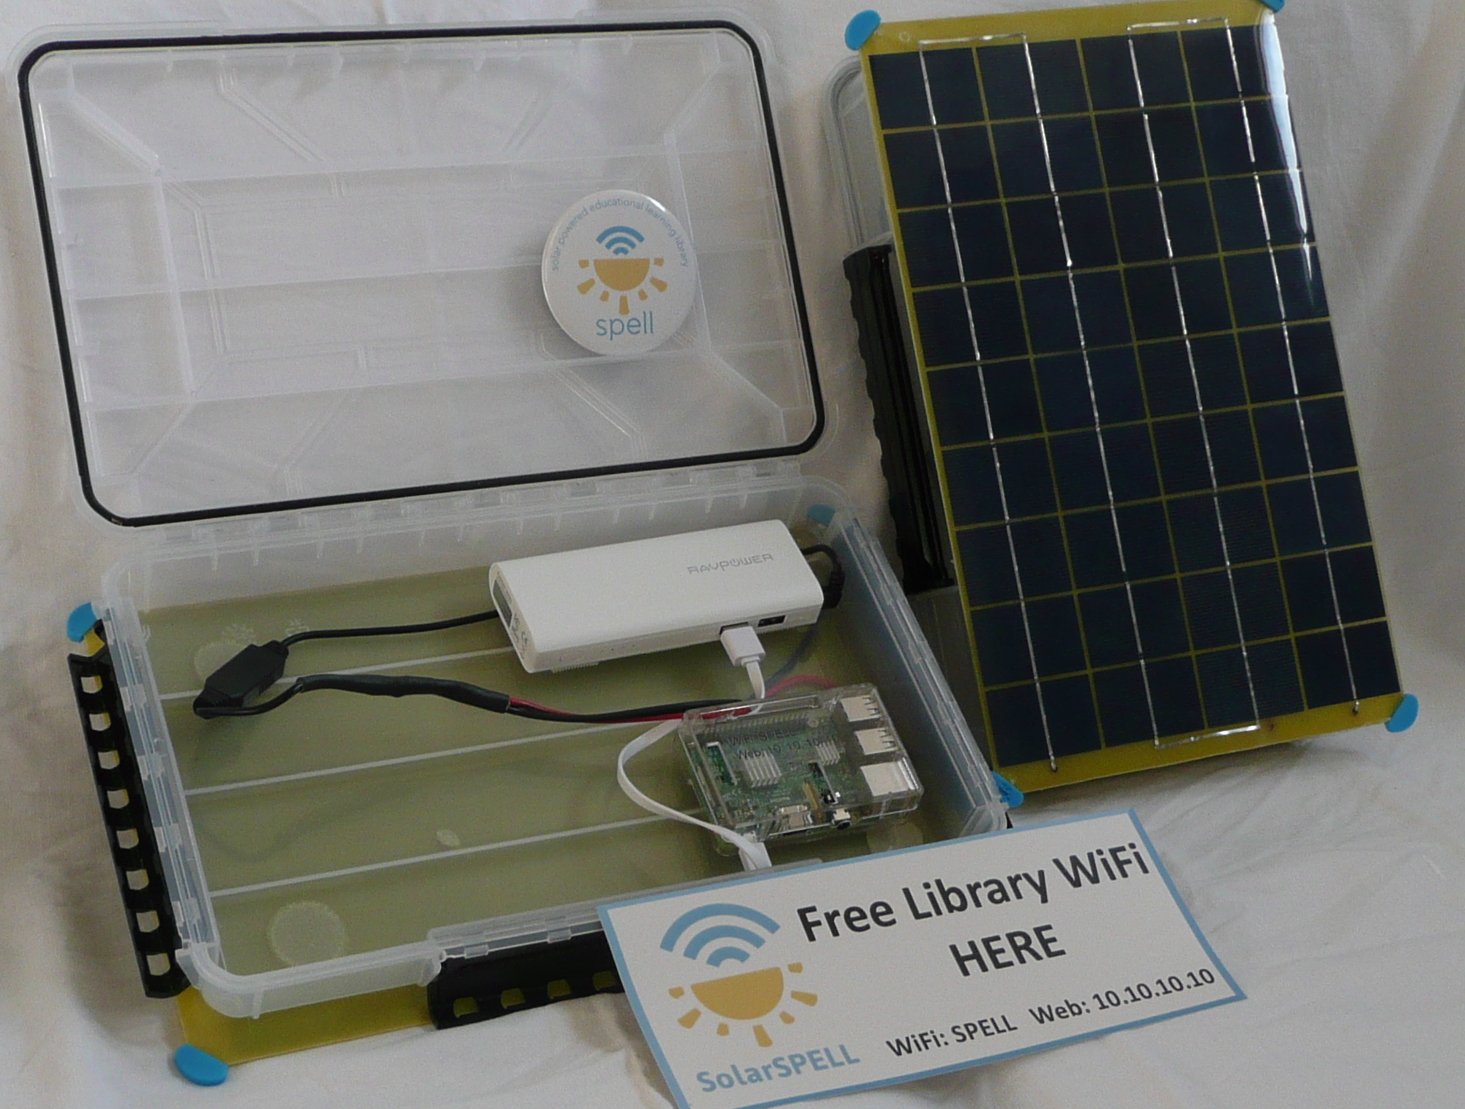
A solar-powered, offline digital library.

Aside from the information sessions, students will also gain hands-on experience working in teams and problem solving for real-world topics. The SolarSPELL team will present the students with three different challenges for student teams to develop a proposed solution using machine learning. Students will then be eligible to apply for paid summer fellowship positions with SolarSPELL to develop and integrate one of the proposed machine learning models into SolarSPELL’s technology.

SolarSPELL is a student-driven initiative, so the solutions that the exploreCSR students develop will be implemented in our digital libraries to improve hundreds of library users’ experiences around the world. With libraries in 10 countries in the Pacific Islands and East Africa, and plans to expand to Latin America and the Middle East, these students will have a far-reaching impact.

Daehan Kwak, Kean University

My colleague Xudong Zhang and I created an undergraduate research study group centered on computer vision, with projects underway on student attention detection, mask and social distancing detection, and pill recognition for healthcare scenarios. As one example, a student created a pill detection application using data from the National Library of Medicine pillbox. This can be used, for example, by high-volume distribution pharmacies to be more efficient and accurate, or by retirement homes to verify the pills a resident is taking. We’re pleased to share that the pill recognition project won third place in the Kean Business Plan Competition and was accepted to be presented at Posters on the Hill 2022.

Matthew Roberts, Macquarie University

The School of Computing at Macquarie University is working to lower the barrier to entry for students who are new to experimenting with ML by employing real-world examples. This month, around fifty students will spend the week testing their ideas for solving autonomous aquatic vehicles challenges (for example, navigation) under guidance from Macquarie University researchers. They will be developing their ideas with a sophisticated simulation environment, and the best solutions will be ready for deployment to real hardware testing in the water later in the year.

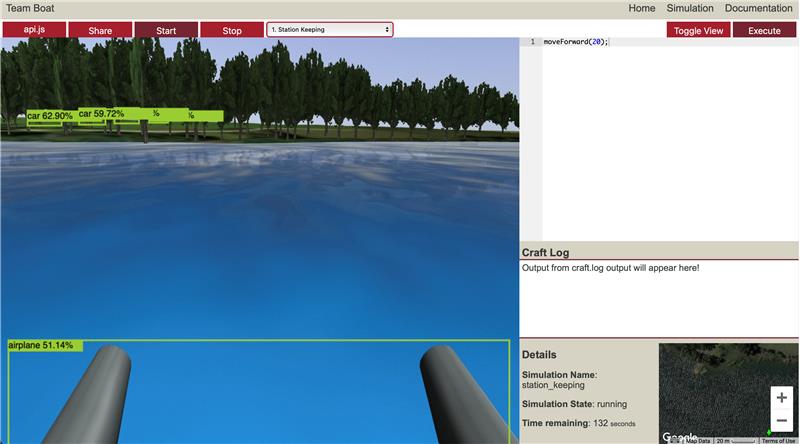
A MacSim simulation of the Sydney Regatta Center (created by VRX), a placeholder for a machine learning model, is making random predictions, ready for improvements the students come up with.

Accurately simulated sensors like cameras and LIDAR can be subjected to various models, allowing people to experiment with even more sophisticated ideas to solve complex problems. After our first year in exploreCSR, the adjustments we made to our simulator and the workshop will generate new ideas and light a spark for machine learning research early in students’ careers.

Pooyan Fazli, San Francisco State University

60+ students from 10 universities and colleges attended our 2-day virtual exploreCSR workshop. Participants were from San Francisco State University, CSU East Bay, CSU San Marcos, CSU Stanislaus, Foothill College, Northwestern University, San Diego State University, Sonoma State University, UC San Diego, and the University of San Francisco.

We had two invited speakers and two panels on mentorship and career pathways with 10 panelists from Google Research, Stanford, Emory University, Virginia Tech, and the University of Copenhagen.

As part of this workshop, we organized hands-on activities to introduce students to different aspects of AI and its applications for social good, such as with climate change. We also had mini-presentations and discussions on AI fairness, accountability, transparency and ethics in different areas, such as robotics, educational data mining, and impacts on underserved communities.

Following the workshop, selected students will participate in a research project under the guidance of graduate students and faculty during the spring semester. Through the research projects, we have a two-fold aim: to help students develop a sense of belonging in the AI and machine learning research community, and to illuminate a pathway for them to pursue graduate studies in AI/ML that explores the potential of developing responsible AI toward social good.

The research projects will begin with eight weekly meetups and hands-on training on Python programming with open-source publicly available materials. Then, students will engage in applied research projects that focus on AI applications for social good, such as health, environment, safety, education, climate change, and accessibility.

Farzana Rahman, Syracuse University

Earlier this year, the Electrical Engineering and Computer Science department of Syracuse University hosted RESORC (REsearch Exposure in Socially Relevant Computing), an exploreCSR program, for the second time. This program provided research exposure to 78 undergraduate students from SU and nearby institutions targeting populations historically underrepresented in computing. The goal of these two workshops was to give students an opportunity to learn machine learning using open-source tools, and to gain experience with data science workflows including collecting and labeling data, training a model, and carefully evaluating it. The ML workshops were the mostly highly rated sessions of the RESORC program.

Erin Hestir and Leigh Bernacchi, University of California, Merced

Since 2019, University of California, Merced has partnered with Merced College and California State University Stanislaus on the Google exploreCSR program ¡Valle! Get Your Start in Tech!, serving 32 Central Valley of California undergraduates in STEM annually to build a sense of belonging, practice professional networking, and develop technical skills. Participants convene on Zoom and in-person this semester. Valle students typically come from historically underrepresented groups, and the program is designed to support their pursuits of computational research, graduate school and computer science related careers. Many have gone on to achieve just that!

This year we added additional training thanks to Google Research to support machine learning applications for social good. This program is open to all Valle participants as well as partner schools, inclusive of graduate and undergraduate students in all STEM fields, and will be taught by creative graduate students in computer science from UC Merced. Each workshop will be taught by a near-peer mentor—a practice that supports mutual success in academics—and the mentor will coach teams to develop ML projects for social good.

The goal of the program is to overcome some of the trepidation scientists and students may have about computational science and machine learning through teamwork, fun and a higher purpose. Students will be able to develop their skills and interest, focusing on ML applications to climate, sustainability, agriculture and food, and diversity in tech and aviation.

Basak Guler, University of California, Riverside

At the University of California, Riverside, we created an undergraduate research study group focused on federated and distributed machine learning. Federated learning has become widely popular in recent years due to its communication efficiency and on-device learning architecture. Our study group meets on a weekly basis, and students learn about the principles of federated and distributed learning, state-of-the-art federated learning algorithms, recent applications from financial services to healthcare, as well as recent challenges and advances in privacy, security, and fairness. Student projects provide opportunities for undergraduate students to be involved in machine learning research, and learn from the experiences of both faculty and graduate students. This program can facilitate their transition from undergraduate to graduate degrees, and prepare them for positions of leadership in industry, government, public service, and academia.

Gonzalo A. Bello, University of Illinois at Chicago

The computer science department is hosting a series of exploreCSR workshops, including exploreCSR: Exploring Data Science Research, to introduce students to data science and machine learning research. These workshops aim to encourage students from historically underrepresented groups to pursue graduate studies and careers in research in the field of computer science. UIC students from all majors were encouraged to apply, including those who haven’t taken any computer science courses. Each semester, 60 students were selected out of more than 120 who applied, and 10 teaching assistants and a professor mentored students. In addition to lectures, students work on hands-on projects together where they explore, visualize, and build models using real-world data from the city of Chicago.

Melanie Moses and Humayra Tasnim, The University of New Mexico

The UNM Google exploreCSR activity for 2021-2022 is a semester-long course called Swarmathon: The Next Generation. The students will learn technical skills like developing machine learning models for object recognition in robots, and soft skills including team building, research skills, and discussions with faculty and external speakers. The UNM exploreCSR program builds on 5 years of training students in a NASA-sponsored robotics competition called the Swarmathon (2014-2019). In 2019/2020 we developed a series of exploreCSR Swarmathon: TNG workshops which included a faculty panel, an industry mentor, an open-source tutorial, and a day-long workshop to enable “Swarmie” robots to classify and automatically retrieve objects.

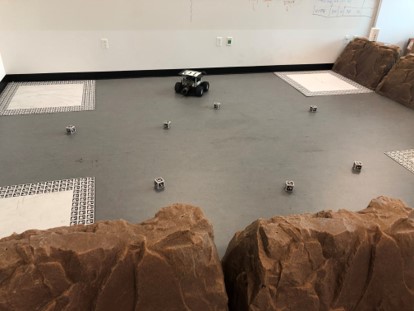
A glimpse of our robots in action.

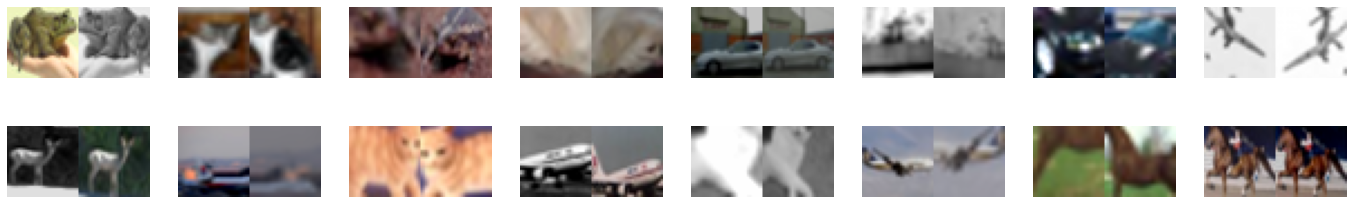
This year, in our exploreCSR Swarmathon: TNG course, students will have additional time to actively engage in developing and tuning their own machine learning models to test in the Swarmie robots. They will develop object detection models using convolutional neural networks (CNNs). They will be provided with a dataset of images of objects (shown below) taken from the robot camera and a simple model. The students will further develop the model and training data and then test their models on actual robots in real-time to see how much they can improve object recognition models to classify and retrieve the proper specified objects.

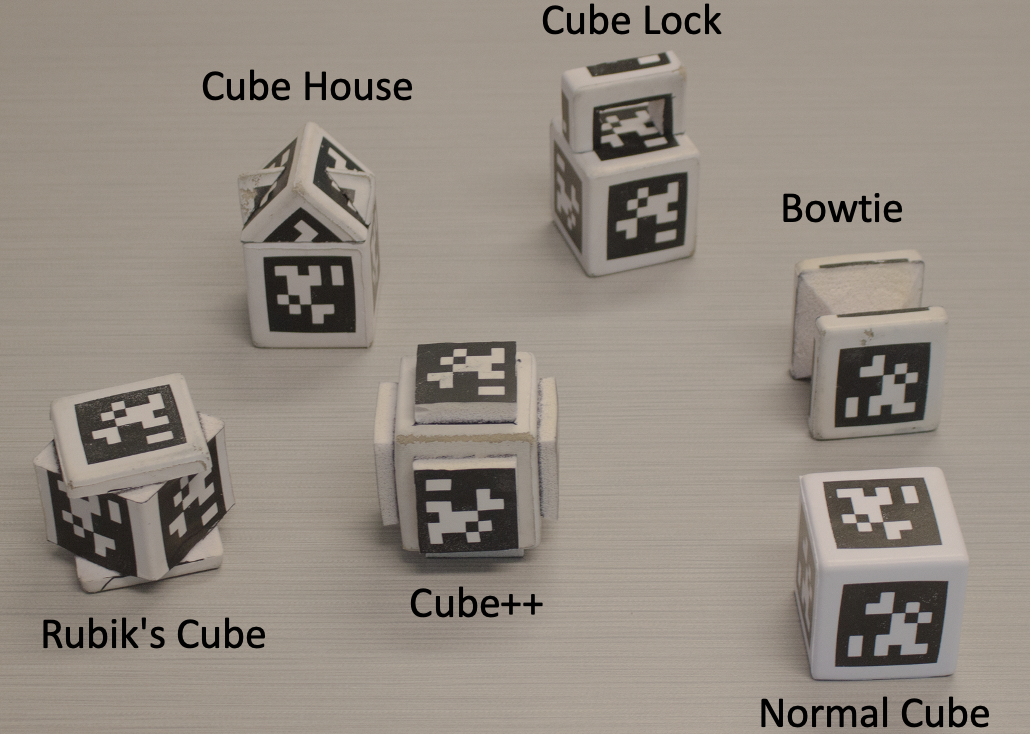
Different shaped cubes for detection.

Students will learn first-hand the reality gap between simulations and real-world experiments. This will encourage them to develop their own mini-research projects to enhance their model performance to resolve that gap. The exploreCSR-funded Swarmathon: TNG course will provide students with the opportunity to actively engage in hands-on robotics research. We hope the experience of defining a research objective, conducting a set of experiments, testing a model, and seeing results play out in our robotics arena will motivate students to attend graduate school and consider research careers.

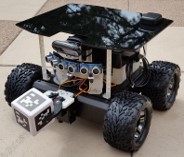
Swarmie with a cube in its gripper.

Daniel Mejía, The University of Texas at El Paso

We’re building a series of workshops open to undergraduate students of all majors to introduce them to applied machine learning and research topics, starting with foundational concepts in math and a newfound way of approaching a problem through the eyes of a data scientist. These workshops are open to all students, including those who do not have any prior experience. We hope to encourage students to consider pursuing graduate studies, especially those who may have not previously considered it. I believe that the earlier students are exposed, the more likely that they will pursue a graduate degree.

Henry Griffith, The University of Texas at San Antonio

At the University of Texas at San Antonio, we’re creating a portfolio of programs to enhance the persistence of first year Electrical and Computer Engineering students into research computing pathways. By integrating our programming with our Introduction to Electrical and Computer Engineering course, which has a total annual enrollment of approximately 200 students, we have the opportunity to achieve tremendous scale with our efforts. Our programs include an undergraduate research experience, a near-peer mentoring program, and group study projects – all designed to develop students’ professional and technical skills and to accelerate their progression into research opportunities.

John Akers, University of Washington

Our exploreCSR workshop, CSNext, is scheduled to begin this April. It’s a 4-week online program of workshops, seminars, and project work designed to encourage undergraduate students – particularly those from historically underrepresented groups – to consider and successfully apply to graduate schools in computer science. Participants will hear presentations from several University of Washington labs, such as Computer Vision/Graphics (GRAIL), Security and Privacy, and Human-Computer Interaction. There will be presentations on deep learning and on current graduate-level research, a panel discussion from current UW CSE grad students from varying backgrounds, opportunities to meet current graduate students from several UW CSE labs, and participants will be led through small-group exercises learning about active research from graduate student mentors. Participants will also learn about graduate school application processes and resources, led by staff from UW CSE Graduate Student Services.

Learning more

If you’re interested in creating your own programs like these with support from Google, keep an eye on the exploreCSR website for the next round of applications opening in June 2022.

Read More

Boost your model’s accuracy using self-supervised learning with TensorFlow Similarity

Posted by Elie Bursztein and Owen Vallis, Google

TensorFlow similarity now supports key self-supervised learning algorithms to help you boost your model’s accuracy when you don’t have a lot of labeled data.

Basic Self-Supervised Training.

Often when training a new machine learning classifier, we have a lot more unlabeled data, such as photos, than labeled examples. Self-supervised learning techniques aim at leveraging those unlabeled data to learn useful data representations to boost classifier accuracy via a pre-training phase on those unlabeled examples. The ability to tap into abundant unlabeled data can significantly improve model accuracy in some cases.

Perhaps the most well known example of successful self-supervised training are transformer models, such as BERT, that learn meaningful language representations by pre-training on very large quantities of text, e.g., wikipedia or the web.

Self-supervised learning can be applied to any type of data and at various data scales. For example, if you have only a few hundred labeled images, using self-supervised learning can boost your model accuracy by pre-training on a medium sized dataset such as ImageNet. For example, SimCLR uses the ImageNet ILSVRC-2012 dataset for training the representations and then evaluates the transfer learning performance on 12 other image datasets such as CIFAR, Oxford-IIIT Pets, Food-101, and others. Self-supervised learning works at larger scales as well, where pre-training on billions of examples improves accuracy as well, including text transformer and vision transformer.

High level overview of how self-supervised learning works for images.

At its core, self-supervised learning works by contrasting two augmented “views” of the same example. The model objective is to maximize the similarity between these views to learn representations that are useful for down-stream tasks, such as training a supervised classifier. In practice, after pre-training on a large corpus of unlabeled images, training an image classifier is done by adding a single softmax dense layer with a on top of the frozen pre-trained representation and training as usual using a small number of labeled examples.

Examples of pairs of augmented views on CIFAR10 from the hello world notebook.

TensorFlow Similarity currently provides three key approaches for learning self-supervised representations: SimCLR, SimSiam, Barlow Twins, that work out of the box. TensorFlow Similarity also provides all the necessary components to implement additional forms of unsupervised learning. These include, callbacks, metrics, and data samplers.

You can start to explore how to leverage a self-supervised learning hello world notebook that demonstrates how to double the accuracy on CIFAR10.

Read More

TFRT: A Progress Update

Posted by Mingsheng Hong, TFRT Tech Lead/Manager & Eric Johnson, TFRT Product Manager

Roughly two years ago, we announced an ambitious new Machine Learning (ML) runtime effort called TFRT (short for TensorFlow Runtime). We simultaneously provided a deep dive of the initial technical design and open-sourced its codebase.

Driven by trends in the ML ecosystem – larger and bigger models, ML being deployed to more diverse execution environments, and the need to keep up with continued research and modeling innovations – TFRT was started with the following set of goals in mind:

  • Deliver faster and cheaper execution for ML models
  • Enable more flexible deployment
  • Provide more modular and extensible infrastructure to facilitate innovations in ML infra and modeling

In this post, we share our progress to date, the experiences and lessons we’ve learned over the past two years of development, as well as what you can expect going forward.

Progress to Date

The last two years of development have largely been focused on implementing and validating our ambitious ideas by enabling Google’s most important internal workloads for users such as Ads and Search. To date, we have deployed TFRT broadly inside Google on a variety of training and inference workloads, and obtained great results.

Technical Lessons

How have we been able to achieve the above? Here are some interesting technical lessons that we learned, beyond what was in the original design:

First, async support is important for some of the key workloads (e.g. overlapping compute and I/O, and driving heterogeneous devices), while fast sync execution is critical for many other workloads, including small, “embedded” ML models.

We spent a lot of effort in designing and refining AsyncValue, a key low level abstraction in TFRT, which allows the host runtime to asynchronously drive devices, as well as invoking kernels. This led to improved device utilization due to the ability to overlap more computation and communication across hosts and devices. For example, we were able to successfully run bulk inference of an 80B-parameter model on one TPU chip with good performance by splitting the model into multiple stages and using TFRT to overlap variable transfer of the next stage with TPU computation of the current stage.

On the other hand, small CPU models that are embedded in application servers, invoked within the application process instead of via RPC/REST calls, remain critical for some of Google’s business workloads from users like Ads. For these models, the async-first internal design of TFRT initially caused a performance and resource regression. We worked with the Ads team to successfully address it, by extending the TFRT design with a synchronous interpreter, as well as an experimental memory planning optimization, to avoid heap allocation during kernel execution. We are working on productizing this extension.

This diagram below showcases the impact of the resulting TFRT design over a benchmark, as compared to “Current TF” which ran the old runtime before TFRT’s deployment. This benchmark focused on executing a tiny CPU model, where a large number of small matmuls executed sequentially. Notably, the optimized execution in TFRT (265 ns) is approaching the optimal baseline we set up (204 ns), via hand-written C++ code without any ML runtime overhead.

Second, while faster runtime execution is critical, optimizing the input program to reduce execution complexity is important as well.

Note that while compiler-based graph optimization should be performed when TF SavedModel is saved to the disk whenever possible, there are also important inference-time compiler optimizations that can only be performed with the knowledge of being in an inference context (e.g. when training variables remain constant).

As we were onboarding ML models onto TFRT, we had the chance to examine some of the models in depth, and identified new ways of rewriting and simplifying the program, before its execution. The simplified program, along with a faster execution of each kernel in the graph program, led to a nice compounding effect in the reduction of the execution latency and resource cost.

For example, in the left hand side graph program below, we were able to hoist the scalar op normalization computation (e.g. divide a float value by the max value of its domain), identical across all 18 input scalars, above the “concat” op, therefore enabling vectorized execution of the normalization, over a concatenated 1D float tensor.

While it is possible to perform this optimization at model training time as well, the compiler+runtime used to produce the trained model did not include this optimization.

In addition, we also find it critical to hoist computation from model execution time to load time whenever possible (e.g. const folding).

Third, cost-based execution is not just for SQL queries.

We developed a simple compile-time cost model (analogous to SQL query optimizer’s cost model) for TF op kernels, and applied cost-based optimization for ML model execution (see stream analysis), and achieved a better load balancing of the kernel execution across a set of threadpool threads. In contrast, TF1 has a runtime-based cost model, in which each operation’s runtime cost is profiled and used to guide that operation’s scheduling. In TFRT, we moved the cost analysis to compile-time, thus removing runtime cost. Also, our compiler approach allows the entire computational graph to be analyzed, thereby resulting in scheduling decisions that are optimal at a more global scope.

See this tech talk for more similarities between data and ML infra.

Looking Ahead

While we’ve certainly made some strong progress, especially with respect to our first goal – faster and cheaper execution – we admittedly still have work to do on enabling a more modular design and enabling more flexible deployments via hardware integration.

In terms of modularity, with the initial integration successes such as JAX’s adoption of TFRT device runtimes (e.g. CPU), we will continue to explore how TFRT could support workloads beyond just TensorFlow. We expect some of the TFRT components will also benefit the PyTorch/XLA workloads going forward.

Moreover, while we have successfully integrated CPU and TPU (with upcoming integration into Cloud TPU), the two most important device types at Google for ML computation, with NVIDIA GPU also in progress.

With respect to training workload, TFRT has been used as building blocks for Google’s large scale distributed training framework which are currently in active development.

As we look to the future, our organization has been exploring its integration with Pixel’s hardware SOC devices such as Google Tensor. In addition, due to TFRT’s proven success for Google’s internal workloads, it is also being integrated into new venues such as GCP’s Vertex AI and Waymo.

Special Thanks

The TFRT team has really enjoyed working on this new, ambitious infrastructure project. It has often felt like bootstrapping a new startup. With that in mind, we would like to give a huge shout out to everyone who has advised, contributed to and supported TFRT through this incredible 2-year journey:

(alphabetically) Adi Agrawal, Andrew Bernard, Andrew Leaver, Andy Selle, Ayush Dubey, Bangda Zhou, Bramandia Ramadhana, Catherine Payne, Ce Zheng, Chiachen Chou, Chao Xie, Christina Sorokin, Chuanhao Zhuge, Dan Hurt, Dong Lin, Eugene Zhulenev, Ewa Matejska, Hadi Hashemi, Haoliang Zhang, HanBin Yoon, Haoyu Zhang, Hongmin Fan, Jacques Pienaar, Jeff Dean, Jeremy Lau, Jordan Soyke, Jing Dong, Juanli Shen, Kemal El Moujahid, Kuangyuan Chen, Mehdi Amini, Ning Niu, Peter Gavin, Phil Sun, Pulkit Bhuwalka, Qiao Zhang, Raziel Alvarez, Russell Power, Sanjoy Das, Shengqi Zhu, Smit Hinsu, Tatiana Shpeisman, Tianrun Li, Tim Davis, Tom Black, Victor Akabutu, Vilobh Meshram, Xiao Yu, Xiaodan Song, Yiming Zhang, YC Ling, Youlong Chen, and Zhuoran Liu.

We would like to give special thanks to Chris Lattner for his initial technical leadership in bootstrapping this project, Martin Wicke for his support in TFRT throughout the first year, Alex Zaks for his support in TFRT during the second year and seeing through the impactful landing for Google’s ML serving workloads.

Read More

Body Segmentation with MediaPipe and TensorFlow.js

Posted by Ivan Grishchenko, Valentin Bazarevsky, Ahmed Sabie, Jason Mayes, Google

With the rise in interest around health and fitness, we have seen a growing number of TensorFlow.js users take their first steps in 2021 with our existing body related ML models, such as face mesh, body pose, and hand pose estimation.

Today we are launching two new highly optimized body segmentation models that are both accurate and fast as part of our updated body-segmentation and pose APIs in TensorFlow.js.

First is the BlazePose GHUM pose estimation model that now has additional support for segmentation. This model is part of our unified pose-detection API offering that can perform full body segmentation and 3D pose estimation simultaneously as shown in the animation below. It’s well suited for bodies in full view further away from the camera accurately capturing the feet and legs regions for example.

Try out the live demo!

The second model we are releasing is Selfie Segmentation that is well suited for cases where someone is directly in front of a webcam on a video call (<2 meters). This model that is part of our unified body-segmentation API can have higher accuracy across the upper body as shown in the animation below, but may be less accurate for the lower body in some situations.

Try out the live demo!

Both of these new models could enable a whole host of creative applications orientated around the human body that could drive next generation web apps. For example, the BlazePose GHUM Pose model may power services like digitally teleporting your presence anywhere in the world, estimating body measurements for a virtual tailor, or creating special effects for music videos and more, the possibilities are endless. In contrast the Selfie Segmentation model could enable user friendly features on web based video calls like the demo above where you can change or blur the background accurately.

Prior to this launch, many of our users may have tried our BodyPix model, which was state of the art when it launched. With today’s release, our two new models offer a much higher FPS and fidelity across devices for a variety of use cases.

Body Segmentation API Installation

The body-segmentation API provides two runtimes for the Selfie Segmentation model, namely the MediaPipe runtime and TensorFlow.js runtime.

To install the API and runtime library, you can either use the <script> tag in your html file or use NPM.

Through script tag:


<script src="https://cdn.jsdelivr.net/npm/@tensorflow/tfjs-backend-webgl">
<script src="https://cdn.jsdelivr.net/npm/@tensorflow-models/body-segmentation">

<!-- Optional: Include below scripts if you want to use TensorFlow.js runtime. -->
<script src="https://cdn.jsdelivr.net/npm/@tensorflow/tfjs-converter">

<!-- Optional: Include below scripts if you want to use MediaPipe runtime. -->
<script src="https://cdn.jsdelivr.net/npm/@mediapipe/selfie_segmentation">

Through NPM:

yarn add @tensorflow/tfjs-core @tensorflow/tfjs-backend-webgl
yarn add @tensorflow-models/body-segmentation

# Run below commands if you want to use TensorFlow.js runtime.
yarn add @tensorflow/tfjs-converter

# Run below commands if you want to use MediaPipe runtime.
yarn add @mediapipe/selfie_segmentation

To reference the API in your JS code, it depends on how you installed the library.

If installed through script tag, you can reference the library through the global namespace bodySegmentation.

If installed through NPM, you need to import the libraries first:

import '@tensorflow/tfjs-backend-core';
import '@tensorflow/tfjs-backend-webgl';
import * as bodySegmentation from '@tensorflow-models/body-segmentation';

// Uncomment the line below if you want to use TensorFlow.js runtime.
// import '@tensorflow/tfjs-converter';

// Uncomment the line below if you want to use MediaPipe runtime.
// import '@mediapipe/selfie_segmentation';

Try it yourself!

First, you need to create a segmenter:

const model = bodySegmentation.SupportedModels.MediaPipeSelfieSegmentation; // or 'BodyPix'

const segmenterConfig = {
runtime: 'mediapipe', // or 'tfjs'
modelType: 'general' // or 'landscape'
};

segmenter = await bodySegmentation.createSegmenter(model, segmenterConfig);

Choose a modelType that fits your application needs, there are two options for you to choose from: general, and landscape. From landscape to general, the accuracy increases while the inference speed decreases. Please try our live demo to compare different configurations.

Once you have a segmenter, you can pass in a video stream, static image, or TensorFlow.js tensors to segment people:

const video = document.getElementById('video');
const people = await segmenter.segmentPeople(video);

How to use the output?

The people result above represents an array of the found segmented people in the image frame. However, each model has its own semantics for a given segmentation.

For Selfie Segmentation, the array will be exactly of length 1, where the single segmentation corresponds to all people in the image frame. For each segmentation, it contains maskValueToLabel and mask properties detailed below.

The mask field stores an object which provides access to the underlying results of the segmentation. You can then utilize the provided asynchronous conversion functions such as toCanvasImageSource, toImageData, and toTensor depending on the desired output type that you want for efficiency.

It should be noted that different models have different internal representations of data. Therefore converting from one form to another may be expensive. In the name of efficiency, you can call getUnderlyingType to determine what form the segmentation is in already so you may choose to keep it in the same form for faster results.

The semantics of the RGBA values of the mask are as follows: the image mask is the same size as the input image, where green and blue channels are always set to 0. Different red values denote different body parts (see maskValueToLabel key below). Different alpha values denote the probability of a pixel being a body part pixel (0 being lowest probability and 255 being highest).

maskValueToLabel maps pixel’s red channel value to the segmented part name for that pixel. This is not necessarily the same across different models (for example SelfieSegmentation will always return ‘person’ since it does not distinguish individual body parts, whereas a model like BodyPix would return the name of individual body parts that it can distinguish for each segmented pixel). See below output snippet for example:

[
{
maskValueToLabel: (maskValue: number) => { return 'person' },
mask: {
toCanvasImageSource(): ...
toImageData(): ...
toTensor(): ...
getUnderlyingType(): ...
}
}
]

We also provide an optional utility function that you can use to render the result of the segmentation. Use the toBinaryMask function to convert the segmentation to an ImageData object.

This function takes 5 parameters, the last 4 being optional:

  1. Segmentation results from segmentPeople call above.
  2. Foreground color – an object representing the RGBA values to use for rendering foreground pixels.
  3. Background color – object with RGBA values for background pixels
  4. Draw Contour – boolean value if to draw a contour line around the body of the found person.
  5. Foreground threshold – at what point a pixel should be considered a foreground pixel vs background pixel. This is a floating point value from 0 to 1.

Once you have the imageData object from toBinaryMask you can use the drawMask function to render it to a canvas of your choice.

Example code for using these two functions is shown below:

const foregroundColor = {r: 0, g: 0, b: 0, a: 0};
const backgroundColor = {r: 0, g: 0, b: 0, a: 255};
const drawContour = true;
const foregroundThreshold = 0.6;

const backgroundDarkeningMask = await bodySegmentation.toBinaryMask(people, foregroundColor, backgroundColor, drawContour, foregroundThreshold);

const opacity = 0.7;
const maskBlurAmount = 3; // Number of pixels to blur by.
const canvas = document.getElementById('canvas');

const people = await bodySegmentation.drawMask(canvas, video, backgroundDarkeningMask, opacity, maskBlurAmount);

Pose Detection API Usage

To load and use the BlazePose GHUM model please reference the unified Pose API documentation. This model has three outputs:

  1. 2D keypoints
  2. 3D keypoints
  3. Segmentation for each found pose.

If you need to grab the segmentation from the pose results, you can simply grab a reference to that pose’s segmentation property a shown:

const poses = await detector.estimatePoses(video);
const firstSegmentation = poses.length > 0 ? poses[0].segmentation : null;


Models deep dive

BlazePose GHUM and MediaPipe Selfie Segmentation models segment the prominent humans in the frame. Both run in real-time across laptops and smartphones but vary in intended applications as discussed at the start of this blog. Selfie Segmentation focuses on selfie effects and conferencing for closeup cases (< 2m) where as BlazePose GHUM specializes in full-body cases like yoga, fitness, dance and works up to 4 meters from the camera.

Selfie Segmentation

Selfie Segmentation model predicts binary segmentation mask of foreground with humans. The pipeline is structured to run entirely on GPU, from image acquisition over neural network inference to rendering the segmented result on the screen. It avoids slow CPU-GPU syncs and achieves the maximum performance. Variations of the model are powering background replacement in Google Meet and a more general model is now available in TensorFlow.js and MediaPipe.

BlazePose GHUM 2D landmarks and body segmentation

BlazePose GHUM model now provides a body segmentation mask in addition to 2D and 3D landmarks introduced earlier. Having a single model that predicts both outputs gives us two gains. First, it allows outputs to supervise and improve each other as landmarks give semantic structure while segmentation focuses on edges. Second, it guarantees that predicted mask and points belong to the same person, which is hard to achieve with separate models. As BlazePose GHUM model runs only on the ROI crop of a person (vs. full image), segmentation mask quality depends only on the effective resolution within the ROI and doesn’t change a lot when moving closer or further from the camera.

Conference

ASL

Yoga

Dance

HIIT

BlazePose GHUM (full)

95.50%

96.52%

94.73%

94.55%

95.16%

Selfie Segmentation (256×256)

97.60%

97.88%

80.66%

86.33%

85.53%

BlazePose GHUM and Selfie Segmentation IOUs across different domains

MediaPipe and TensorFlow.js runtime

There are some pros and cons of using each runtime. As shown in the performance tables below, the MediaPipe runtime provides faster inference speed on desktop, laptop and android phones. The TensorFlow.js runtime provides faster inference speed on iPhones and iPads.

FPS numbers here are the time taken to perform the inference through the model and wait for the GPU and CPU to sync. This is done to ensure the GPU has fully finished for benchmarking purposes, but for pure-GPU production pipelines no waiting is needed, so your numbers may be higher still. For pure GPU pipeline, if you are using the MediaPipe runtime, just use await mask.toCanvasImageSource(), and if you are using the TF.js runtime, reference this example on how to use texture directly to stay on GPU for rendering effects.

Benchmarks

Selfie segmentation model

MacBook Pro 15” 2019. 

Intel core i9. 

AMD Radeon Pro Vega 20 Graphics.

(FPS)

iPhone 11

(FPS – CPU Only for MediaPipe)

Pixel 6 Pro

(FPS)

Desktop PC 

Intel i9-10900K. Nvidia GTX 1070 GPU.

(FPS)

MediaPipe Runtime

With WASM & GPU Accel.

125 | 130

31 |  21

35 | 33

185 | 225

TFJS Runtime

With WebGL backend.

74 | 45

42 | 30

25 | 23

80 | 62

Inference speed of Selfie Segmentation across different devices and runtimes. The first number in each cell is for the landscape model, and the second number is for the general model.

BlazePose GHUM model

MacBook Pro 15” 2019. 

Intel core i9. 

AMD Radeon Pro Vega 20 Graphics.

(FPS)

iPhone 11

(FPS – CPU Only for MediaPipe)

Pixel 6 Pro

(FPS)

Desktop PC 

Intel i9-10900K. Nvidia GTX 1070 GPU.

(FPS)

MediaPipe Runtime

With WASM & GPU Accel

70 | 59 | 31

8 | 5 | 1

22 | 19 | 10

123 | 112 |  70

TFJS Runtime

With WebGL backend.

42 | 36 | 22

14 | 12 | 8

12 | 10 | 6

35  | 33 | 26

Inference speed of BlazePose GHUM full body segmentation across different devices and runtimes. The first number in each cell is the lite model, second number is the full model, and third number is the heavy version of the model. Note that the segmentation output can be turned off by setting enableSegmentation to false in the model parameters, which would increase the model performance.

Looking to the future

We are constantly working on new features and quality improvements of our tech (for instance this is the third BlazePose GHUM update in the last year after initial 2D release and consequent 3D update), so expect new exciting updates in the near future.

Acknowledgements

We would like to acknowledge our colleagues who participated in or sponsored creating Selfie Segmentation, BlazePose GHUM and building the APIs: Siargey Pisarchyk, Tingbo Hou, Artsiom Ablavatski, Karthik Raveendran, Eduard Gabriel Bazavan, Andrei Zanfir, Cristian Sminchisescu, Chuo-Ling Chang, Matthias Grundmann, Michael Hays, Tyler Mullen, Na Li, Ping Yu.

Read More

Improved TensorFlow 2.7 Operations for Faster Recommenders with NVIDIA

A guest post by Valerie Sarge, Shashank Verma, Ben Barsdell, James Sohn, Hao Wu, and Vartika Singh from NVIDIA

Recommenders personalize our experiences just about everywhere you can think of. They help you choose a movie for Saturday night, or discover a new artist when you’ve looped over your go-to playlist one too many times. They are one of the most important applications of deep learning, yet as it stands today, recommenders remain some of the most challenging models to accelerate due to their data requirements. This doesn’t just mean speeding up inference, but also training workflows so developers can iterate quickly. In this article, we’ll discuss what bottlenecks are typically observed with recommender workloads in practice, and how they can be identified and alleviated.

NVIDIA GPUs are great at handling parallelized computation, and have been successful in deep learning domains like Computer Vision (CV) or Natural Language Processing (NLP) where computation itself is usually the dominant factor in throughput as compared to the time it takes to bring the data itself to the model. However, modern recommenders tend to be memory and I/O bound as opposed to compute bound.

Recommenders are memory intensive

Modern recommenders can have hundreds of features, with many categorical features and cardinalities to the order of hundreds of millions! Take a “userID” feature for example. It isn’t too hard to imagine a hundred million distinct users. On occasion, the cumulative embedding tables may become so large that they would be hard to fit on a single GPU’s memory. Additionally, these large embedding tables involve pure memory lookups, whereas the deep neural networks themselves may be much smaller in terms of their memory footprint.

That being said, the latest advancements in NVIDIA GPU technology, especially increasingly large GPU memories and higher memory bandwidths, are progressively making GPUs even better candidates for accelerating recommenders. For instance, an NVIDIA A100 GPU 80GB has 80GB HBM2 memory with 2.0TB/s bandwidth compared to tens of GB/s bandwidth of CPU memory. This is in addition to a 40MB L2 cache that provides a whopping 6TB/s read bandwidth!

Recommenders are I/O bound

In practice, you may find that recommenders tend to underutilize GPUs as they are often bound by host-to-device memory transfer bottlenecks. Reading from CPU memory into GPUs (and vice versa) is expensive! It follows that avoiding frequent data transfers between the CPU and GPU should help improve performance. Yet, many TensorFlow ops relevant to recommenders don’t have a GPU implementation which leads to unavoidable back and forth data transfers between the CPU and GPU. Additionally, in typical recommender models the compute load itself is usually quite small as compared to NLP or CV models, and training tends to get held up by data loading.

Identifying bottlenecks

Deep learning application performance can be limited by one or more portions of the training work, such as the input data pipeline (e.g. data loading and preprocessing), computationally-intensive layers, and/or memory reads and writes. The TensorFlow profiler, with its Trace Viewer illustrating a timeline of events for CPU and GPU, can help you identify performance bottlenecks.

The figure below shows a capture of the Trace Viewer from training a Wide & Deep (W&D) model on synthetic data in TensorFlow 2.4.3.

Figure 1: Traces from training a W&D model on synthetic data in TensorFlow 2.4.3.

In this capture, we can see that a few types of ops are responsible for much of the training time on the CPU. Some names are cut off, but these include:

You may also notice that there are many small memory copies in this profile, see Figure 1 Stream #14(MemcpyH2D) and Stream #15(MemcpyD2H). At the core of DenseFeatures and embedding_lookup_sparse, ops like ResourceGather fetch the needed weights from embedding tables. Here ResourceGather is performed on the GPU, but ops before and after it only have CPU implementations so data is copied back and forth between the CPU and GPU. This transfer is bound by the PCIe bandwidth, which is typically an order of magnitude slower than the GPU memory bandwidth. Additionally, though most individual copies are small, each takes time to launch, so they can be time-consuming in aggregate.

Accelerating recommenders by implementing GPU sparse operations

To accelerate ops like the SparseSegmentMean and Unique executed on the CPU in Figure 1 and reduce the time spent in resulting copies, TensorFlow 2.7 includes GPU implementations for a number of ops used by embedding functions, such as:

  • SparseReshape
  • SparseFillEmptyRows
  • SparseFillEmptyRowsGrad
  • Unique
  • SparseSegmentMean
  • SparseSegmentMeanGrad

Several of the new GPU kernels leverage the CUDA CUB library to accelerate GPU primitives like scan and sort that are needed for sparse indexing calculations. The most intensive ops, SparseSegmentMean and SparseSegmentMeanGrad, use a custom GPU kernel that performs vectorized loads and stores to maximize memory throughput.

Now, let’s take a look at what these improvements mean in practice.

Benchmarks

Let’s compare training runs of a model based on the Wide & Deep architecture with TensorFlow version 2.4.3-GPU, the latest version before the above GPU sparse ops were implemented, and version 2.7.0-GPU, the first version to include all these GPU ops. The model includes 1 binary label, 10 numerical features, and 40 categorical features (3 of which are 10-hot, others are 1-hot).

In the following suite of benchmarks, some categorical features can take several values for each data point (i.e. they are “multi-hot”). As an example, a “history” feature in a movie recommendation use case could be a list of movies a user has previously watched. In comparison, a single-hot feature can take exactly one value. For the rest of this post, the term “n-hot” represents a multi-hot categorical feature that can take up to n values. Collectively, the embedding tables for all features in the model are 9.1 GB. The identity categorical column was used for these features except where the benchmark states otherwise.

The wide portions of the model use keras.layers.Embedding and the deep portions use keras.layers.DenseFeatures. These training runs use synthetic data read from a TFRecord file (described below in “Accelerating dataloading”), batch size 131,072, and the SGD optimizer. Performance data was recorded on a system with a single NVIDIA A100-80GB GPU and 2x AMD EPYC 7742 64-Core CPU @ 2.25GHz.

Figure 2: Training throughput (in samples/second)

From the figure above, going from TF 2.4.3 to TF 2.7.0, we observe a ~73.5% reduction in the training step. This equates to roughly a 3.77x training speedup on an NVIDIA A100-80GB from simply upgrading to TF 2.7.0! Let’s take a closer look at the changes that enabled this improvement.

Figure 3: Training step time speedup between versions when using exclusively identity categorical columns (3.77x) vs exclusively hashed categorical columns (5.55x) in the test model. Hashed categorical columns show additional speedup thanks to a new GPU integer hashing op.

Both identity and hashed categorical columns benefit from the new GPU kernels. Because many of these ops were previously performed on the CPU in parallel to other parts of training, it is difficult to quantify the speedup from each, but these new kernels are collectively responsible for the majority of performance improvement.

Hashed categorical columns also benefit from a new GPU op (TensorToHashBucket) that replaces the previous AsString + StringToHashBucketFast hashing method in the Grappler pass. These ops were previously very time-consuming, so the test model using hashed categorical columns shows a larger improvement in the training step time.

Figure 4: Comparison of time spent in device-to-host and host-to-device memory copies. Availability of GPU kernels for ops in TensorFlow 2.7.0 saves time by avoiding extra copies.

In addition to speedups from the GPU kernels themselves, some time is saved by performing fewer data copies. We previously mentioned that extra host-to-device and device-to-host copies are required when an op placed on the GPU is followed by one on the CPU or vice versa. Figure 4 shows the substantial reduction in time spent on copies from enabling more ops to be placed on the GPU.

Accelerating dataloading

Recommender training is frequently limited by the speed of loading data from disk. Below are three common ways to identity the data loading bottleneck:

  1. Profiling the network reveals that the largest chunk of the training time is taken up by the dataloader.
  2. The training step time remains the same after removing most of the layers.
  3. Training runs much faster with constant or random dummy inputs to the model

In the examples so far, we have read data from a set of TFRecord files that have our synthetic input data pre-arranged into batches to avoid being limited by data loading (as that would make it difficult to see the speedup from the new changes, which affect operations within the network itself). In TFRecord files, normally each set of inputs is stored as a separate entry and batches are constructed after loading and shuffling data. For datasets with many small features, this can consume significant disk space because each entry is stored and labeled separately. For example, our test model has a binary label, 10 numerical features, and 40 categorical features (three 10-hot and the rest 1-hot). Each entry in a TFRecord of this model’s data contains a single floating-point value for each numerical feature and the appropriate number of integer values for each categorical feature. A dataset of about 4 million inputs takes up 4.1GB on disk in this basic format.

Now consider a record file where each entry contains an entire batch of 131,072 inputs for this model (so for each numerical feature, the entry will contain 131,072 serialized floating point values). The same dataset of 4 million inputs requires only 803MB on disk in this format, and training is more than 7x faster.

Figure 5: The training step is over 7x faster after prebatching the input TFRecord dataset. While more thorough shuffling is possible with non-prebatched inputs, overhead is significant compared to negligible overhead from shuffling the order of prebatched input batches.

Depending on how your data engineering pipeline is set up, you may have to add a component which creates the prebatched data. A side effect of prebatching data is that the batch size and contents are largely predefined at the time of writing the TFRecord. It is possible to work around these limitations (for example, by concatenating multiple batches from the file to increase the batch size at training time) but some flexibility might be lost.

TensorFlow custom embedding plugins

The size and scale of recommenders grow rapidly, and it’s not uncommon to see recommender models in TBs (e.g. Google’s 1.2-TB model). Another great option to accelerate recommender training on NVIDIA GPUs, especially at multi-GPU and multi-node scale, is a TF custom embedding plugin. This CUDA-based plugin distributes large embedding tables across multiple GPUs and nodes for model-parallel multi-GPU training out-of-the-box. It works as a GPU plug-in enhancement for TF native embedding layers such as tf.nn.embedding_lookup and tf.nn.embedding_lookup_sparse. With TensorFlow version 2.5 and above, a single NVIDIA A100 GPU benchmark using a model with 100 ten-hot categorical features shows 7.9x speedup in average training iteration time with the TF custom embedding plugin, and the speedup increases to 23.6x on four NVIDIA A100 GPUs. Check out this article for an overview of this plugin and more information.

Conclusion

Recommenders present a challenging workload to accelerate. Advancements in NVIDIA GPU technology with increasingly large memories, memory bandwidths, and ever powerful parallel compute greatly benefit modern recommendation systems at scale.

We have added GPU implementations of several ops in TensorFlow that did not have one previously, massively improving training times, thus reducing the time a data scientist might spend experimenting and creating recommender models. Moreover, there is another option available to accelerate embedding layers on NVIDIA GPUs through the TF custom embedding plugin.

Read More